


Analyzing How Gen4 NVMe Drive Performance Scales on the PowerEdge R7525
Download PDFMon, 16 Jan 2023 23:31:22 -0000
|Read Time: 0 minutes
Summary
Gen4 NVMe drives double the PCIe speeds of Gen3 from 1GB/s to 2GB/s per lane, effectively increasing the performance capability by two times. However, users also need to understand how Gen4 NVMe performance scales when more than one drive is loaded into a populated server running workloads. This DfD will analyze how various IO profiles scale when more than one Gen4 NVMe drive is loaded into a PowerEdge R7525.
PCIe 4.0 History and Gen4 NVMe Scaling
PCIe 4.0 was released in 2019, following its predecessor with double the bandwidth (up to 64GB/s), bit rate (up to 16GT/s) and frequency (up to 16GHz). AMD released the first motherboards to support PCIe 4.0 in early 2020, while Intel motherboards with PCIe 4.0 support are scheduled to begin releasing by the end of 2020. Gen4 NVMe drives were introduced shortly after the release of PCIe 4.0 to capitalize on its specification improvements; allowing performance metrics to double (if the same number of lanes are used). Although these numbers look enticing at first glance, very little data has been gathered around how Gen4 NVMe drives perform when scaled in a datacenter server running workloads. What is the sweet spot? When does the performance curve begin to plateau? The Dell Technologies engineering team constructed an in-house test setup to obtain data points that will help users understand IOPS and bandwidth trends when scaling Gen4 NVMe drives.

Figure 1 - Samsung PM1733 Gen4 NVMe
Test Setup
The PowerEdge R7525 was used as the host server, as it is one of the first Dell EMC servers to support PCIe 4.0. The Samsung PM1733 Gen4 NVMe drive was connected using CPU direct attach and then scaled. Measurements were taken for 1, 2, 4, 8, 12 and 24 drives. The IOmeter benchmark was used to simulate data center workloads running on NVMe drives to achieve the maximum raw performance data. FIO was used as a supplemental benchmark as well. *Note that these benchmark results are not directly applicable to file systems or application workloads.
Random reads (RR) and writes (RW) were measured in Input/Output operations per second (IOPS). Online Transaction Processing (OLTP), useful for measuring database workloads, is also measured in IOPS. Sequential reads (SR) and writes (SW) were measured in mebibyte per second (MiBPs).
Test Results
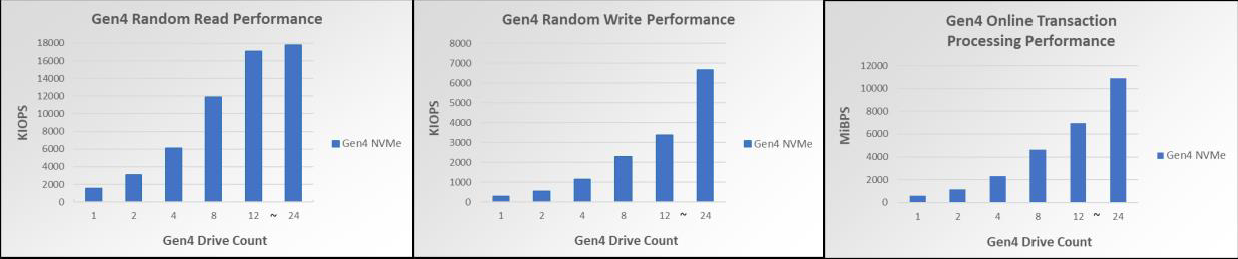
Figure 2 – Gen4 NVMe RR perf scaling for up to 24 drives Figure 3 –Gen4 NVMe RW perf scaling for up to 24 drives Figure 4 – Gen4 NVMe OLTP perf scaling per drive for up to 24 drives
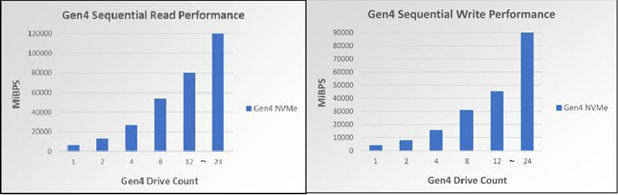
Figure 5 –Gen4 NVMe SR perf scaling for up to 24 drives Figure 6 –Gen4 NVMe SW perf scaling for up to 24 drives
As seen in Figures 2-6, the Gen4 NVMe drives have remarkable performance. One Gen3 NVMe drive commonly has 4K RR performance in the triple-digit KIOPS, but one Gen4 NVMe drive is within the quad-digit KIOPS for 4K RR. Scaling to 12 Gen4 NVMe drives shows 17M 4KiB RR IOPS, allowing for extraordinary amounts of data to be read randomly from the disk at one time. Scaling to 12 Gen4 NVMe drives also has a notable 80.41GiBs at 128KiB, a number very close to the theoretical maximum line rate of 94.5 128K SR GBPS. Lastly, 4K OLTP benchmark speeds are also nearly 2 times faster than Gen3 NVMe drives.
Furthermore, these bar graphs demonstrate that each profile scales linearly for up to 12 drives. The benchmarked synthetic workloads received linear performance improvements with up to 12 NVMe drives scaled, and each performance readout also scaled very closely to its theoretical maximum. However, once the jump from 12 to 24 drives is made, two of the IO profiles (in particular, the RR and SR profiles) stop scaling linearly and become less optimized. When accounting for the fact CPU utilization is at 90%, it is to be expected that scaling beyond 12 drives will not give linear performance increases for all IO profiles.
Conclusion
Customers seeking to scale their Gen4 NVMe drives will be pleased to know that all IO Profile performance readings scaled linearly for up to 12 drives, while only some of the IO Profiles did for up to 24 drives. Servers and systems running workloads like data analytics, AI, ML, DL and databases can greatly benefit from this increase in IOPS and throughput when scaling Gen4 NVMe devices for up to 12 drives.
Related Documents

Analyzing How Gen4 NVMe Drive Performance Scales on the PowerEdge R7525
Mon, 16 Jan 2023 13:44:23 -0000
|Read Time: 0 minutes
Summary
Gen4 NVMe drives double the PCIe speeds of Gen3 from 1GB/s to 2GB/s per lane, effectively increasing the performance capability by two times. However, users also need to understand how Gen4 NVMe performance scales when more than one drive is loaded into a populated server running workloads. This DfD will analyze how various IO profiles scale when more than one Gen4 NVMe drive is loaded into a PowerEdge R7525.
PCIe 4.0 History and Gen4 NVMe Scaling
PCIe 4.0 was released in 2019, following its predecessor with double the bandwidth (up to 64GB/s), bit rate (up to 16GT/s) and frequency (up to 16GHz). AMD released the first motherboards to support PCIe
4.0 in early 2020, while Intel motherboards with PCIe 4.0 support are scheduled to begin releasing by the end of 2020. Gen4 NVMe drives were introduced shortly after the release of PCIe 4.0 to capitalize on its specification improvements; allowing performance metrics to double (if the same number of lanes are used).
Although these numbers look enticing at first glance, very little data has been gathered around how Gen4 NVMe drives perform when scaled in a datacenter server running workloads. What is the sweet spot? When does the performance curve begin to plateau? The Dell Technologies engineering team constructed an in-house test setup to obtain data points that will help users understand IOPS and bandwidth trends when scaling Gen4 NVMe drives.
Test Setup
The PowerEdge R7525 was used as the host server, as it s one of the first Dell EMC servers to support PCIe 4.0.
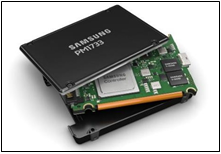
Figure 1 - Samsung PM1733 Gen4 NVMe
The Samsung PM1733 Gen4 NVMe drive was connected using CPU direct attach and then scaled. Measurements were taken for 1, 2, 4, 8, 12 and 24 drives. The IOmeter benchmark was used to simulate data center workloads running on NVMe drives to achieve the maximum raw performance data. FIO was used as a supplemental benchmark as well. *Note that these benchmark results are not directly applicable to file systems or application workloads.
Random reads (RR) and writes (RW) were measured in Input/Output operations per second (IOPS). Online Transaction Processing (OLTP), useful for measuring database workloads, is also measured in IOPS. Sequential reads (SR) and writes (SW) were measured in mebibyte per second (MiBPs).
Test Results
Figure 2 – Gen4 NVMe RR perf scaling for up to 24 drives Figure 3 –Gen4 NVMe RW perf scaling for up to 24 drives Figure 4 – Gen4 NVMe OLTP perf scaling per drive for up to 24 drives
Figure 5 –Gen4 NVMe SR perf scaling for up to 24 drives Figure 6 –Gen4 NVMe SW perf scaling for up to 24 drives
As seen in Figures 2-6, the Gen4 NVMe drives have remarkable performance. One Gen3 NVMe drive commonly has 4K RR performance in the triple-digit KIOPS, but one Gen4 NVMe drive is within the quad-digit KIOPS for 4K RR. Scaling to 12 Gen4 NVMe drives shows 17M 4KiB RR IOPS, allowing for extraordinary amounts of data to be read randomly from the disk at one time. Scaling to 12 Gen4 NVMe drives also has a notable 80.41GiBs at 128KiB, a number very close to the theoretical maximum line rate of 94.5 128K SR GBPS. Lastly, 4K OLTP benchmark speeds are also nearly 2 times faster than Gen3 NVMe drives.
Furthermore, these bar graphs demonstrate that each profile scales linearly for up to 12 drives. The benchmarked synthetic workloads received linear performance improvements with up to 12 NVMe drives scaled, and each performance readout also scaled very closely to its theoretical maximum. However, once the jump from 12 to 24 drives is made, two of the IO profiles (in particular, the RR and SR profiles) stop scaling linearly and become less optimized. When accounting for the fact CPU utilization is at 90%, it is to be expected that scaling beyond 12 drives will not give linear performance increases for all IO profiles.
Conclusion
Customers seeking to scale their Gen4 NVMe drives will be pleased to know that all IO Profile performance readings scaled linearly for up to 12 drives, while only some of the IO Profiles did for up to 24 drives. Servers and systems running workloads like data analytics, AI, ML, DL and databases can greatly benefit from this increase in IOPS and throughput when scaling Gen4 NVMe devices for up to 12 drives.

Efficient Machine Learning Inference on Dell EMC PowerEdge R7525 and R7515 Servers using NVIDIA GPUs
Tue, 17 Jan 2023 00:28:16 -0000
|Read Time: 0 minutes
Summary
Dell EMC™ participated in the MLPerf™ Consortium v0.7 result submissions for machine learning. This DfD presents results for two AMD PowerEdge™ server platforms - the R7515 and R7525. The results show that Dell EMC with AMD processor-based servers when paired with various NVIDIA GPUs offer industry-leading inference performance capability and flexibility required to match the compute requirements for AI workloads.
MLPerf Inference Benchmarks
The MLPerf (https://mlperf.org) Inference is a benchmark suite for measuring how fast Machine Learning (ML) and Deep Learning (DL) systems can process inputs and produce results using a trained model. The benchmarks belong to a very diversified set of ML use cases that are popular in the industry and provide a need for competitive hardware to perform ML-specific tasks. Hence, good performance under these benchmarks signifies a hardware setup that is well optimized for real world ML inferencing use cases. The second iteration of the suite (v0.7) has evolved to represent relevant industry use cases in the datacenter and edge. Users can compare overall system performance in AI use cases of natural language processing, medical imaging, recommendation systems and speech recognition as well as different use cases in computer vision.
MLPerf Inference v0.7
The MLPerf inference benchmark measures how fast a system can perform ML inference using a trained model with new data in a variety of deployment scenarios, see below Table 1 with the list of seven mature models included in the official v0.7 release:
Model | Reference Application | Dataset |
resnet50-v1.5 | vision / classification and detection | ImageNet (224x224) |
ssd-mobilenet 300x300 | vision / classification and detection | COCO (300x300) |
ssd-resnet34 1200x1200 | vision / classification and detection | COCO (1200x1200) |
bert | language | squad-1.1 |
dlrm | recommendation | Criteo Terabyte |
3d-unet | vision/medical imaging | BraTS 2019 |
rnnt | speech recognition | OpenSLR LibriSpeech Corpus |
The above models serve in a variety of critical inference applications or use cases known as “scenarios”. Each scenario requires different metrics, demonstrating production environment performance in real practice. MLPerf Inference consists of four evaluation scenarios: single-stream, multi-stream, server, and offline. See Table 2 below:
Scenario | Sample Use Case | Metrics |
SingleStream | Cell phone augmented reality | Latency in milliseconds |
MultiStream | Multiple camera driving assistance | Number of streams |
Server | Translation site | QPS |
Offline | Photo sorting | Inputs/second |
Executing Inference Workloads on Dell EMC PowerEdge
The PowerEdge™ R7515 and R7525 coupled with NVIDIA GPus were chosen for inference performance benchmarking because they support the precisions and capabilities required for demanding nference workloads.
Dell EMC PowerEdge™ R7515
The Dell EMC PowerEdge R7515 is a 2U, AMD-powered server that supports a single 2nd generation AMD EPYC (ROME) processor with up to 64 cores in a single socket. With 8x memory channels, it also features 16x memory module slots for a potential of 2TB using 128GB memory modules in all 16 slots. Also supported are 3-Dimensional Stack DIMMs, or 3-DS DIMMs.
SATA, SAS and NVMe drives are supported on this chassis. There are some storage options to choose from depending on the workload. Chassis configurations include:
- 8 x 3.5-inch hot plug SATA/SAS drives (HDD)
- 12 x 3.5-inch hot plug SATA/SAS drives (HDD)
- 24 x 2.5-inch hot plug SATA/SAS/NVMe drives
The R7515 is a general-purpose platform capable of handling demanding workloads and applications, such as data warehouses, ecommerce, databases, and high-performance computing (HPC). Also, the server provides extraordinary storage capacity options, making it well-suited for data-intensive applications without sacrificing I/O performance. The R7515 benchmark configuration used in testing can be seen in Table 3.
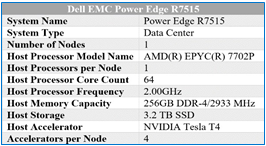
Table 3 – R7515 benchmarking configuration
Dell EMC PowerEdge™ R7525
The The Dell EMC PowerEdge R7525 is a 2-socket, 2U rack-based server that is designed to run complex workloads using highly scalable memory, I/O capacity, and network options. The system is based on the 2nd Gen AMD EPYC processor (up to 64 cores), has up to 32 DIMMs, PCI Express (PCIe) 4.0-enabled expansion slots, and supports up to three double wide 300W or six single wide 75W accelerators.
SATA, SAS and NVMe drives are supported on this chassis. There are some storage options to choose from depending on the workload. Storage configurations include:
- Front Bays
- Up to 24 x 2.5” NVMe
- Up to 16 x 2.5” SAS/SATA (SSD/HDD) and NVMe
- Up to 12 x 3.5” SAS/SATA (HDD)
- Up to 2 x 2.5” SAS/SATA/NVMe (HDD/SSD)
- Rear Bays
- Up to 2 x 2.5” SAS/SATA/NVMe (HDD/SSD)
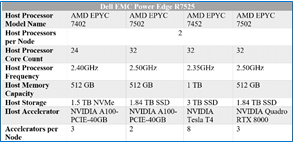
Table 4 – R7525 benchmarking configuration
The R7525 is a highly adaptable and powerful platform capable of handling a variety of demanding workloads while also providing flexibility. The R7525 benchmark configuration used in testing can be seen in Table 4.
NVIDIA Technologies Used for Efficient Inference
NVIDIA® Tesla T4
The NVIDIA Tesla T4, based on NVIDIA’s Turing™ architecture is one of the most widely used AI inference accelerators. The Tesla T4 features NVIDIA Turing Tensor cores which enables it to accelerate all types of neural networks for images, speech, translation, and recommender systems, to name a few. Tesla T4 is supported by a wide variety of precisions and accelerates all major DL & ML frameworks, including TensorFlow, PyTorch, MXNet, Chainer, and Caffe2.
For more details on NVIDIA Tesla T4, please refer to https://www.nvidia.com/en-us/data-center/tesla-t4/
NVIDIA® Quadro RTX8000
NVIDIA® Quadro® RTX™ 8000, powered by the NVIDIA Turing™ architecture and the NVIDIA RTX platform, combines unparalleled performance and memory capacity to deliver the world’s most powerful graphics card solution for professional workflows. With 48 GB of GDDR6 memory, the NVIDIA Quadro RTX 8000 is designed to work with memory intensive workloads that create complex models, build massive architectural datasets and visualize immense data science workloads.
For more details on NVIDIA® Quadro® RTX™ 8000, please refer to https://www.nvidia.com/en-us/design- visualization/quadro/rtx-8000/
NVIDIA® A100-PCIE
The NVIDIA A100 Tensor Core GPU is the flagship product of the NVIDIA data center platform for deep learning, HPC, and data analytics. The platform accelerates over 700 HPC applications and every major deep learning framework. It’s available everywhere, from desktops to servers to cloud services, delivering both dramatic performance gains and cost-saving opportunities.
For more details, please refer to https://www.nvidia.com/en-us/data-center/a100/
NVIDIA Inference Software Stack for GPUs
At its core, NVIDIA TensorRTTM is a C++ library designed to optimize deep learning inference performance on systems which contains NVIDIA GPUs, and supports models that are trained in most of the major deep learning frameworks including, but not limited to, TensorFlow, Caffe, PyTorch, MXNet. After the neural network is trained, TensorRT enables the network to be compressed, optimized and deployed as a runtime without the overhead of a framework. It supports FP32, FP16 and INT8 precisions. To optimize the model, TensorRT builds an inference engine out of the trained model by analyzing the layers of the model and eliminating layers whose output is not used, or combining operations to perform faster calculations. The result of all these optimizations is improved latency, throughput and efficiency. TensorRT is available on NVIDIA NGC.
MLPerf v0.7 Performance Results and Key Takeaways
Figures 1 and 2 below show the inference capabilities of the PowerEdge R7515 and PowerEdge R7525 configured with different NVIDIA GPUs. Each bar graph indicates the relative performance of inference operations completed meeting certain latency constraints. Therefore, the higher the bar graph is, the higher the inference capability of the platform. Details on the different scenarios used in MLPerf inference tests (server and offline) are available at the MLPerf website. Offline scenario represents use cases where inference is done as a batch job (using AI for photo sorting), while server scenario represents an interactive inference operation (translation app). The relative performance of the different servers are plotted below to show the inference capabilities and flexibility that can be achieved using these platforms:
Offline Performance
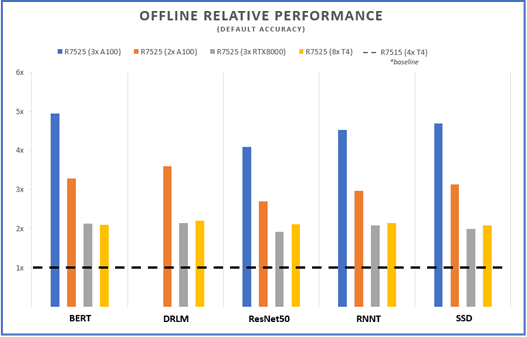
Figure 1 – Offline scenario relative performance for five different benchmarks and four different server configs, using the R7515 (4 xT4) as a baseline
Server Performance
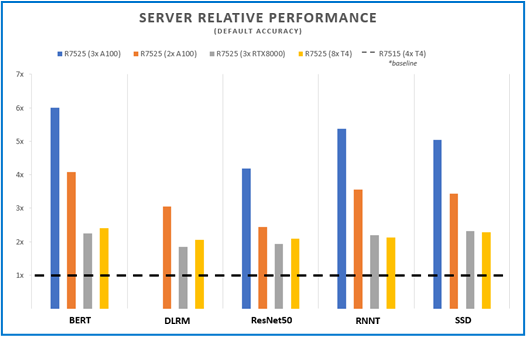
Figure 2 – Server scenario relative performance for five different benchmarks and four different server configs, using the R7515 (4 xT4) as a baseline
The R7515 and R7525 offers configuration flexibility to address inference performance and datacenter requirements around power and costs. Inference applications can be deployed on AMD single socket system without compromising accelerator support, storage and I/O capacities or on double socket systems with configurations that support higher capabilities. Both platforms support PCIe Gen4 links for latest GPU offerings like the A100 and also upcoming Radeon Instinct MI100 GPUs from AMD that are PCIe Gen 4 capable.
The Dell PowerEdge platforms offer a variety of PCIe riser options that enable support for multiple low- profile (up to 8 T4) or up to 3 full height double wide GPU accelerators (RTX or A100). Customers can choose the GPU model and number of GPUs based on the workload requirements and to fit their datacenter power and density needs. Figure 3 shows a relative compare of the GPUs used in the MLPerf study from a performance, power, price and memory point of view. The specs for the different GPUs supported on Dell platforms and server recommendations are covered in previous DfDs (link to the 2 papers)
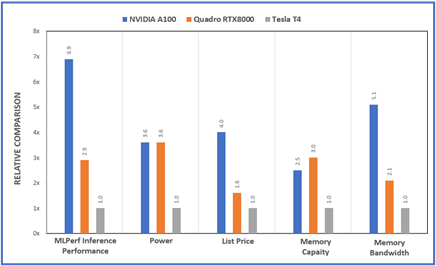
Figure 3 – Relative comparisons between the A100, RTX800 and T4 GPUs for various metrics
Conclusion
As demonstrated by MLPerf performance, Inference workloads executed on Dell EMC PowerEdge R7515 and Dell EMC PowerEdge R7525 performed well in a wide range of benchmark scenarios. . These results can server a guide to help identify the configuration that matches your inference requirements.