


PERC 12 Generational Performance Boosts
Wed, 08 Feb 2023 21:17:34 -0000
|Read Time: 0 minutes
Some additional insights into the recent Tolly report on PERC 12 vs. PERC 11 and PERC 10
No matter your organization’s focus, faster, more reliable RAID is always a good thing. Recently, Tolly published a full-length report comparing the performance of Dell’s PERC 12 with prior generation PERC 11 and PERC 10. You can read that report here: https://infohub.delltechnologies.com/section-assets/tolly223103delltechnologiespoweredgeraidcontroller12performance
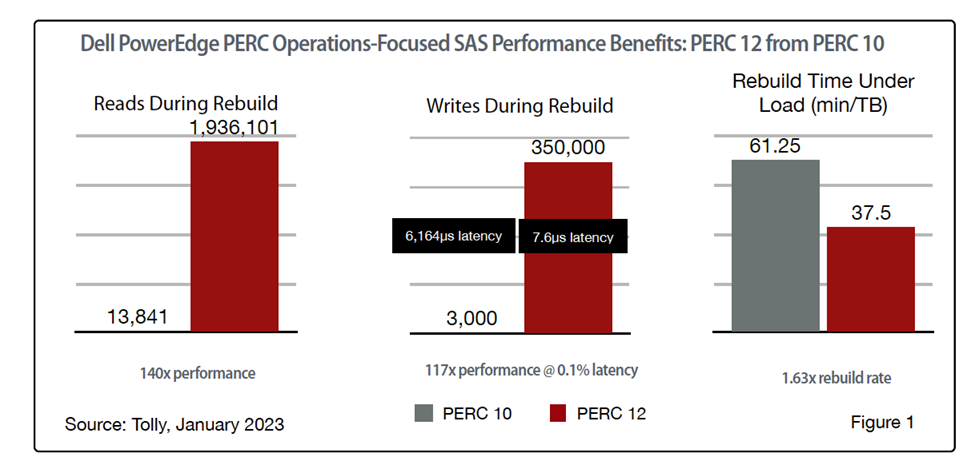
Even a quick glance at the full report will turn your head as there are some very impressive numbers. For example, PERC 12 delivers SAS read performance during rebuild that is 140x that of PERC 10; write performance during rebuilt that is 117x that of PERC 10 at 0.1% the latency; and volume rebuild time that is 1.63x the rate of PERC 10.
In total, we covered over 60 different tests that spanned PERC 10, 11, and 12 and both SAS and SSD storage environments. So much data, so little space! So, in this blog, we will focus on PERC 12 from PERC 11 and take a closer look at some of generational benefits of upgrading NVMe environments from existing PERC 11 to the new PERC 12 technology. (PERC 10 did not offer support for NVMe.)
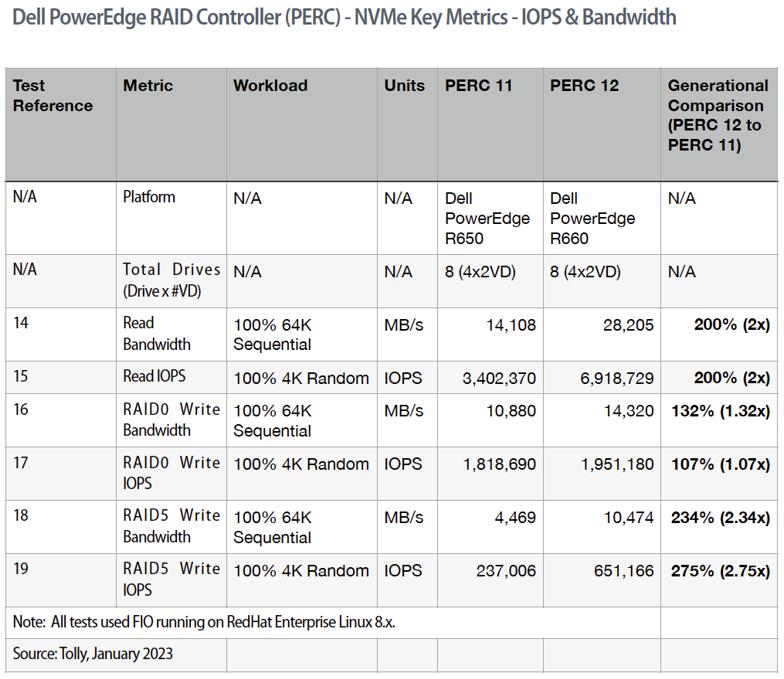
PERC 12 Speeds & Feeds: IOPS & Bandwidth
While most of us (hopefully) don’t spend our time going “0-60” in our cars, it has become a standard metric for car manufactures. Similarly, “IOPS and bandwidth” have become standard metrics for storage solutions. As with cars, it is not because the use case is a common one but because the extreme cases can go a long way in highlighting technological achievements – which end up helping one’s more mundane use cases. With that introduction, let’s look at the test results.
All these data points can be found in our Tolly report referenced above. For both reads and writes, we are interested in the maximum values for read/write operations and overall throughput.
To show maximum throughput, 64K sequential reads are used. To show maximum operations, 4K random reads are used. For simplicity with comparing results, 100% of the test uses the same pattern.
While out table contains all the raw results, it is the comparison column on the far right that draws our interest. In every case, PERC 12 outperforms PERC 11 with NVMe.
While RAID0 results are included, the fact that RAID0 does not provide protection against disk failure and, thus, is not relevant to most organizations.
Looking at RAID5, then, a quick glance shows that PERC 12 delivers twice (or more) the IOPS and bandwidth for both read and write operations when compared to PERC 11.
All these tests were run on “optimal” environments. That is, disk arrays with all of the disks operational. But that isn’t always the case in the realworld.
PERC 12 Rebuild Performance & “Tail” Latency
Across the board, what I find most impressive about PERC 12 is how it improves performance during rebuild. In the real world, disk failures happen. Always have, probably always will. What is important is what happens to your system in such situations.
Fortunately, RAID5 is all about data protection. Thus, when a RAID5 array has a disk failure, no data is lost. When a new, replacement disk is inserted, however, a “rebuild” has to take place. The RAID5 controller rebuilds the protected array by writing data to the “fresh” disk. Traditionally, this has translated into degraded performance for the array during the rebuild. PERC 12 changes all that.
Again, looking at data from our report, there are several things to note.
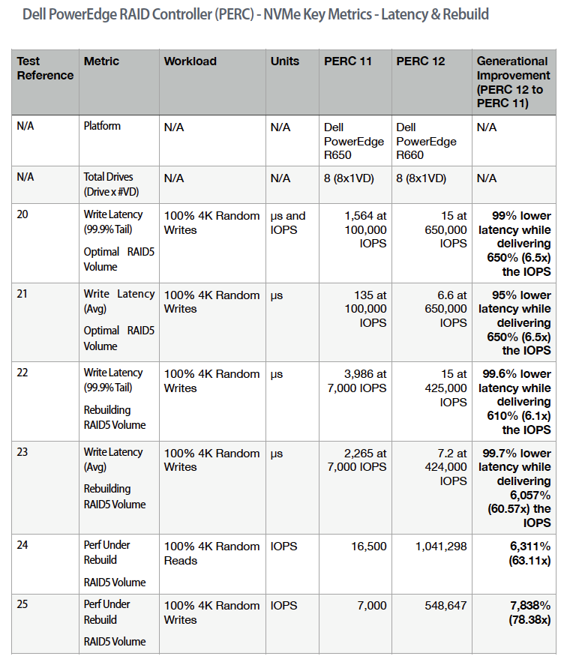
First, you will note that in addition to average latency, we are also reporting “tail” latency. This latency value reports the latency for 99.9% of the test results. Looked at another way, it is the latency for all but the “worst” 0.1% of the results.
Tail latency is a much more rigorous measurement because of the scope of results that it covers. The test data shown in this table cover both “optimal” environments as well as tests run with rebuilds in progress. In all cases, the latency is dramatically lower. PERC 12 reduces average/tail latency by 95% to 99.7% compared with PERC 11.
At the same time, PERC 12 boosts 600% of the IOPS delivered with PERC 11.

And, as mentioned earlier, performance under rebuild is dramatically improved. PERC 12 random read IOPS are more than 60x PERC 11. PERC 12 random writes are more than 78x PERC 11.
Outro
Whether you are on a five-year refresh cycle and are jumping from PERC 10 to PERC 12 or on a latest-to-latest cycle and moving from PERC 11 directly PERC 12, the numbers are impressive no matter what test scenario you look at.
For a boost in real-world performance – especially during RAID volume rebuild – PERC 12 has your back.