


Dell PowerEdge C6615 Performance
Download PDFThu, 04 Apr 2024 16:51:46 -0000
|Read Time: 0 minutes
Dell PowerEdge C6615 Performance
Authors:
David Dam – Principal Engineering Technologist
Kavya Ar – Sr. Systems Development Engineer
Summary
As power and cooling costs continue to occupy a substantial portion of IT budgets, IT departments are placing a strong emphasis on power efficiency to minimize the Total Cost of Ownership (TCO) when selecting server hardware. This paper assesses the power efficiency of the new Dell PowerEdge C6615 server, a model designed in the multi-node, 2U form factor. Due to its adept balance between density and expandability, this form factor is widely used across various edge and telecom use cases.
Test configuration
Server | Processor | CPU Cores | Default TDP | Memory | OS |
PowerEdge C6615 | AMD EPYC 8324P | 32 | 180W | 6 x 64 GB 4800 MT/s | Ubuntu 22.04.2 LTS |
AMD EPYC 8534P | 64 | 200W | 6 x 64 GB 4800 MT/s | Ubuntu 22.04.2 LTS | |
PowerEdge 1S Server | AMD EPYC 9334 | 32 | 240W | 12 x 64 GB 4800 MT/s | Ubuntu 22.04.1 LTS |
AMD EPYC 9534 | 64 | 280W | 12 x 64 GB 4800 MT/s | Ubuntu 22.04.1 LTS |
AMD STREAM
STREAM benchmark is used to calculate the memory bandwidth of a system. The Dell PowerEdge C6615, featuring the AMD EPYC 8534P 64-Core processor, shows a remarkable up to 142% enhancement in performance per watt per dollar. It also boasts an impressive up to 73% increase in performance per CPU dollar when compared to the Dell PowerEdge 1S server equipped with the AMD EPYC 9534P 64-Core processor[1] (Figure 1).
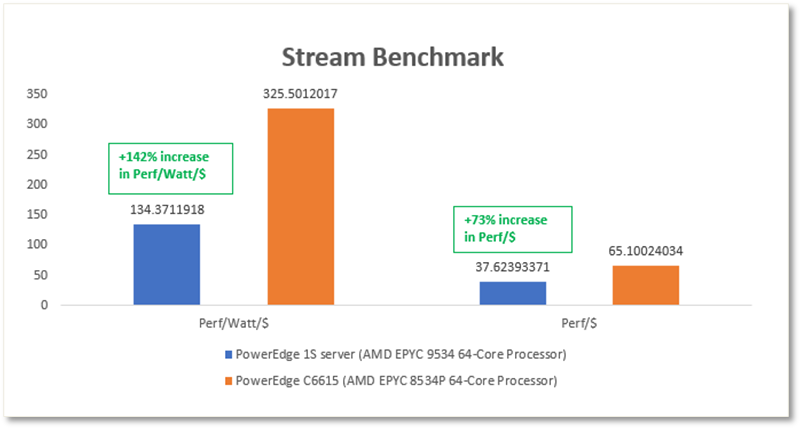
- STREAM results for selected AMD EPYC 64-Core processors
When compared to the Dell PowerEdge 1S server featuring the AMD EPYC 9334 32-Core processor, the test results showed up to a 114% improvement in performance per watt per dollar and up to 61% improvement in performance per CPU dollar[2] (Figure 2).
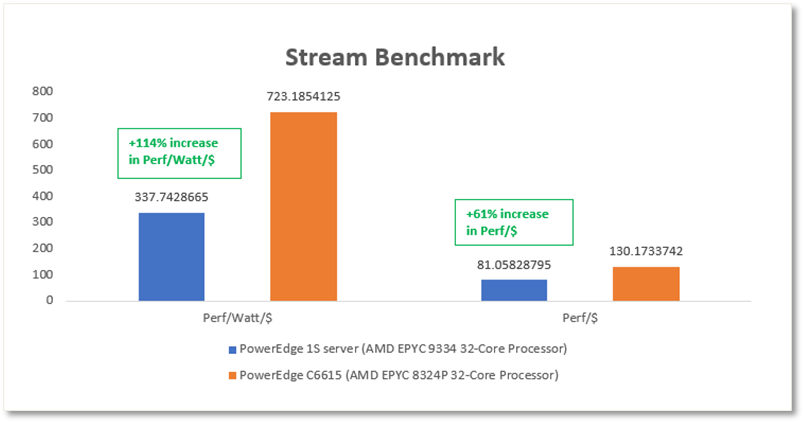
- STREAM results for selected AMD EPYC 32-Core processors
High-Performance Linpack (HPL)
High-Performance Linpack (HPL) is a benchmark used to measure the floating-point computing performance of a computer system. It is specifically designed to assess a system’s ability to solve a dense system of linear equations. HPL is widely used in the high-performance computing (HPC) industry and is considered a standard benchmark for evaluating supercomputers and clusters.
The results have shown outstanding cost-efficiency, revealing a remarkable up to 335% enhancement in performance per watt per dollar, and a substantial 210% increase in performance per CPU dollar when compared to PowerEdge 1S server equipped with the AMD EPYC 9534P 64-Core processor[3] (Figure 3).
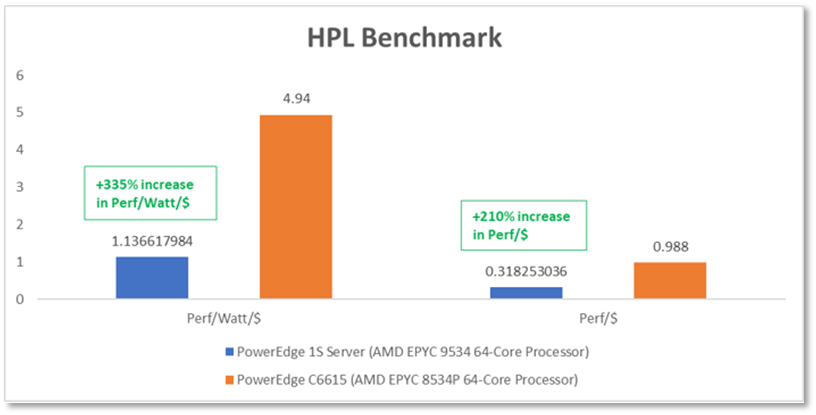
- HPL results for selected AMD EPYC 64-Core processors
When compared to a PowerEdge 1S server equipped with the AMD EPYC 9334 32-Core processor, the results highlight exceptional cost-efficiency. It also features an impressive up to 209% improvement in performance per watt per dollar and a substantial 132% increase in performance per CPU dollar[4] (Figure 4).
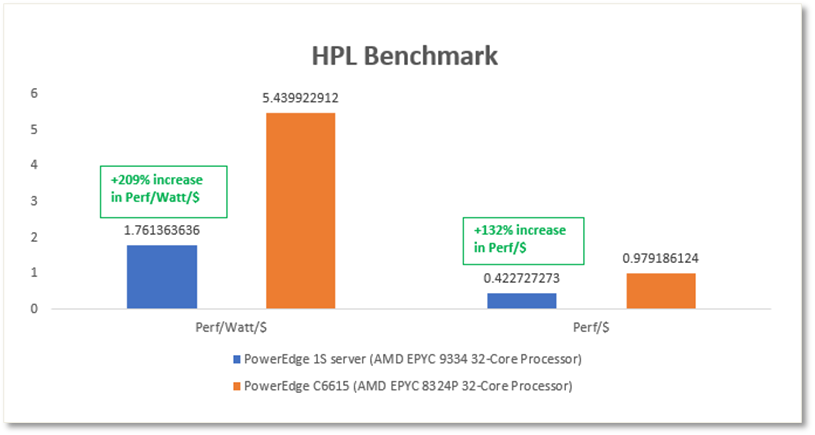
- HPL results for selected AMD EPYC 32-Core processors
SPEC CPU 2017
The SPEC CPU® 2017 benchmark from the Standard Performance Evaluation Corporation (SPEC®) provides a comparative measure of compute-intensive performance using workloads developed from real user applications. SPEC CPU 2017 is the industry-standardized CPU intensive suite of benchmarks for measuring and comparing compute intensive performance, stressing a system's processor, memory subsystem and compiler. This benchmark is used by hardware vendors, IT industry, computer manufacturers, and government.
The results demonstrate remarkable cost-efficiency, with an impressive up to 281% improvement in performance per watt per dollar, and a substantial 172% increase in performance per CPU dollar when compared to a PowerEdge 1S server equipped with the AMD EPYC 9534P 64-Core processor[5] (Figure 5).
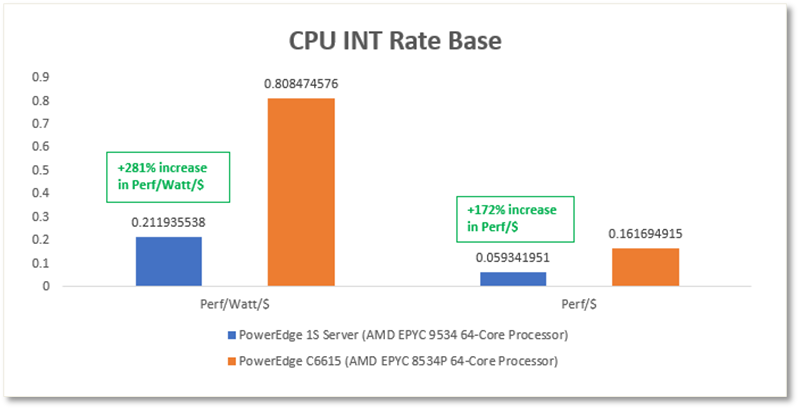
- SPECINTRate results for selected AMD EPYC 64-Core processors
When compared to the Dell PowerEdge 1S server which is equipped with the AMD EPYC 9334 32-Core processor, the test results indicate a significant improvement in cost-efficiency with a remarkable up to 205% increase in performance per watt per dollar, and an impressive up to 128% boost in performance per CPU dollar[6] (Figure 6).
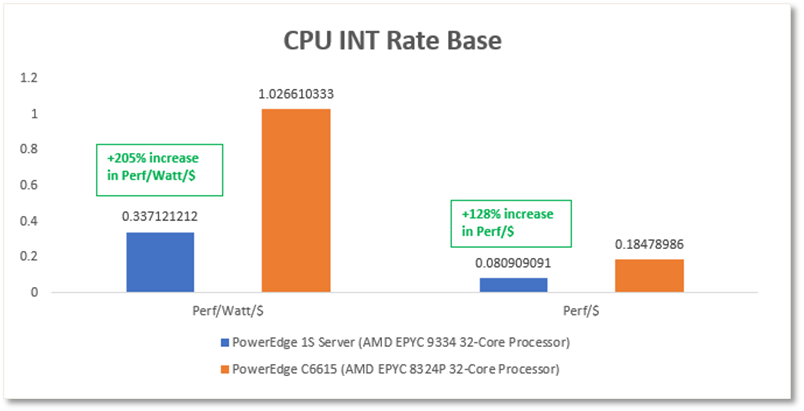
- SPECINTRate results for selected AMD EPYC 32-Core processors
Conclusion
Through various benchmarks and workloads, it is evident that the dense compute-optimized design of Dell PowerEdge C6615, featuring lower cost, lower power AMD EPYC 8004 Series Server Processor, outperforms a similar 1S server equipped with the AMD EPYC 9004 Series Server Processor resulting in higher performance per watt per dollar and enhanced performance per dollar.
References
[1] Based on Dell internal calculations using AMD Stream benchmark achieved on a Dell PowerEdge C6615 and a TDP of 200W with AMD EPYC 8534P 64-Core processors compared to a Dell PowerEdge 1S server and a TDP 280W with AMD EPYC 9534P 64-Core processors. Actual performance will vary.
[2] Based on Dell internal calculations using AMD Stream benchmark achieved on a Dell PowerEdge C6615 and a TDP of 180W with AMD EPYC 8324P 32-Core processors compared to a Dell PowerEdge 1S server and a TDP 240W with AMD EPYC 9334 32-Core processors. Actual performance will vary.
[3] Based on Dell internal calculations using HPL benchmark achieved on a Dell PowerEdge C6615 and a TDP of 200W with AMD EPYC 8534P 64-Core processors compared to a Dell PowerEdge 1S server and a TDP 280W with AMD EPYC 9534P 64-Core processors. Actual performance will vary.
[4] Based on Dell internal calculations using HPL benchmark achieved on a Dell PowerEdge C6615 and a TDP of 180W with AMD EPYC 8324P 32-Core processors compared to a Dell PowerEdge 1S server and a TDP 240W with AMD EPYC 9334 32-Core processors. Actual performance will vary.
[5] Based on Dell analysis of submitted SPEC_CPU2017 score of 477 achieved on a Dell PowerEdge C6615 and a TDP of 200W with AMD EPYC 8534P 64-Core processors compared to a score of 606 on Dell PowerEdge 1S server and a TDP 280W with AMD EPYC 9534P 64-Core processors. Actual performance will vary.
[6] Based on Dell analysis of submitted SPEC_CPU2017 score of 277 achieved on a Dell PowerEdge C6615 and a TDP of 180W with AMD EPYC 8324P 32-Core processors compared to a score of 356 on Dell PowerEdge 1S server and a TDP 240W with AMD EPYC 9334 32-Core processors. Actual performance will vary.