


Research and learn seamlessly from anywhere
Tue, 22 Feb 2022 15:28:11 -0000
|Read Time: 0 minutes
Traditionally, designers and engineers requiring 2D/3D visualization and analysis used high-end physical workstations. Deploying, upgrading, and maintaining these workstations is difficult and time-consuming for IT. Using VDI with virtual workstations instead provides an opportunity to overcome many of the challenges of IT management and maintenance as well as offering better collaboration, security, and flexibility.
However, a further complication to delivering a high-quality and consistent user experience in the modern higher education sector is the need to support remote learners with the same standards as are available for on-campus students, even when they are subject to a wide variety of distance and performance impacts in their LAN and WAN environments.
Recently, the Dell Technologies Validated Designs team conducted testing and best practices to optimize the remote user experience on professional graphics-accelerated applications for higher education, specifically focusing on geographic information systems (GIS) and engineering computer-aided design (CAD) applications. This paper provides details of performance test results for both baseline local area network (LAN) and remote wide area network (WAN) user experiences with virtual desktop implementations of Esri's ArcGIS Pro on Dell Technologies VDI with NVIDIA virtual GPUs, using NVIDIA’s nVector performance monitoring tool.
Why did we do this?
Measuring user experience at the VDI desktops or workstation level CAN BE informative – if the end-users' endpoints are in proximity to the hosting data center (for example, the same LAN or campus in the same building or site). But what if the user is remote or doesn’t have a strong WAN? Then measuring EUE at the desktop or workstation level is much less representative. In this case, the ability to measure end-user experience at the actual endpoint device gives a better indication of the remote user experience than relying on data captured at the VDI desktop or workstation.
Testing
We ran the NVIDIA nVector Lite tool to assess the end-user experience. The tool measured the following remote user experience attributes:
● End-user latency: This metric defines the level of response of a remote desktop or application. It measures the duration of any lag that an end-user experiences when interacting with a remote desktop or application. The metric is based on the graphics driver on the user’s endpoint device and is measured along the whole graphics pipeline from the VDI desktop to the remote screen.
● Frame rate: This metric is a common measure of user experience and defines how smooth the experience is. It measures the rate at which frames per second (fps) are delivered on the screen of the endpoint device.
● Image quality: This metric defines the impact of remoting on image quality. It uses the Structural Similarity Index (SSIM) to compare an image that is rendered on the target desktop/workstation VM with the image that is displayed on the endpoint device. The average SSIM index of all pairs of images is computed for a single point in time for the remote VDI session. The index score is calculated once during the workload so a single value score is given for each workload.
We got the following test results:
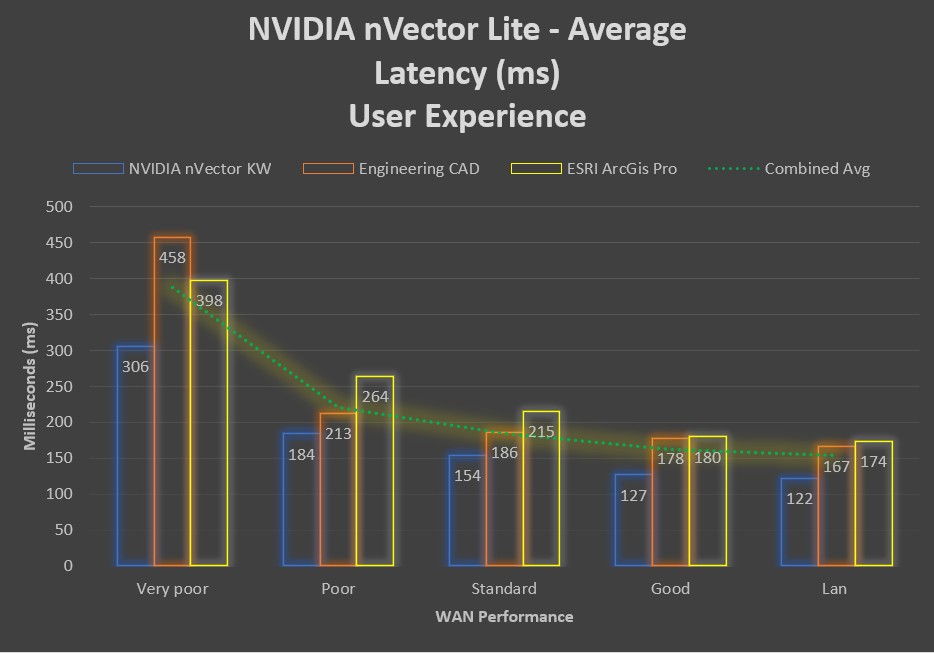
End-user latency
The end-user latency metric defines how responsive a remote desktop or application is. The following figure confirms the common assumption that the better the network connection, the lower the end-user latency. The chart shows that average end-user latency more than doubles for a remote user with a “Very Poor” network connection when compared to an office user with a local LAN connection.
The following figure shows the end-user latency variability between the graphics-accelerated workloads.
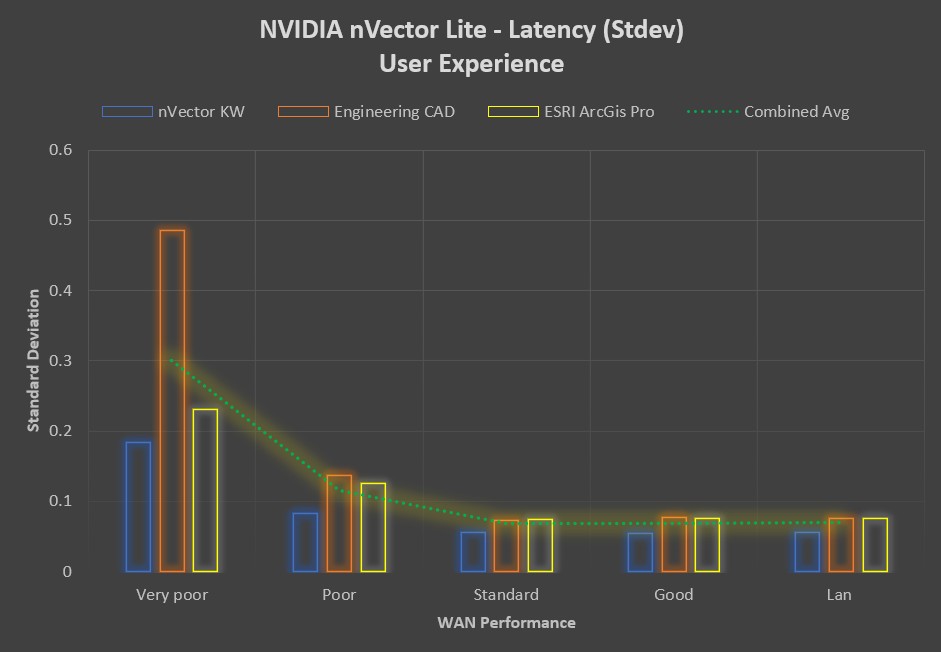
Remote users with a “Standard” to “Good” network connection can expect to see the same consistent user experience, with end-user latency distribution well below 500 ms. Latency consistency decreases as the network performance decreases, with outlying values in excess of 2 seconds for specific applications.
Frame rate
The frame rate metric defines how smooth the end-user experience is. It is a measurement of “smoothness” at an endpoint device when a user is interacting with a remote VDI desktop or application. The nVector tool samples frame rates at 5-second intervals for the duration of the workload.
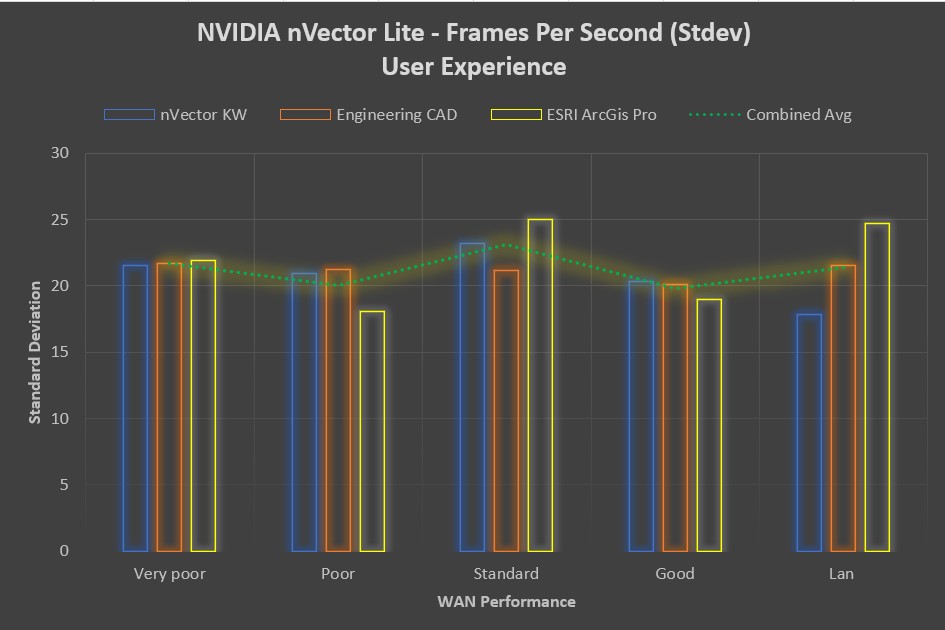
The higher the number of endpoint frames per second, the smoother the end-user experience. The average fps number show a marginal increase with network performance, with minimal variability shown between the application workloads.
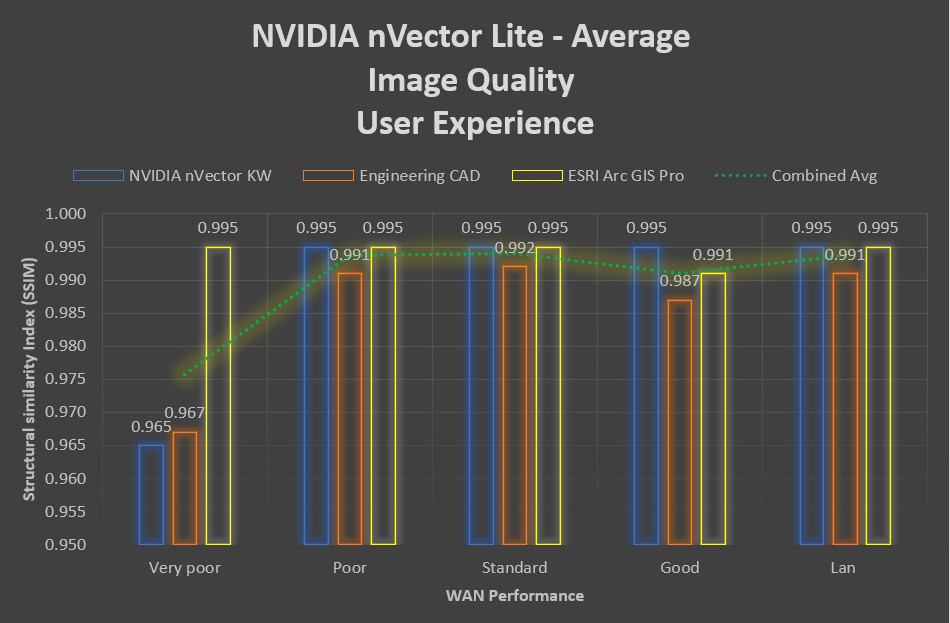
Image Quality
While image quality remained highly consistent across all network categories for some workloads, it showed a noticeable drop in the “Very Poor” network category for others. Remote image quality appears to be related to a combination of the workload and the network performance. The following figure shows the average image quality:
Summary & Conclusions
With the changing dynamics of modern-day education, for example, the diverse user situations such as working from campus compared to working from home, it has become challenging for IT teams to provide a consistent user experience. While the general intuition that "The better the network performance, the better the end-user experience" holds true, our test results do show that a typical remote ArcGIS Pro and Engineering CAD user with a "Standard" to "Good" broadband connection can expect the same end-user experience as an on-campus or office LAN user, as measured by NVIDIA's nVector performance monitoring tool.
To learn more, Read the technical white paper and check out the Touro College of Dental Medicine customer case study.