


Interpreting TPCx-AI Benchmark Results

TPCx-AI Benchmark
Overview
TPCx-AI Benchmark abstracts the diversity of operations in a retail data center scenario. Selecting a retail business model assists the reader relate intuitively to the components of the benchmark, without tracking that industry segment tightly. Such tracking would minimize the relevance of the benchmark. The TPCx-AI benchmark can be used to characterize any industry that must transform operational and external data into business intelligence.
This paper introduces the TPCx-AI benchmark and uses a published TPCx-AI result to describe how the primary metrics are determined and how they should be read.
Benchmark model
TPCx-AI data science pipeline
The TPCx-AI benchmark imitates the activity of retail businesses and data centers with:
- Customer information
- Department stores
- Sales
- Financial data
- Product catalog and reviews
- Emails
- Data center logs
- Facial images
- Audio conversations
It models the challenges of end-to-end artificial intelligence systems and pipelines where the power of machine learning and deep learning is used to:
- Detect anomalies (fraud and failures)
- Drive AI-based logistics optimizations to reduce costs through real-time forecasts (classification, clustering, forecasting, and prediction)
- Use deep learning AI techniques for customer service management and personalized marketing (facial recognition and speech recognition)
It consists of ten different use cases that help any retail business data center address and manage any business analysis environment.
The TPCx-AI kit uses a Parallel Data Generator Framework (PDGF) to generate the test dataset. To mimic the datasets of different company sizes the user can specify scale factor (SF), a configuration parameter. It sets the target input dataset size in GB. For example, SF=100 equals 100 GB. Once generated, all the data is processed for subsequent stages of postprocessing within the data science pipeline.
Use cases
The TPCx-AI Benchmark models the following use cases:
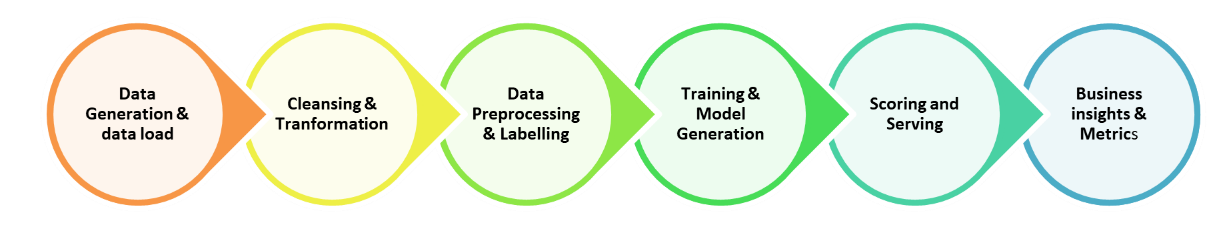
Figure 1: TPCx-AI benchmark use case pipeline flow
Table 1: TPCx-AI benchmark use cases
ID | Use case | M/DL | Area | Algorithm |
UC01 | Customer Segmentation | ML | Analytics | K-Means |
UC02 | Conversation Transcription | DL | NLP | Recurrent Neural Network |
UC03 | Sales Forecasting | ML | Analytics | ARIMA |
UC04 | Spam Detection | ML | Analytics | Naïve Bayes |
UC05 | Price Prediction | DL | NLP | RNN |
UC06 | Hardware Failure Detection | ML | Analytics | Support Vector Machines |
UC07 | Product Rating | ML | Recommendation | Alternating Least Squares |
UC08 | Trip Type Classification | ML | Analytics | XGBoost |
UC09 | Facial Recognition | DL | Analytics | Logistic Regression |
UC10 | Fraud Detection | ML | Analytics | Logistic Regression |
Benchmark run
The TPCx-AI Benchmark run consists of seven separate tests run sequentially. The tests are listed below:
- Data Generation using PDGF
- Load Test – Loads data into persistent storage (HDFS or other file systems)
- Power Training Test – Generates and trains models
- Power Serving Test I – Uses the trained model in Training Phase to conduct the serving phase (Inference) for each use case
- Power Serving Test II – There are two serving tests that run sequentially. The test with the greater geometric mean (geomean) of serving times is used in the overall score.
- Scoring Test – Model validation stage. Accuracy of the model is determined using defined accuracy metrics and criteria
- Throughput Test – Runs two or more concurrent serving streams
The elapsed time for each test is reported.
Note: There are seven benchmark phases that span an end-to-end data science pipeline as shown in Figure 1. For a compliant performance run, the data generation phase is run but not scored and consists of the subsequent six separate tests, load test through throughput test, run sequentially.
Primary metrics
For every result, the TPC requires the publication of three primary metrics:
- Performance
- Price-Performance
- Availability Date
Performance metric
It is possible that not all scenarios in TPCx-AI will be applicable to all users. To account for this situation, while defining the performance metric for TPCx-AI, no single scenario dominates the performance metric. The primary performance metric is the throughput expressed in terms of AI use cases per minute (AIUCpm) @ SF is defined in the figure below.
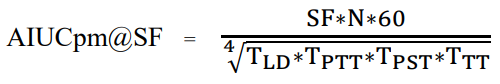
Figure 2: Definition of the TPCx-AI benchmark metric
Where:
TLD = Load time
TPTT = Geomean of training times
TPST1 = Geomean of Serving times
TPST2 = Geomean of serving times
TPST = Max (TPST1, TPST2)
TTT = Total elapsed time/ (#streams * number of use cases)
N = Number of use cases
Note: The elapsed time for the scoring test is not considered for the calculation of the performance metric. Instead, the results of the scoring test are used to determine whether the Performance test was successful.
The scoring test result for each user case should meet or better the reference result set provided in the kit as shown in the figure below.
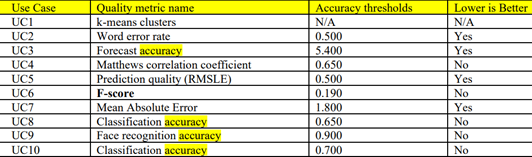
Figure 3: Benchmark run accuracy metrics
Calculating the Performance metric
To illustrate how the performance metric is calculated, let us consider the results published for SF=10 at:
https://www.tpc.org/tpcx-ai/results/tpcxai_result_detail5.asp?id=122110802
A portion of the TPCx-AI result highlights, showing the elapsed time for the six sequential tests constituting the benchmark run is shown in the figure below.
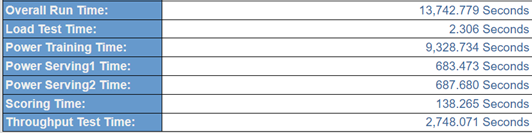
Figure 4: Elapsed time for the benchmark test phases
The result highlights only provide the training times and the serving times. To calculate the final performance metric, we need to use the geometric mean of the training times and serving times. To arrive at the geomean of the training times and the testing times, the time taken for each use case is needed. That time is provided in the Full Disclosure Report (FDR) that is part of the benchmark results. The link to the FDR of the SF=10 results that we are considering are at:
https://www.tpc.org/results/fdr/tpcxai/dell~tpcxai~10~dell_poweredge_r7615~fdr~2022-11-09~v01.pdf
The use case times and accuracy table from the FDR are shown in the figure below.
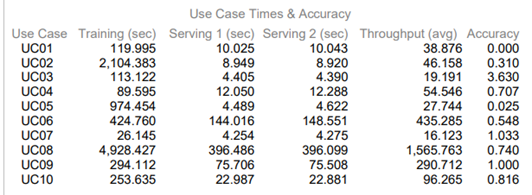
Figure 5: Use case times and accuracy
Note: The accuracy metrics are defined in Table 7a of the TPCx-AI User Guide.
Using the data in Figure 4 and Figure 5:
TLD = Load time =2.306 seconds
TPTT = Geomean of training time =316.799337
(119.995*2104.383*113.122*89.595*974.454*424.76*26.14*4928.427*29.112*253.63)1/10
TPST1 = Geomean of Serving times =19.751 seconds
(10.025*8.949*4.405*12.05*4.489*144.016*4.254*396.486*75.706*22.987)1/10
TPST2 = Geomean of serving times = 19.893 seconds
(10.043*8.92*4.39*12.288*4.622*148.551*4.275*396.099*75.508*22.881)1/0
TPST = Max (TPST1, TPST2)= 19.893 seconds
TTT = Total elapsed time/ (#streams * # of use cases) =2748.071/ (100*10)= 2.748 seconds
N = Number of use cases =10
Note: The geometric mean is arrived at by multiplying the time taken for each of the use cases and finding the 10th root of the product.
Plugging the values in the formula for calculating the AIUCpm@SF given in Figure 2, we get:
AIUCpm@SF= 10*10*60/ (2.306*316.799*19.893*2.748)1/4
= 6000/ (39935.591)1/4
= 6000/14.1365=424.433
The actual AIUCpm@SF10=425.31
Calculating the Price-Performance metric
The Price-Performance metric is defined in the figure below.
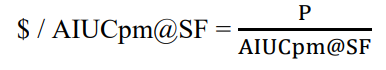
Figure 6: Price-Performance metric definition
Where:
- P = is the price of the hardware and software components in the System Under Test (SUT)
- AIUCpm@SF is the reported primary performance metric
Note: A one-year pricing model must be used to calculate the price and the price-performance result of the TPCx-AI Benchmark.
AIUCpm@SF10 = 425.31
Price of the configuration =$ 48412
$/AIUCpm@SF10 = 113.83 USD per AIUCpm@SF10
Availability date
All components used in this result will be orderable and available for shipping by February 22, 2023.
Performance results
Dell has published six world record-setting results based on the TPCx-AI Benchmark standard of the TPC. Links to the publications are provided below.
SF1000
Dell PowerEdge R650/Intel Xeon Gold (Ice Lake) 6348/CDP 7.1.7—11 nodes
https://www.tpc.org/tpcx-ai/results/tpcxai_result_detail5.asp?id=122120101
SF300
Dell PowerEdge R6625/AMD EPYC Genoa 9354/CDP 7.1.7—four nodes
https://www.tpc.org/tpcx-ai/results/tpcxai_result_detail5.asp?id=122110805
SF100
Dell PowerEdge R6625/AMD EPYC Genoa 9354/CDP 7.1.7—four nodes
https://www.tpc.org/tpcx-ai/results/tpcxai_result_detail5.asp?id=122110804
SF30
Dell PowerEdge R6625/AMD EPYC Genoa 9174F/Anaconda3—one node
https://www.tpc.org/tpcx-ai/results/tpcxai_result_detail5.asp?id=122110803
SF10
Dell PowerEdge R7615/AMD EPYC Genoa 9374F/Anaconda3—one node
https://www.tpc.org/tpcx-ai/results/tpcxai_result_detail5.asp?id=122110802
SF3
Dell PowerEdge R7615/AMD EPYC Genoa 9374F/Anaconda3—one node
https://www.tpc.org/tpcx-ai/results/tpcxai_result_detail5.asp?id=122110801
With these results, Dell Technologies holds the following world records on the TPCx-AI Benchmark Standard:
- #1 Performance and Price-Performance on SF1000
- #1 Performance and Price-Performance on SF300
- #1 Performance and Price-Performance on SF100
- #1 Performance and Price-Performance on SF30
- #1 Performance on SF10
- #1 Performance Price-Performance on SF3
Conclusion
Summary
This blog describes the TPCx-AI benchmark and how the performance result of the TPCx-AI Benchmark can be interpreted. It also describes how Dell Technologies maintains leadership in the TPCx-AI landscape.