

Assets

MLPerf™ Inference 4.0 on Dell PowerEdge Server with Intel® 5th Generation Xeon® CPU


Mon, 22 Apr 2024 05:40:38 -0000
|Read Time: 0 minutes
Introduction
In this blog, we present the MLPerf™ v4.0 Data Center Inference results obtained on a Dell PowerEdge R760 with the latest 5th Generation Intel® Xeon® Scalable Processors (a CPU only system).
These new Intel® Xeon® processors use an Intel® AMX matrix multiplication engine in each core to boost overall inferencing performance. With a focus on ease of use, Dell Technologies delivers exceptional CPU performance results out of the box with an optimized BIOS profile that fully unleashes the power of Intel’s OneDNN software – a software which is fully integrated with both PyTorch and TensorFlow frameworks. The server configurations and the CPU specifications in the benchmark experiments are shown in Tables 1 and 2, respectively.
Table 1. Dell PowerEdge R760 Server Configuration
System Name | PowerEdge R760 |
Status | Available |
System Type | Data Center |
Number of Nodes | 1 |
Host Processor Model | 5th Generation Intel® Xeon® Scalable Processors |
Host Processors per Node | 2 |
Host Processor Core Count | 64 |
Host Processor Frequency | 1.9 GHz, 3.9 GHz Turbo Boost |
Host Memory Capacity | 2 TB, 16 x 128 GB 5600 MT/s |
Host Storage Capacity | 7.68TB, NVME |
Table 2. 5th Generation Intel® Xeon® Scalable Processor Technical Specifications
Product Collection | 5th Generation Intel® Xeon® Scalable Processors |
Processor Name | Platinum 8592+ |
Status | Launched |
# of CPU Cores | 64 |
# of Threads | 128 |
Base Frequency | 1.9 GHz |
Max Turbo Speed | 3.9 GHz |
Cache L3 | 320 MB |
Memory Type | DDR5 5600 MT/s |
ECC Memory Supported | Yes |
MLPerf™ Inference v4.0 - Datacenter
The MLPerf™ inference benchmark measures how fast a system can perform ML inference using a trained model with new data in a variety of deployment scenarios. There are two benchmark suites, one for Datacenter systems and one for Edge. Figure 1 shows the 7 models with each targeting at different task in the official release v4.0 for Datacenter systems category that were run on this PowerEdge R760 and submitted in the closed category. The dataset and quality target are defined for each model for benchmarking, as listed in Table 3.
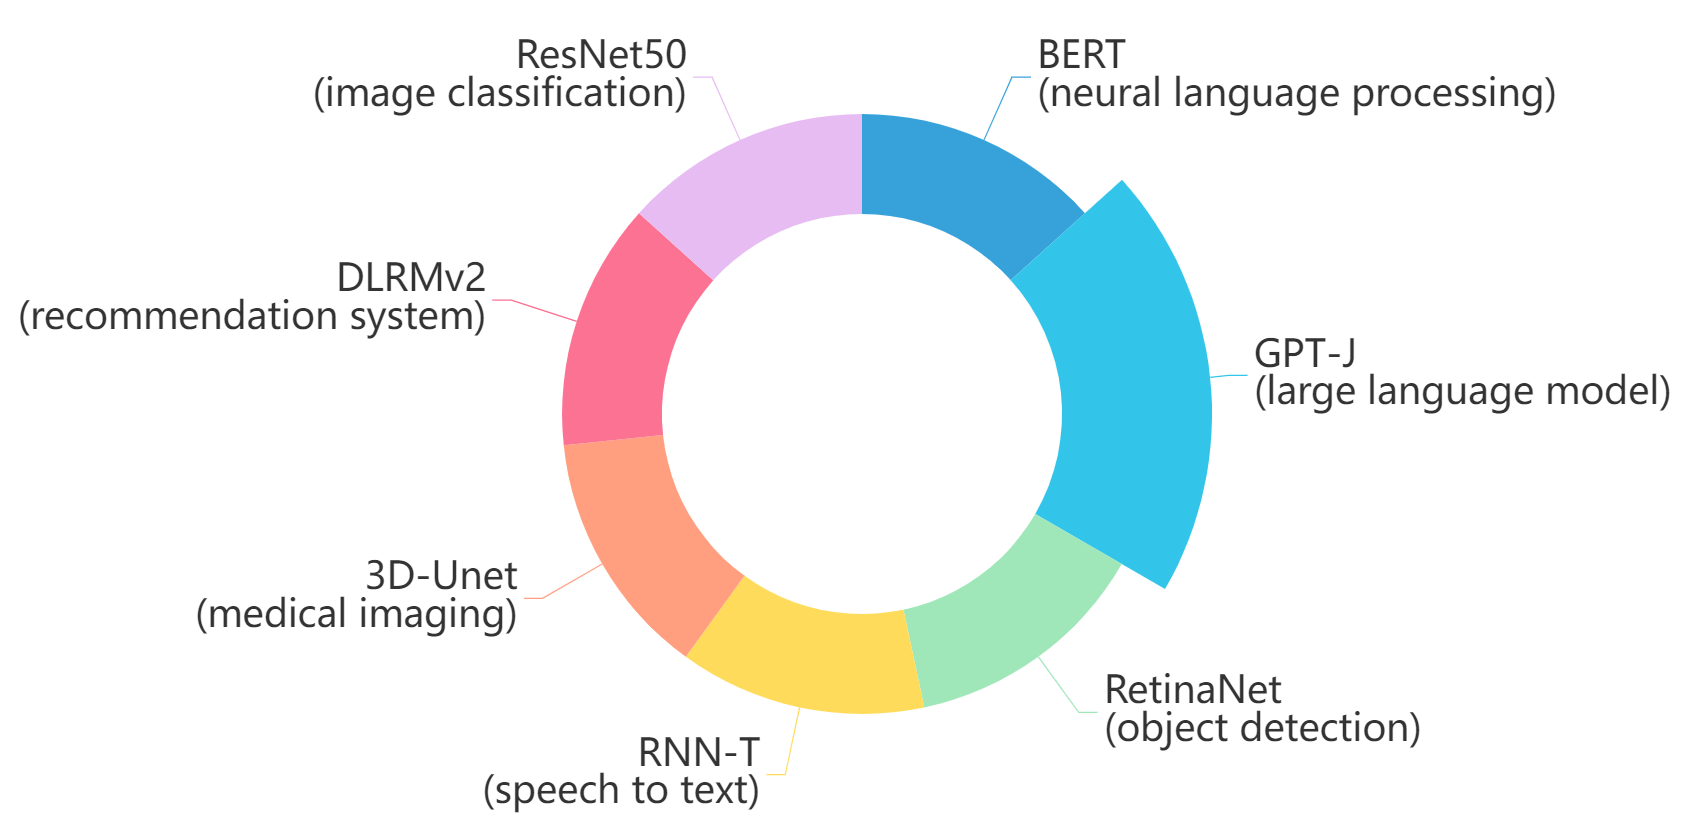
Figure 1. Benchmarked models for MLPerf™ datacenter inference v4.0
Table 3. Datacenter Suite Benchmarks. Source: MLCommons™
Area | Task | Model | Dataset | QSL Size | Quality | Server latency constraint |
Vision | Image classification | ResNet50-v1.5 | ImageNet (224x224) | 1024 | 99% of FP32 (76.46%) | 15 ms |
Vision | Object detection | RetinaNet | OpenImages (800x800) | 64 | 99% of FP32 (0.20 mAP) | 100 ms |
Vision | Medical imaging | 3D-Unet | KITS 2019 (602x512x512) | 16 | 99.9% of FP32 (0.86330 mean DICE score) | N/A |
Speech | Speech-to-text | RNN-T | Librispeech dev-clean (samples < 15 seconds) | 2513 | 99% of FP32 (1 - WER, where WER=7.452253714852645%) | 1000 ms |
Language | Language processing | BERT-large | SQuAD v1.1 (max_seq_len=384) | 10833 | 99% of FP32 and 99.9% of FP32 (f1_score=90.874%) | 130 ms |
Language | Summarization | GPT-J | CNN Dailymail (v3.0.0, max_seq_len=2048) | 13368 | 99% of FP32 (f1_score=80.25% rouge1=42.9865, rouge2=20.1235, rougeL=29.9881). | 20 s |
Commerce | Recommendation | DLRMv2 | Criteo 4TB multi-hot | 204800 | 99% of FP32 (AUC=80.25%) | 60 ms |
Scenarios
The models are deployed in a variety of critical inference applications or use cases known as “scenarios” where each scenario requires different metrics, demonstrating production environment performance in practice. Following is the description of each scenario. Table 4 shows the scenarios required for each Datacenter benchmark included in this submission v4.0.
Offline scenario: represents applications that process the input in batches of data available immediately and do not have latency constraints for the metric performance measured in samples per second.
Server scenario: represents deployment of online applications with random input queries. The metric performance is measured in queries per second (QPS) subject to latency bound. The server scenario is more complicated in terms of latency constraints and input queries generation. This complexity is reflected in the throughput-degradation results compared to the offline scenario.
Each Datacenter benchmark requires the following scenarios:
Table 4. Datacenter Suite Benchmark Scenarios. Source: MLCommons™
Area | Task | Required Scenarios |
Vision | Image classification | Server, Offline |
Vision | Object detection | Server, Offline |
Vision | Medical imaging | Offline |
Speech | Speech-to-text | Server, Offline |
Language | Language processing | Server, Offline |
Language | Summarization | Server, Offline |
Commerce | Recommendation | Server, Offline |
Software stack and system configuration
The software stack and system configuration used for this submission is summarized in Table 5.
Table 5. System Configuration
OS | CentOS Stream 8 (GNU/Linux x86_64) |
Kernel | 6.7.4-1.el8.elrepo.x86_64 |
Intel® Optimized Inference SW for MLPerf™ | MLPerf™ Intel® OneDNN integrated with Intel® Extension for PyTorch (IPEX) |
ECC memory mode | ON |
Host memory configuration | 2TB, 16 x 128 GB, 1 DIMM per channel, well balanced |
Turbo mode | ON |
CPU frequency governor | Performance |
What is Intel® AMX (Advanced Matrix Extensions)?
Intel® AMX is a built-in accelerator that enables 5th Gen Intel® Xeon® Scalable processors to optimize deep learning (DL) training and inferencing workloads. With the high-speed matrix multiplications enabled by Intel® AMX, 5th Gen Intel® Xeon® Scalable processors can quickly pivot between optimizing general computing and AI workloads.
Imagine an automobile that could excel at city driving and then quickly shift to deliver Formula 1 racing performance. 5th Gen Intel® Xeon® Scalable processors deliver this level of flexibility. Developers can code AI functionality to take advantage of the Intel® AMX instruction set as well as code non-AI functionality to use the processor instruction set architecture (ISA). Intel® has integrated the oneAPI Deep Neural Network Library (oneDNN) – its oneAPI DL engine – into popular open-source tools for AI applications, including TensorFlow, PyTorch, PaddlePaddle, and ONNX.
AMX architecture
Intel® AMX architecture consists of two components, as shown in Figure 1:
- Tiles consist of eight two-dimensional registers, each 1 kilobyte in size. They store large chunks of data.
- Tile Matrix Multiplication (TMUL) is an accelerator engine attached to the tiles that performs matrix-multiply computations for AI.
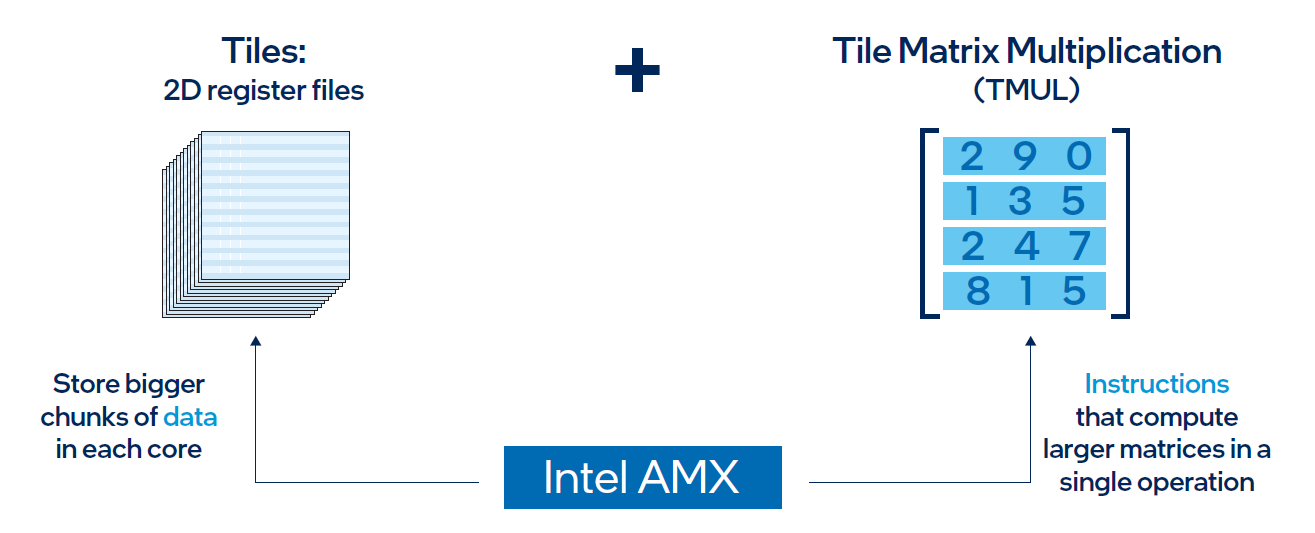
Figure 2. Intel® AMX architecture consists of 2D register files (tiles) and TMUL
Results
Both MLPerf™ v3.1 and MLPerf™ v4.0 benchmark results are based on the Dell R760 server but with different generations of Xeon® CPUs (4th Generation Intel® Xeon® CPUs for MLPerf™ v3.1 versus 5th Generation Intel® Xeon® CPUs for MLPerf™ v4.0) and optimized software stacks. In this section, we show the performance in the comparing mode so the improvement from the last submission can be easily observed.
Comparing Performance from MLPerfTM v4.0 to MLPerfTM v3.1
ResNet50 server & offline scenarios:
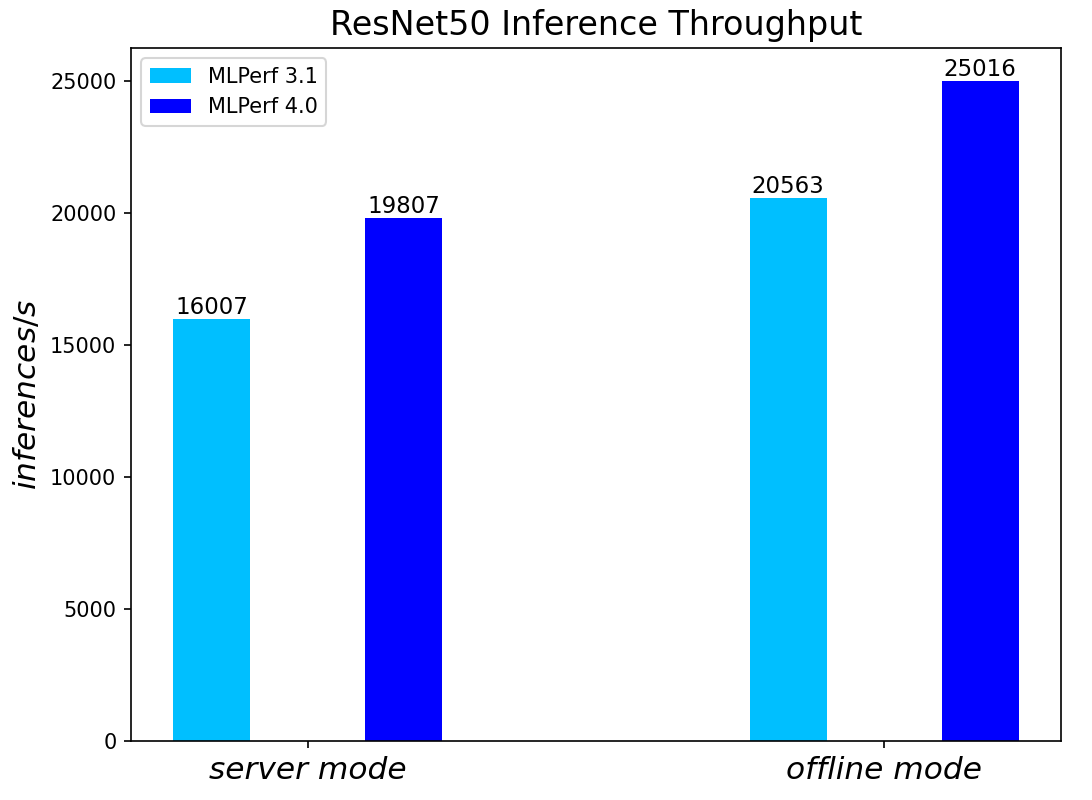
Figure 3. ResNet50 inference throughput in server and offline scenarios
BERT Large Language Model server & offline scenarios:
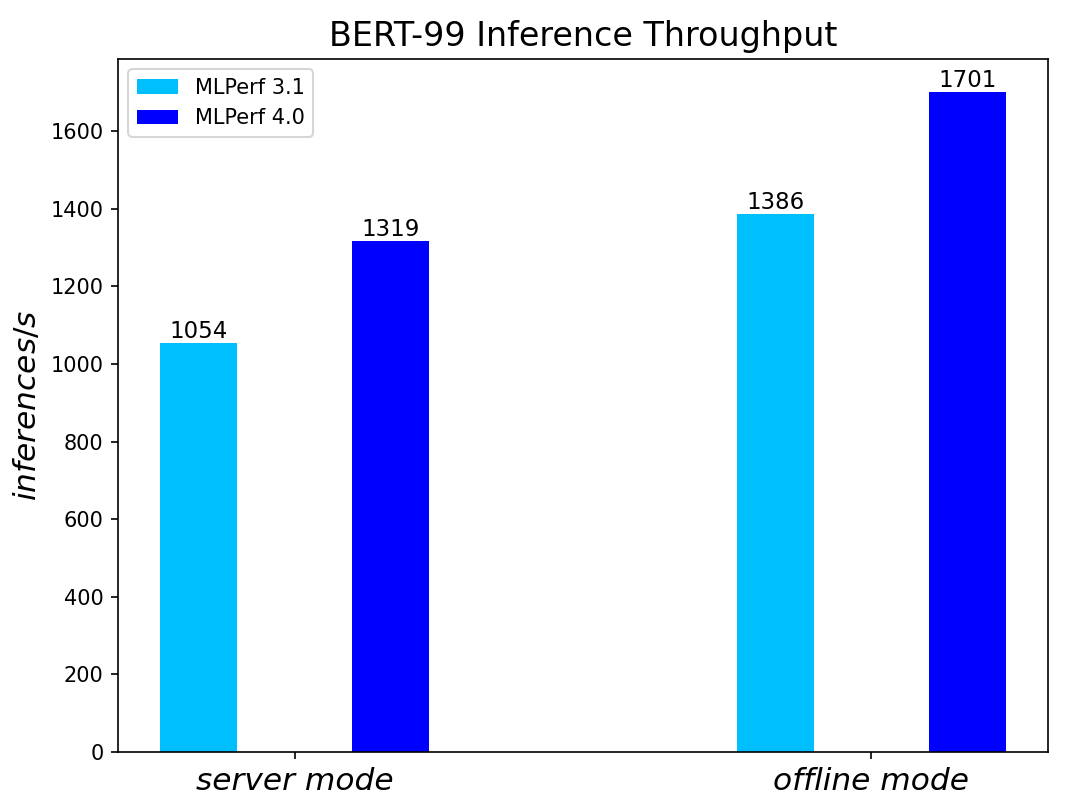
Figure 4. BERT Inference results for server and offline scenarios
RetinaNet Object Detection Model server & offline scenarios:
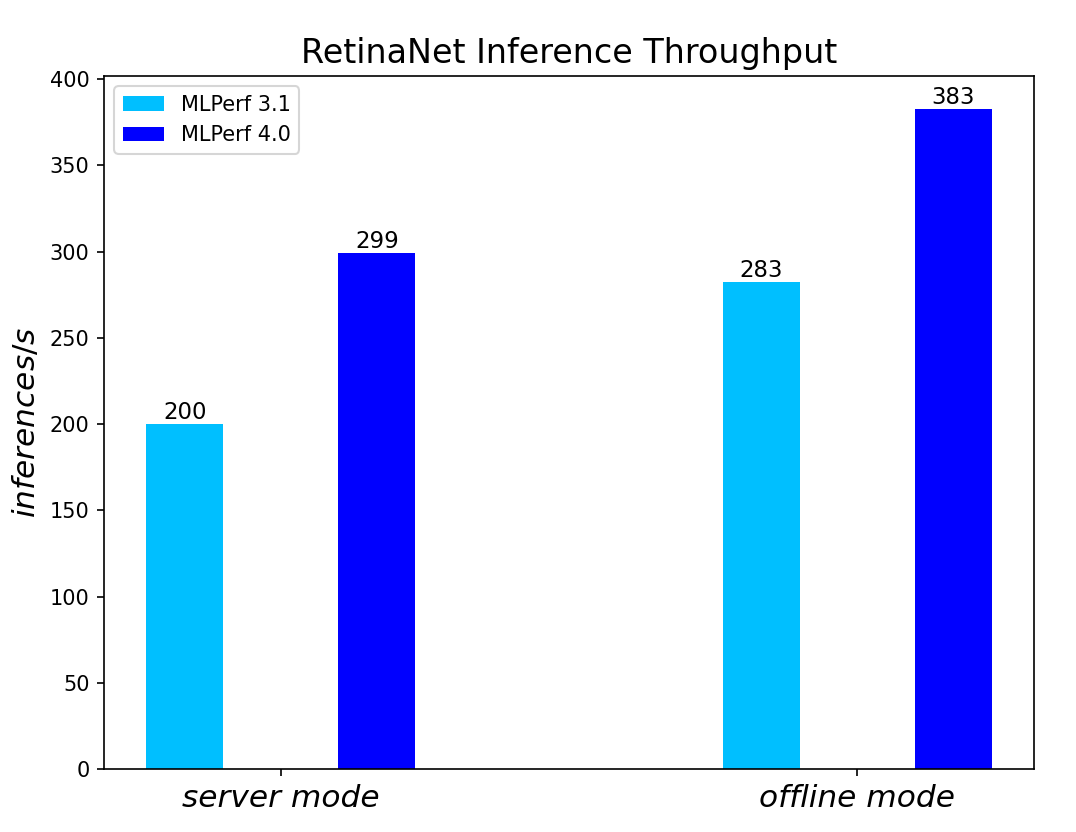
Figure 5. RetinaNet Object Detection Model Inference results for server and offline scenarios
RNN-T Text to Speech Model server & offline scenarios:
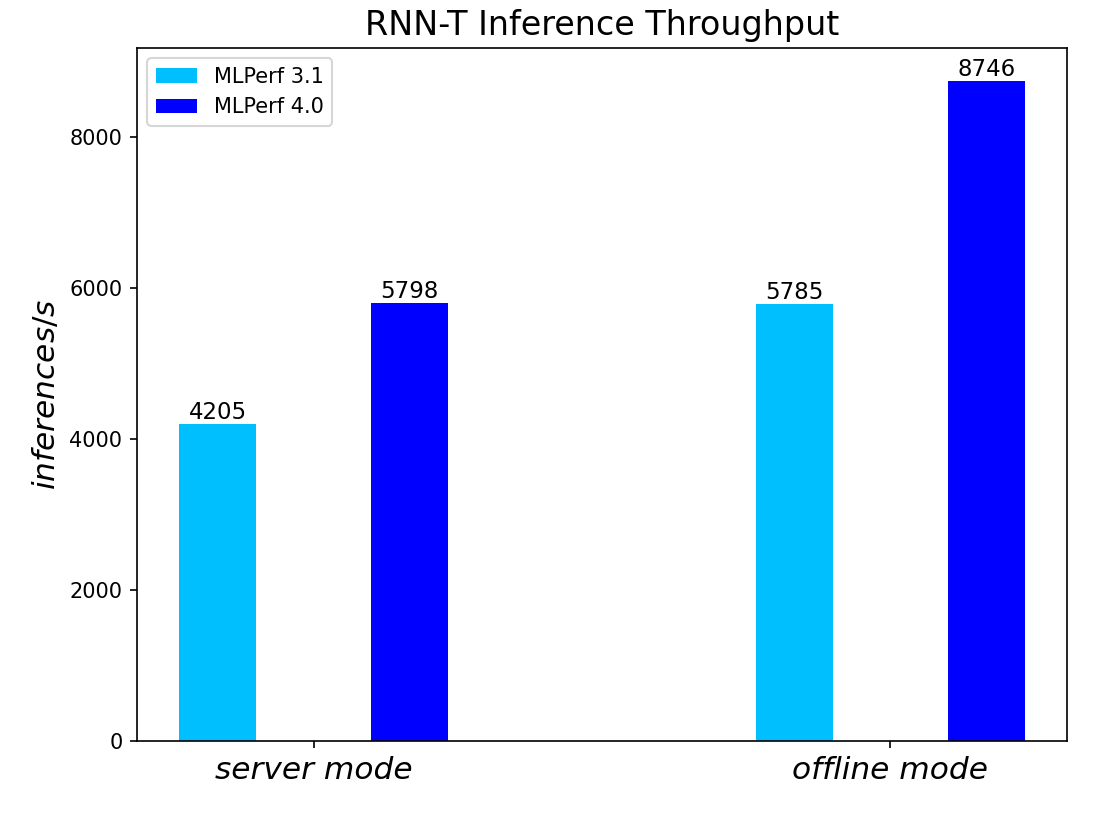
Figure 6. RNN-T Text to Speech Model Inference results for server and offline scenarios
3D-Unet Medical Imaging Model offline scenarios:
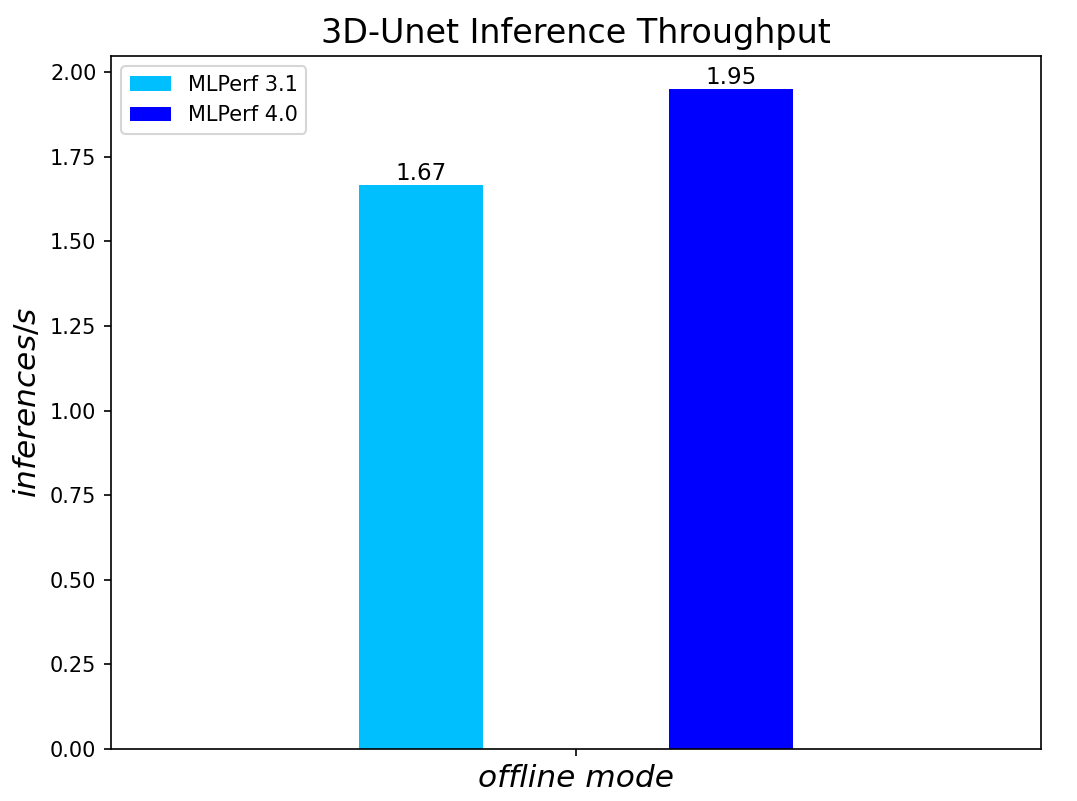
Figure 7. 3D-Unet Medical Imaging Model Inferencing results for server and offline scenarios
DLRMv2-99 Recommendation Model server & offline scenarios:
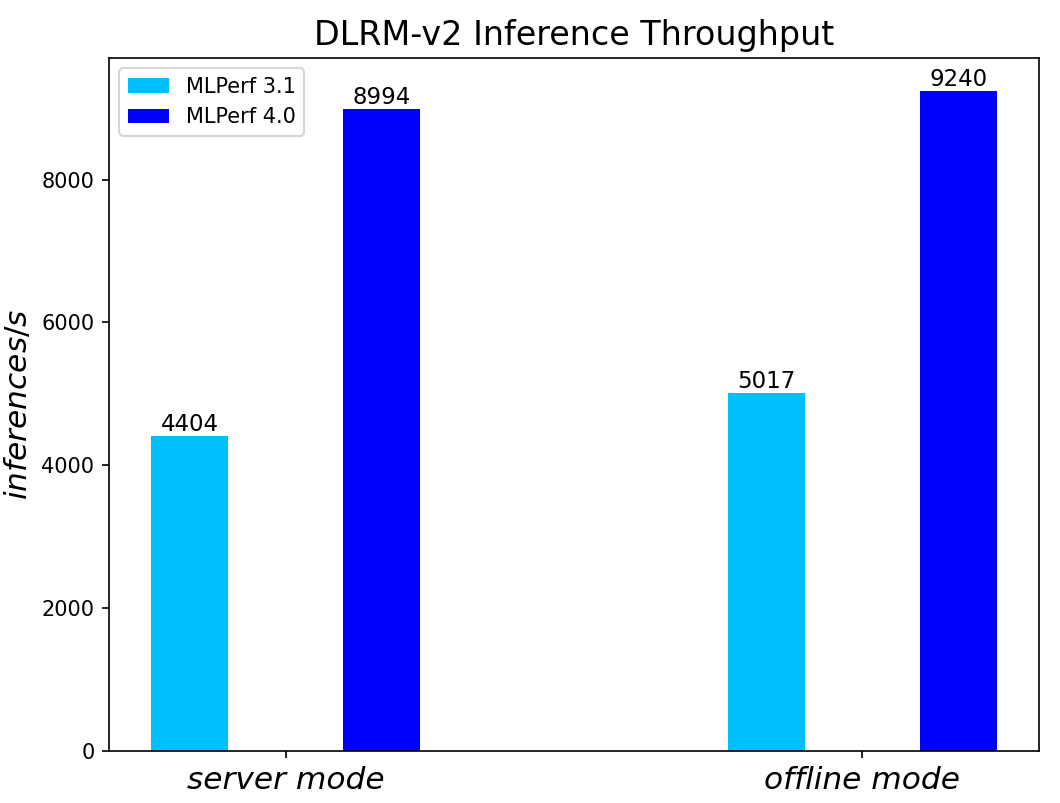
Figure 8. DLRMv2-99 Recommendation Model Inference results for server and offline scenarios
GPT-J-99 Summarization Model server & offline scenarios:
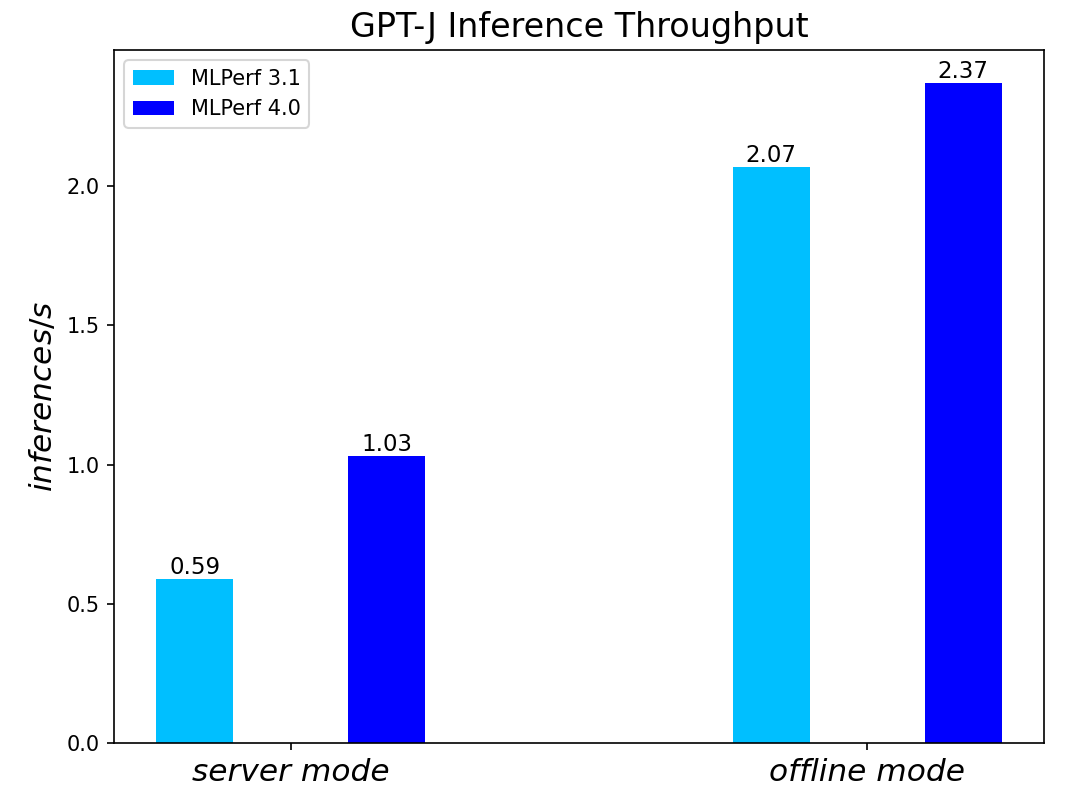
Figure 9. GPT-J-99 Summarization Model Inference results for server and offline scenarios
Conclusion
- The PowerEdge R760 server with 5th Generation Intel® Xeon® Scalable Processors produces strong data center inference performance, confirmed by the official version 4.0 MLPerfTM benchmarking results from MLCommonsTM.
- The high performance and versatility are demonstrated across natural language processing, image classification, object detection, medical imaging, speech-to-text inference, recommendation, and summarization systems.
- Compared to its prior version 3.0 and 3.1 submissions enabled by 4th Generation Intel® Xeon® Scalable Processors, the R760 with 5th Generation Intel® Xeon® Scalable Processors show significant performance improvement across different models, including the generative AI models like GPT-J.
- The R760 supports different deep learning inference scenarios in the MLPerfTM benchmark scenarios as well as other complex workloads such as database and advanced analytics. It is an ideal solution for data center modernization to drive operational efficiency, lead to higher productivity, and minimize total cost of ownership (TCO).
References
MLCommonsTM MLPerfTM v4.0 Inference Benchmark Submission IDs
ID | Submitter | System |
4.0-0026 | Dell | Dell PowerEdge Server R760 (2x Intel® Xeon® Platinum 8592+) |

Ready Solutions for HPC BeeGFS High Performance Storage: HDR100 Refresh
Wed, 19 Jul 2023 19:59:24 -0000
|Read Time: 0 minutes
Introduction
True to the tradition of keeping up with the technology trends, the Dell EMC Ready Solutions for BeeGFS High Performance Storage, that was originally released during November 2019, has now been refreshed with the latest software and hardware. The base architecture of the solution remains the same. The following table lists the differences between the initially released InfiniBand EDR based solution and the current InfiniBand HDR100 based solution in terms of the software and hardware used.
Table 1. Comparison of Hardware and Software of EDR and HDR based BeeGFS High Performance Solution
Software | Initial Release (Nov. 2019) | Current Refresh (Nov. 2020) |
Operating System | CentOS 7.6 | CentOS 8.2. |
Kernel version | 3.10.0-957.27.2.el7.x86_64 | 4.18.0-193.14.2.el8_2.x86_64 |
BeeGFS File system version | 7.1.3 | 7.2 |
Mellanox OFED version | 4.5-1.0.1.0 | 5.0-2.1.8.0 |
Hardware | Initial Release | Current Refresh |
NVMe Drives | Intel P4600 1.6 TB Mixed Use | Intel P4610 3.2 TB Mixed Use |
InfiniBand Adapters | ConnectX-5 Single Port EDR | ConnectX-6 Single Port HDR100 |
InfiniBand Switch | SB7890 InfiniBand EDR 100 Gb/s Switch -1U (36x EDR 100 Gb/s ports) | QM8790 Quantum HDR Edge Switch – 1U (80x HDR100 100 Gb/s ports using splitter cables) |
This blog presents the architecture, updated technical specifications and the performance characterization of the upgraded high-performance solution. It also includes a comparison of the performance with respect to the previous EDR based solution.
Solution Reference Architecture
The high-level architecture of the solution remains the same as the initial release. The hardware components of the solution consist of 1x PowerEdge R640 as the management server and 6x PowerEdge R740xd servers as metadata/storage servers to host the metadata and storage targets. Each PowerEdge R740xd server is equipped with 24x Intel P4610 3.2 TB Mixed Use Express Flash drives and 2x Mellanox ConnectX-6 HDR100 adapters. Figure 1 shows the reference architecture of the solution.
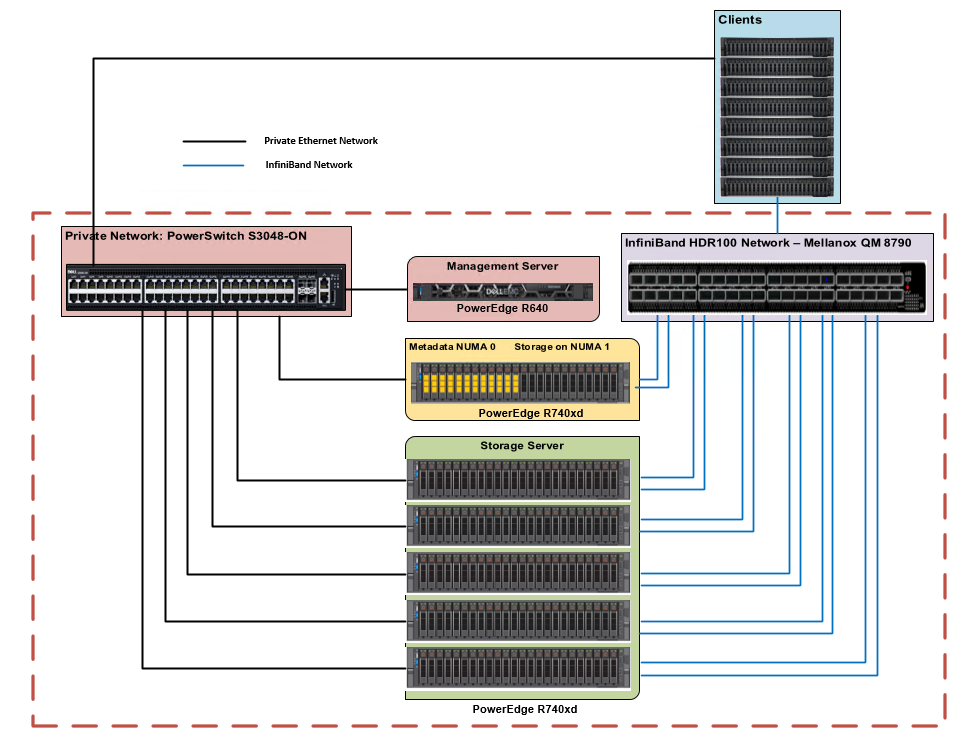
Figure 1. Dell EMC Ready Solutions for HPC BeeGFS Storage – Reference Architecture
There are two networks-the InfiniBand network, and the private Ethernet network. The management server is only connected via Ethernet to the metadata and storage servers. Each metadata and storage server has 2x links to the InfiniBand network and is connected to the private network via Ethernet. The clients have one InfiniBand link and are also connected to the private Ethernet network. For more details on the solution configuration please refer to the blog and whitepaper on BeeGFS High Performance Solution published at hpcatdell.com .
Hardware and Software Configuration
Table 2 and 3 describe the hardware specifications of management server and metadata/storage server respectively. Table 4 describes the versions of the software used for the solution.
Table 2. PowerEdge R640 Configuration (Management Server)
Component | Description |
Processor | 2 x Intel Xeon Gold 5218 2.3GHz, 16 cores |
Memory | 12 x 8GB DDR4 2666MT/s DIMMs - 96GB |
Local Disks | 6 x 300GB 15K RPM SAS 2.5in HDDs |
RAID Controller | PERC H740P Integrated RAID Controller |
Out of Band Management | iDRAC9 Enterprise with Lifecycle Controller |
Table 3. PowerEdge R740xd Configuration (Metadata and Storage Servers)
Component | Description |
Processor | 2x Intel Xeon Platinum 8268 CPU @ 2.90GHz, 24 cores |
Memory | 12 x 32GB DDR4 2933MT/s DIMMs - 384GB |
BOSS Card | 2x 240GB M.2 SATA SSDs in RAID 1 for OS |
Local Drives | 24x Dell Express Flash NVMe P4610 3.2 TB 2.5” U.2 |
InfiniBand Adapter | 2x Mellanox ConnectX-6 single port HDR100 Adapter |
InfiniBand Adapter Firmware | 20.26.4300 |
Out of Band Management | iDRAC9 Enterprise with Lifecycle Controller |
Table 4. Software Configuration (Metadata and Storage Servers)
Component | Description |
Operating System | CentOS Linux release 8.2.2004 (Core) |
Kernel version | 4 4.18.0-193.14.2.el8_2. |
Mellanox OFED | 5.0-2.1.8.0 |
NVMe SSDs | VDV1DP23 |
OpenMPI | 4.0.3rc4 |
Intel Data Center Tool | v 3.0.26 |
BeeGFS | 7.2 |
Grafana | 7.1.5-1 |
InfluxDB | 1.8.2-1 |
IOzone | 3.490 |
MDtest | 3.3.0+dev |
Performance Evaluation
The system performance was evaluated using the following benchmarks:
Performance tests were run on a testbed with clients as described in Table 5. For test cases where the number of IO threads were greater than the physical number of IO clients, threads were distributed equally across the clients (i.e., 32 threads = 2 threads per client…,1024 threads = 64 threads per node).
Table 5. Client Configuration
Component | Description |
Server model | 8x PowerEdge R840 8x PowerEdge C6420 |
Processor | 4x Intel(R) Xeon(R) Platinum 8260 CPU @ 2.40GHz, 24 cores (R840) 2x Intel(R) Xeon(R) Gold 6248 CPU @ 2.50GHz, 20 cores (C6420) |
Memory | 24 x 16GB DDR4 2933MT/s DIMMs - 384GB (R840) 12 x 16GB DDR4 2933MT/s DIMMs – 192 GB (C6420) |
Operating System | 4.18.0-193.el8.x86_64 |
Kernel version | Red Hat Enterprise Linux release 8.2 (Ootpa) |
InfiniBand Adapter | 1x ConnectX-6 single port HDR100 adapter |
OFED version | 5.0-2.1.8.0 |
Sequential Reads and Writes N-N
The IOzone benchmark was used in the sequential read and write mode to evaluate sequential reads and writes. These tests were conducted using multiple thread counts starting at 1 thread and up to 1024 threads. At each thread count, an equal number of files were generated since this test works on one file per thread or the N-N case. The round robin algorithm was used to choose targets for file creation in a deterministic fashion.
For all the tests, aggregate file size was 8 TB and this was equally divided among the number of threads for any given test. The aggregate file size chosen was large enough to minimize the effects of caching from the servers as well as from BeeGFS clients.
IOzone was run in a combined mode of write then read (-i 0, -i 1) to allow it to coordinate the boundaries between the operations. For this test, we used a 1MiB record size for every run. The commands used for Sequential N-N tests are given below:
Sequential Writes and Reads: iozone -i 0 -i 1 -c -e -w -r 1m -I -s $Size -t $Thread -+n -+m /path/to/threadlist
OS caches were also dropped or cleaned on the client nodes between iterations as well as between write and read tests by running the command:
# sync && echo 3 > /proc/sys/vm/drop_caches
The default stripe count for BeeGFS is 4. However, the chunk size and the number of targets per file can be configured on a per-directory basis. For all these tests, BeeGFS stripe size was chosen to be 2MB and stripe count was chosen to be 3 since we have three targets per NUMA zone as shown below:
# beegfs-ctl --getentryinfo --mount=/mnt/beegfs /mnt/beegfs/benchmark --verbose
Entry type: directory
EntryID: 0-5F6417B3-1
ParentID: root
Metadata node: storage1-numa0-2 [ID: 2]
Stripe pattern details:
+ Type: RAID0
+ Chunksize: 2M
+ Number of storage targets: desired: 3
+ Storage Pool: 1 (Default)
Inode hash path: 33/57/0-5F6417B3-1
The testing methodology and the tuning parameters used were similar to those previously described in the EDR based solution. For additional details in this regard, please refer to the whitepaper on the BeeGFS High Performance Solution.
Note:
The number of clients used for the performance characterization of the EDR based solution is 32 whereas the number of clients used for the performance characterization of the HDR100 based solution is 16 only. In the performance charts given below, this is indicated by including 16c which denotes 16clients and 32c which denotes 32 clients. The dotted lines show the performance of the EDR based solution and the solid lines shows the performance of the HDR100 based solution.
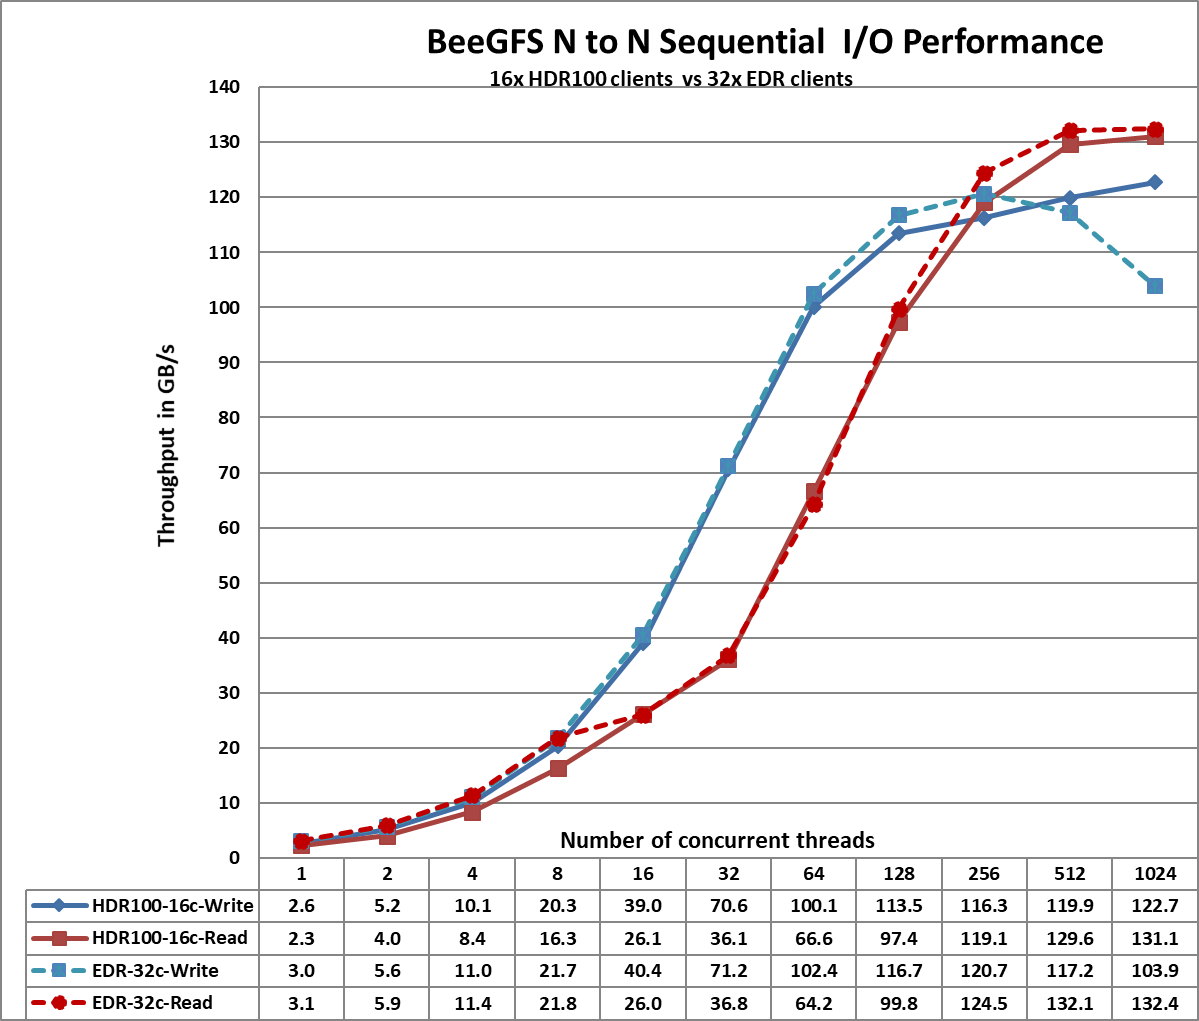
Figure 2. Sequential IOzone 8 TB aggregate file size
From Figure 2, we observe that the HDR100 peak read performance is ~131 GB/s and peak write is ~123 GB/s at 1024 threads. Each drive can provide 3.2 GB/s peak read performance and 3.0 GB/s peak write performance, which allows a theoretical peak of 460.8 GB/s for reads and 432 GB/s for the solution. However, in this solution, the network is the limiting factor. In the setup, we have a total of 11 InfiniBand HDR100 links for the storage servers. Each link can provide a theoretical peak performance of 12.4 GB/s which allows an aggregate theoretical peak performance of 136.4 GB/s. The achieved peak read and write performance are 96% and 90% respectively of the theoretical peak performance.
We observe that the peak read performance for the HDR100 based solution is slightly lower than that observed with the EDR based solution. This can be attributed to the fact that the benchmark tests were carried out using 16 clients for the HDR100 based setup while the EDR based solution used 32 clients. The improved write performance with HDR100 is due to the fact that the P4600 NVMe SSD used in the EDR based solution could provide only 1.3 GB/s for sequential writes whereas the P4610 NVMe SSD provides 3.0 GB/s peak write performance.
We also observe that the read performance is lower than writes for thread counts from 16 to 128. This is because a PCIe read operation is a Non-Posted Operation, requiring both a request and a completion, whereas a PCIe write operation is a Posted Operation that consists of a request only. A PCIe write operation is a fire and forget operation, wherein once the Transaction Layer Packet is handed over to the Data Link Layer, the operation completes.
Read throughput is typically lower than the write throughput because reads require two transactions instead of a single write for the same amount of data. The PCI Express uses a split transaction model for reads. The read transaction includes the following steps:
- The requester sends a Memory Read Request (MRR).
- The completer sends out the acknowledgement to MRR.
- The completer returns a Completion with Data.
The read throughput depends on the delay between the time the read request is issued and the time the completer takes to return the data. However, when the application issues enough number of read requests to offset this delay, then throughput is maximized. A lower throughput is measured when the requester waits for completion before issuing subsequent requests. A higher throughput is registered when multiple requests are issued to amortize the delay after the first data returns. This explains why the read performance is less than that of the writes from 16 threads to 128 threads and then an increased throughput is observed for higher thread counts of 256, 512 and 1024.
More details regarding the PCI Express Direct Memory Access is available at https://www.intel.com/content/www/us/en/programmable/documentation/nik1412547570040.html#nik1412547565760
Random Reads and Writes N-N
IOzone was used in the random mode to evaluate random IO performance. Tests were conducted with thread counts starting from 8 threads to up to 1024 threads. Direct IO option (-I) was used to run IOzone so that all operations bypass the buffer cache and go directly to the disk. BeeGFS stripe count of 3 and chunk size of 2MB was used. A 4KiB request size was used on IOzone and performance measured in I/O operations per second (IOPS). An aggregate file size of 8 TB was selected to minimize the effects of caching. The aggregate file size was equally divided among the number of threads within any given test. The OS caches were dropped between the runs on the BeeGFS servers as well as BeeGFS clients.
The command used for random reads and writes is given below:
iozone -i 2 -w -c -O -I -r 4K -s $Size -t $Thread -+n -+m /path/to/threadlist
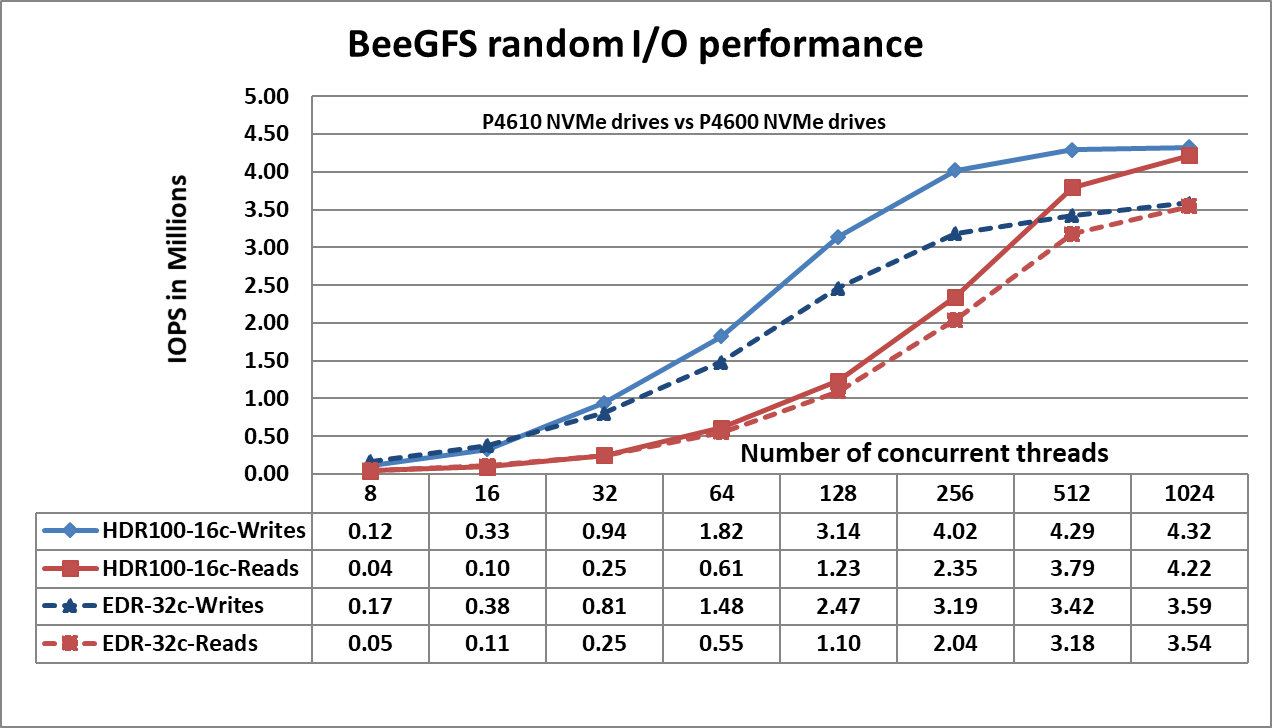
Figure 3. N-N Random Performance
Figure 3 shows that the random writes peak at ~4.3 Million IOPS at 1024 threads and the random reads peak at ~4.2 Million IOPS at 1024 threads. Both the write and read performance show a higher performance when there are a greater number of IO requests. This is because NVMe standard supports up to 64K I/O queue and up to 64K commands per queue. This large pool of NVMe queues provide higher levels of I/O parallelism and hence we observe IOPS exceeding 3 Million. The following table provides a comparison of the random IO performance of the P4610 and P4600 NVMe SSDs to better understand the observed results.
Table 6. Performance Specification of Intel NVMe SSDs
Product | P4610 3.2 TB NVMe SSD | P4600 1.6 TB NVMe SSD |
Random Read (100% Span) | 638000 IOPS | 559550 IOPS |
Random Write (100% Span) | 222000 IOPS | 176500 IOPS |
Metadata Tests
The metadata performance was measured with MDtest and OpenMPI to run the benchmark over the 16 clients. The benchmark was used to measure file creates, stats, and removals performance of the solution. Since performance results can be affected by the total number of IOPs, the number of files per directory and
the number of threads, a consistent number of files across tests was chosen to allow comparison. The total number of files was chosen to be ~ 2M in powers of two (2^21 = 2097152). The number of files per
directory was fixed at 1024, and the number of directories varied as the number of threads changed. The test methodology, and directories created are similar to that described in the previous blog.
The following command was used to execute the benchmark:
mpirun -machinefile $hostlist --map-by node -np $threads ~/bin/mdtest -i 3 -b
$Directories -z 1 -L -I 1024 -y -u -t -F
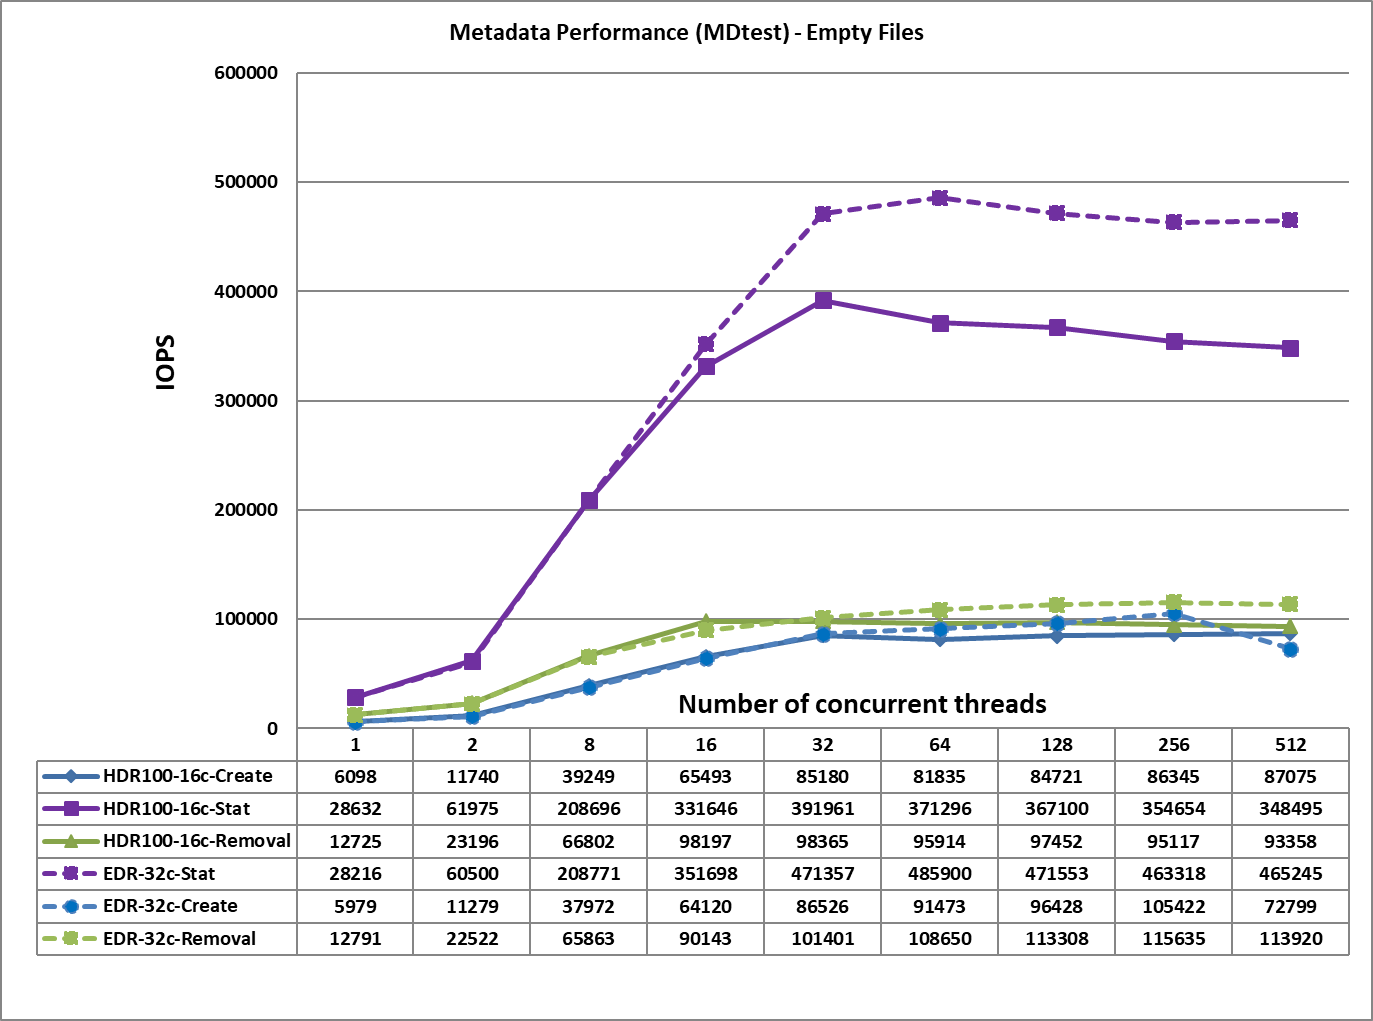
Figure 4. Metadata Performance – Empty Files
From Figure 4, we observe that the create, removal and read performance are comparable to those received for the EDR based solution whereas the Stat performance is lower by ~100K IOPS. This may be because the HDR100 based solution uses only 16 clients for performance characterization whereas the EDR based solution used 32 clients. The file create operations reach their peak value at 512 threads at ~87K op/s. The removal and stat operations attained the maximum value at 32 threads with ~98K op/s, and 392 op/s respectively.
Conclusion
This blog presents the performance characteristics of the Dell EMC High Performance BeeGFS Storage Solution with the latest software and hardware. At the software level, high-performance solution has now been updated with
- CentOS 8.2.2004 as the base OS
- BeeGFS v7.2
- Mellanox OFED version 5.0-2.1.8.0.
At the hardware level, the solution uses
- ConnectX-6 Single Port HDR100 adapters
- Intel P4610 3.2 TB Mixed use, NVMe drives and
- Quantum switch QM8790 with 80x HDR100 100 Gb/s ports.
The performance analysis allows us to conclude that:
- IOzone sequential read and write performance is similar to that of the EDR based solution because network is the bottleneck here.
- The IOzone random read and write performance is greater than the previous EDR based solution by ~ 1M IOPS because of the use of P4610 NVMe drives which provide improved random write and read performance.
- The file create and removal performance is similar to that of the EDR based solution.
- The file stat performance registers a 19% drop because of the use of only 16 clients in the current solution as compared to the 32 clients used in the previous EDR based solution.
References
Dell EMC Ready Solutions for HPC BeeGFS Storage - Technical White Paper
Features of Dell EMC Ready Solutions for HPC BeeGFS Storage
Scalability of Dell EMC Ready Solutions for HPC BeeGFS Storage
Dell EMC Ready Solutions for HPC BeeGFS High Performance Storage

Interpreting TPCx-AI Benchmark Results
Wed, 01 Feb 2023 14:29:11 -0000
|Read Time: 0 minutes
TPCx-AI Benchmark
Overview
TPCx-AI Benchmark abstracts the diversity of operations in a retail data center scenario. Selecting a retail business model assists the reader relate intuitively to the components of the benchmark, without tracking that industry segment tightly. Such tracking would minimize the relevance of the benchmark. The TPCx-AI benchmark can be used to characterize any industry that must transform operational and external data into business intelligence.
This paper introduces the TPCx-AI benchmark and uses a published TPCx-AI result to describe how the primary metrics are determined and how they should be read.
Benchmark model
TPCx-AI data science pipeline
The TPCx-AI benchmark imitates the activity of retail businesses and data centers with:
- Customer information
- Department stores
- Sales
- Financial data
- Product catalog and reviews
- Emails
- Data center logs
- Facial images
- Audio conversations
It models the challenges of end-to-end artificial intelligence systems and pipelines where the power of machine learning and deep learning is used to:
- Detect anomalies (fraud and failures)
- Drive AI-based logistics optimizations to reduce costs through real-time forecasts (classification, clustering, forecasting, and prediction)
- Use deep learning AI techniques for customer service management and personalized marketing (facial recognition and speech recognition)
It consists of ten different use cases that help any retail business data center address and manage any business analysis environment.
The TPCx-AI kit uses a Parallel Data Generator Framework (PDGF) to generate the test dataset. To mimic the datasets of different company sizes the user can specify scale factor (SF), a configuration parameter. It sets the target input dataset size in GB. For example, SF=100 equals 100 GB. Once generated, all the data is processed for subsequent stages of postprocessing within the data science pipeline.
Use cases
The TPCx-AI Benchmark models the following use cases:
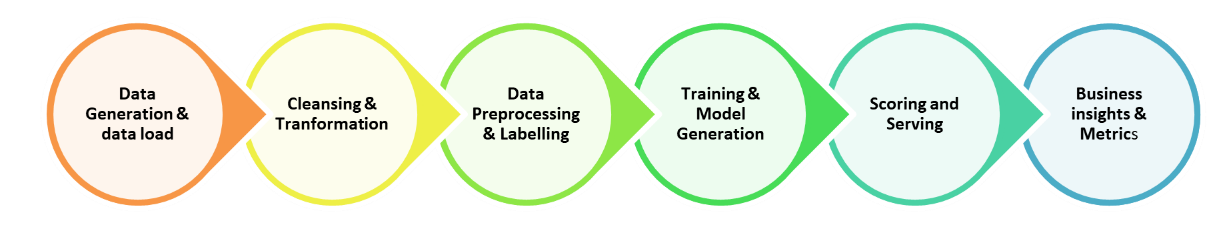
Figure 1: TPCx-AI benchmark use case pipeline flow
Table 1: TPCx-AI benchmark use cases
ID | Use case | M/DL | Area | Algorithm |
UC01 | Customer Segmentation | ML | Analytics | K-Means |
UC02 | Conversation Transcription | DL | NLP | Recurrent Neural Network |
UC03 | Sales Forecasting | ML | Analytics | ARIMA |
UC04 | Spam Detection | ML | Analytics | Naïve Bayes |
UC05 | Price Prediction | DL | NLP | RNN |
UC06 | Hardware Failure Detection | ML | Analytics | Support Vector Machines |
UC07 | Product Rating | ML | Recommendation | Alternating Least Squares |
UC08 | Trip Type Classification | ML | Analytics | XGBoost |
UC09 | Facial Recognition | DL | Analytics | Logistic Regression |
UC10 | Fraud Detection | ML | Analytics | Logistic Regression |
Benchmark run
The TPCx-AI Benchmark run consists of seven separate tests run sequentially. The tests are listed below:
- Data Generation using PDGF
- Load Test – Loads data into persistent storage (HDFS or other file systems)
- Power Training Test – Generates and trains models
- Power Serving Test I – Uses the trained model in Training Phase to conduct the serving phase (Inference) for each use case
- Power Serving Test II – There are two serving tests that run sequentially. The test with the greater geometric mean (geomean) of serving times is used in the overall score.
- Scoring Test – Model validation stage. Accuracy of the model is determined using defined accuracy metrics and criteria
- Throughput Test – Runs two or more concurrent serving streams
The elapsed time for each test is reported.
Note: There are seven benchmark phases that span an end-to-end data science pipeline as shown in Figure 1. For a compliant performance run, the data generation phase is run but not scored and consists of the subsequent six separate tests, load test through throughput test, run sequentially.
Primary metrics
For every result, the TPC requires the publication of three primary metrics:
- Performance
- Price-Performance
- Availability Date
Performance metric
It is possible that not all scenarios in TPCx-AI will be applicable to all users. To account for this situation, while defining the performance metric for TPCx-AI, no single scenario dominates the performance metric. The primary performance metric is the throughput expressed in terms of AI use cases per minute (AIUCpm) @ SF is defined in the figure below.
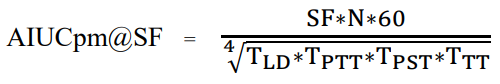
Figure 2: Definition of the TPCx-AI benchmark metric
Where:
TLD = Load time
TPTT = Geomean of training times
TPST1 = Geomean of Serving times
TPST2 = Geomean of serving times
TPST = Max (TPST1, TPST2)
TTT = Total elapsed time/ (#streams * number of use cases)
N = Number of use cases
Note: The elapsed time for the scoring test is not considered for the calculation of the performance metric. Instead, the results of the scoring test are used to determine whether the Performance test was successful.
The scoring test result for each user case should meet or better the reference result set provided in the kit as shown in the figure below.
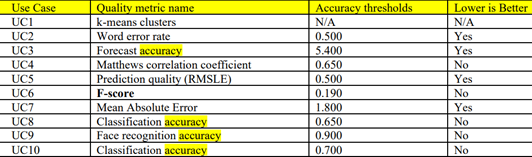
Figure 3: Benchmark run accuracy metrics
Calculating the Performance metric
To illustrate how the performance metric is calculated, let us consider the results published for SF=10 at:
https://www.tpc.org/tpcx-ai/results/tpcxai_result_detail5.asp?id=122110802
A portion of the TPCx-AI result highlights, showing the elapsed time for the six sequential tests constituting the benchmark run is shown in the figure below.
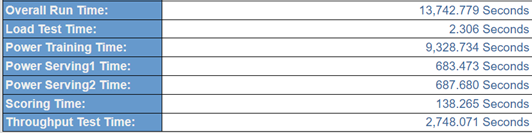
Figure 4: Elapsed time for the benchmark test phases
The result highlights only provide the training times and the serving times. To calculate the final performance metric, we need to use the geometric mean of the training times and serving times. To arrive at the geomean of the training times and the testing times, the time taken for each use case is needed. That time is provided in the Full Disclosure Report (FDR) that is part of the benchmark results. The link to the FDR of the SF=10 results that we are considering are at:
https://www.tpc.org/results/fdr/tpcxai/dell~tpcxai~10~dell_poweredge_r7615~fdr~2022-11-09~v01.pdf
The use case times and accuracy table from the FDR are shown in the figure below.
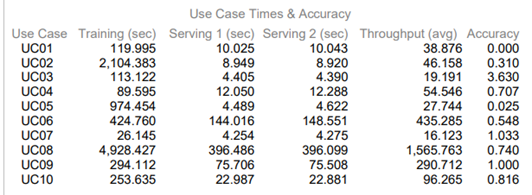
Figure 5: Use case times and accuracy
Note: The accuracy metrics are defined in Table 7a of the TPCx-AI User Guide.
Using the data in Figure 4 and Figure 5:
TLD = Load time =2.306 seconds
TPTT = Geomean of training time =316.799337
(119.995*2104.383*113.122*89.595*974.454*424.76*26.14*4928.427*29.112*253.63)1/10
TPST1 = Geomean of Serving times =19.751 seconds
(10.025*8.949*4.405*12.05*4.489*144.016*4.254*396.486*75.706*22.987)1/10
TPST2 = Geomean of serving times = 19.893 seconds
(10.043*8.92*4.39*12.288*4.622*148.551*4.275*396.099*75.508*22.881)1/0
TPST = Max (TPST1, TPST2)= 19.893 seconds
TTT = Total elapsed time/ (#streams * # of use cases) =2748.071/ (100*10)= 2.748 seconds
N = Number of use cases =10
Note: The geometric mean is arrived at by multiplying the time taken for each of the use cases and finding the 10th root of the product.
Plugging the values in the formula for calculating the AIUCpm@SF given in Figure 2, we get:
AIUCpm@SF= 10*10*60/ (2.306*316.799*19.893*2.748)1/4
= 6000/ (39935.591)1/4
= 6000/14.1365=424.433
The actual AIUCpm@SF10=425.31
Calculating the Price-Performance metric
The Price-Performance metric is defined in the figure below.
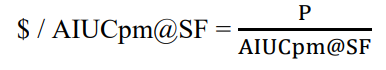
Figure 6: Price-Performance metric definition
Where:
- P = is the price of the hardware and software components in the System Under Test (SUT)
- AIUCpm@SF is the reported primary performance metric
Note: A one-year pricing model must be used to calculate the price and the price-performance result of the TPCx-AI Benchmark.
AIUCpm@SF10 = 425.31
Price of the configuration =$ 48412
$/AIUCpm@SF10 = 113.83 USD per AIUCpm@SF10
Availability date
All components used in this result will be orderable and available for shipping by February 22, 2023.
Performance results
Dell has published six world record-setting results based on the TPCx-AI Benchmark standard of the TPC. Links to the publications are provided below.
SF1000
Dell PowerEdge R650/Intel Xeon Gold (Ice Lake) 6348/CDP 7.1.7—11 nodes
https://www.tpc.org/tpcx-ai/results/tpcxai_result_detail5.asp?id=122120101
SF300
Dell PowerEdge R6625/AMD EPYC Genoa 9354/CDP 7.1.7—four nodes
https://www.tpc.org/tpcx-ai/results/tpcxai_result_detail5.asp?id=122110805
SF100
Dell PowerEdge R6625/AMD EPYC Genoa 9354/CDP 7.1.7—four nodes
https://www.tpc.org/tpcx-ai/results/tpcxai_result_detail5.asp?id=122110804
SF30
Dell PowerEdge R6625/AMD EPYC Genoa 9174F/Anaconda3—one node
https://www.tpc.org/tpcx-ai/results/tpcxai_result_detail5.asp?id=122110803
SF10
Dell PowerEdge R7615/AMD EPYC Genoa 9374F/Anaconda3—one node
https://www.tpc.org/tpcx-ai/results/tpcxai_result_detail5.asp?id=122110802
SF3
Dell PowerEdge R7615/AMD EPYC Genoa 9374F/Anaconda3—one node
https://www.tpc.org/tpcx-ai/results/tpcxai_result_detail5.asp?id=122110801
With these results, Dell Technologies holds the following world records on the TPCx-AI Benchmark Standard:
- #1 Performance and Price-Performance on SF1000
- #1 Performance and Price-Performance on SF300
- #1 Performance and Price-Performance on SF100
- #1 Performance and Price-Performance on SF30
- #1 Performance on SF10
- #1 Performance Price-Performance on SF3
Conclusion
Summary
This blog describes the TPCx-AI benchmark and how the performance result of the TPCx-AI Benchmark can be interpreted. It also describes how Dell Technologies maintains leadership in the TPCx-AI landscape.