


Ready Solutions for HPC BeeGFS High Performance Storage: HDR100 Refresh

Introduction
True to the tradition of keeping up with the technology trends, the Dell EMC Ready Solutions for BeeGFS High Performance Storage, that was originally released during November 2019, has now been refreshed with the latest software and hardware. The base architecture of the solution remains the same. The following table lists the differences between the initially released InfiniBand EDR based solution and the current InfiniBand HDR100 based solution in terms of the software and hardware used.
Table 1. Comparison of Hardware and Software of EDR and HDR based BeeGFS High Performance Solution
Software | Initial Release (Nov. 2019) | Current Refresh (Nov. 2020) |
Operating System | CentOS 7.6 | CentOS 8.2. |
Kernel version | 3.10.0-957.27.2.el7.x86_64 | 4.18.0-193.14.2.el8_2.x86_64 |
BeeGFS File system version | 7.1.3 | 7.2 |
Mellanox OFED version | 4.5-1.0.1.0 | 5.0-2.1.8.0 |
Hardware | Initial Release | Current Refresh |
NVMe Drives | Intel P4600 1.6 TB Mixed Use | Intel P4610 3.2 TB Mixed Use |
InfiniBand Adapters | ConnectX-5 Single Port EDR | ConnectX-6 Single Port HDR100 |
InfiniBand Switch | SB7890 InfiniBand EDR 100 Gb/s Switch -1U (36x EDR 100 Gb/s ports) | QM8790 Quantum HDR Edge Switch – 1U (80x HDR100 100 Gb/s ports using splitter cables) |
This blog presents the architecture, updated technical specifications and the performance characterization of the upgraded high-performance solution. It also includes a comparison of the performance with respect to the previous EDR based solution.
Solution Reference Architecture
The high-level architecture of the solution remains the same as the initial release. The hardware components of the solution consist of 1x PowerEdge R640 as the management server and 6x PowerEdge R740xd servers as metadata/storage servers to host the metadata and storage targets. Each PowerEdge R740xd server is equipped with 24x Intel P4610 3.2 TB Mixed Use Express Flash drives and 2x Mellanox ConnectX-6 HDR100 adapters. Figure 1 shows the reference architecture of the solution.
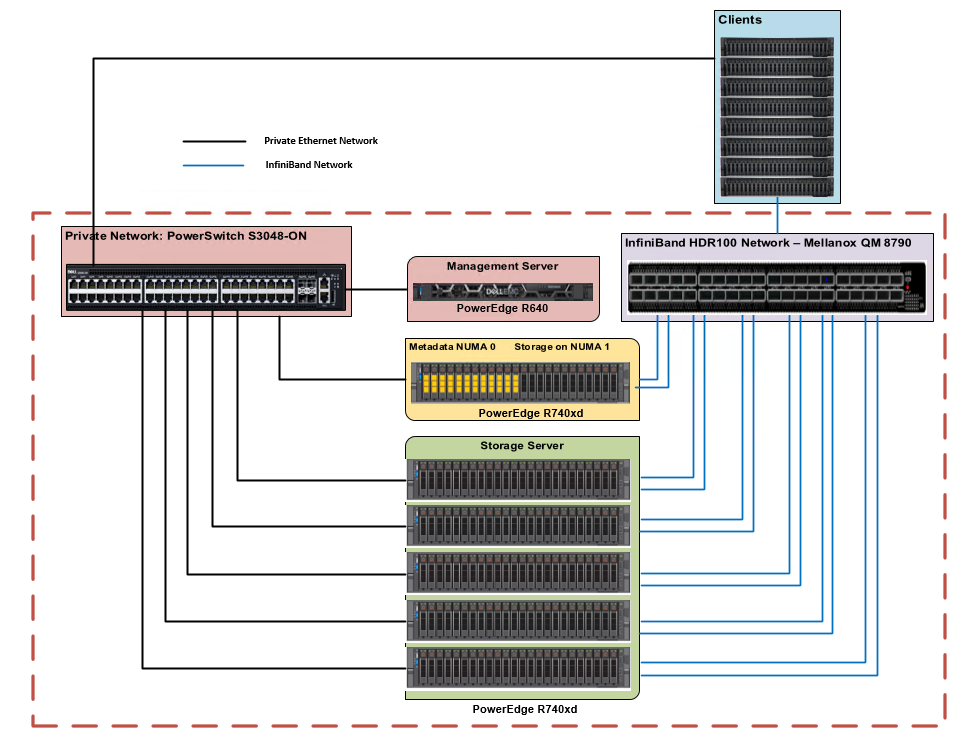
Figure 1. Dell EMC Ready Solutions for HPC BeeGFS Storage – Reference Architecture
There are two networks-the InfiniBand network, and the private Ethernet network. The management server is only connected via Ethernet to the metadata and storage servers. Each metadata and storage server has 2x links to the InfiniBand network and is connected to the private network via Ethernet. The clients have one InfiniBand link and are also connected to the private Ethernet network. For more details on the solution configuration please refer to the blog and whitepaper on BeeGFS High Performance Solution published at hpcatdell.com .
Hardware and Software Configuration
Table 2 and 3 describe the hardware specifications of management server and metadata/storage server respectively. Table 4 describes the versions of the software used for the solution.
Table 2. PowerEdge R640 Configuration (Management Server)
Component | Description |
Processor | 2 x Intel Xeon Gold 5218 2.3GHz, 16 cores |
Memory | 12 x 8GB DDR4 2666MT/s DIMMs - 96GB |
Local Disks | 6 x 300GB 15K RPM SAS 2.5in HDDs |
RAID Controller | PERC H740P Integrated RAID Controller |
Out of Band Management | iDRAC9 Enterprise with Lifecycle Controller |
Table 3. PowerEdge R740xd Configuration (Metadata and Storage Servers)
Component | Description |
Processor | 2x Intel Xeon Platinum 8268 CPU @ 2.90GHz, 24 cores |
Memory | 12 x 32GB DDR4 2933MT/s DIMMs - 384GB |
BOSS Card | 2x 240GB M.2 SATA SSDs in RAID 1 for OS |
Local Drives | 24x Dell Express Flash NVMe P4610 3.2 TB 2.5” U.2 |
InfiniBand Adapter | 2x Mellanox ConnectX-6 single port HDR100 Adapter |
InfiniBand Adapter Firmware | 20.26.4300 |
Out of Band Management | iDRAC9 Enterprise with Lifecycle Controller |
Table 4. Software Configuration (Metadata and Storage Servers)
Component | Description |
Operating System | CentOS Linux release 8.2.2004 (Core) |
Kernel version | 4 4.18.0-193.14.2.el8_2. |
Mellanox OFED | 5.0-2.1.8.0 |
NVMe SSDs | VDV1DP23 |
OpenMPI | 4.0.3rc4 |
Intel Data Center Tool | v 3.0.26 |
BeeGFS | 7.2 |
Grafana | 7.1.5-1 |
InfluxDB | 1.8.2-1 |
IOzone | 3.490 |
MDtest | 3.3.0+dev |
Performance Evaluation
The system performance was evaluated using the following benchmarks:
Performance tests were run on a testbed with clients as described in Table 5. For test cases where the number of IO threads were greater than the physical number of IO clients, threads were distributed equally across the clients (i.e., 32 threads = 2 threads per client…,1024 threads = 64 threads per node).
Table 5. Client Configuration
Component | Description |
Server model | 8x PowerEdge R840 8x PowerEdge C6420 |
Processor | 4x Intel(R) Xeon(R) Platinum 8260 CPU @ 2.40GHz, 24 cores (R840) 2x Intel(R) Xeon(R) Gold 6248 CPU @ 2.50GHz, 20 cores (C6420) |
Memory | 24 x 16GB DDR4 2933MT/s DIMMs - 384GB (R840) 12 x 16GB DDR4 2933MT/s DIMMs – 192 GB (C6420) |
Operating System | 4.18.0-193.el8.x86_64 |
Kernel version | Red Hat Enterprise Linux release 8.2 (Ootpa) |
InfiniBand Adapter | 1x ConnectX-6 single port HDR100 adapter |
OFED version | 5.0-2.1.8.0 |
Sequential Reads and Writes N-N
The IOzone benchmark was used in the sequential read and write mode to evaluate sequential reads and writes. These tests were conducted using multiple thread counts starting at 1 thread and up to 1024 threads. At each thread count, an equal number of files were generated since this test works on one file per thread or the N-N case. The round robin algorithm was used to choose targets for file creation in a deterministic fashion.
For all the tests, aggregate file size was 8 TB and this was equally divided among the number of threads for any given test. The aggregate file size chosen was large enough to minimize the effects of caching from the servers as well as from BeeGFS clients.
IOzone was run in a combined mode of write then read (-i 0, -i 1) to allow it to coordinate the boundaries between the operations. For this test, we used a 1MiB record size for every run. The commands used for Sequential N-N tests are given below:
Sequential Writes and Reads: iozone -i 0 -i 1 -c -e -w -r 1m -I -s $Size -t $Thread -+n -+m /path/to/threadlist
OS caches were also dropped or cleaned on the client nodes between iterations as well as between write and read tests by running the command:
# sync && echo 3 > /proc/sys/vm/drop_caches
The default stripe count for BeeGFS is 4. However, the chunk size and the number of targets per file can be configured on a per-directory basis. For all these tests, BeeGFS stripe size was chosen to be 2MB and stripe count was chosen to be 3 since we have three targets per NUMA zone as shown below:
# beegfs-ctl --getentryinfo --mount=/mnt/beegfs /mnt/beegfs/benchmark --verbose
Entry type: directory
EntryID: 0-5F6417B3-1
ParentID: root
Metadata node: storage1-numa0-2 [ID: 2]
Stripe pattern details:
+ Type: RAID0
+ Chunksize: 2M
+ Number of storage targets: desired: 3
+ Storage Pool: 1 (Default)
Inode hash path: 33/57/0-5F6417B3-1
The testing methodology and the tuning parameters used were similar to those previously described in the EDR based solution. For additional details in this regard, please refer to the whitepaper on the BeeGFS High Performance Solution.
Note:
The number of clients used for the performance characterization of the EDR based solution is 32 whereas the number of clients used for the performance characterization of the HDR100 based solution is 16 only. In the performance charts given below, this is indicated by including 16c which denotes 16clients and 32c which denotes 32 clients. The dotted lines show the performance of the EDR based solution and the solid lines shows the performance of the HDR100 based solution.
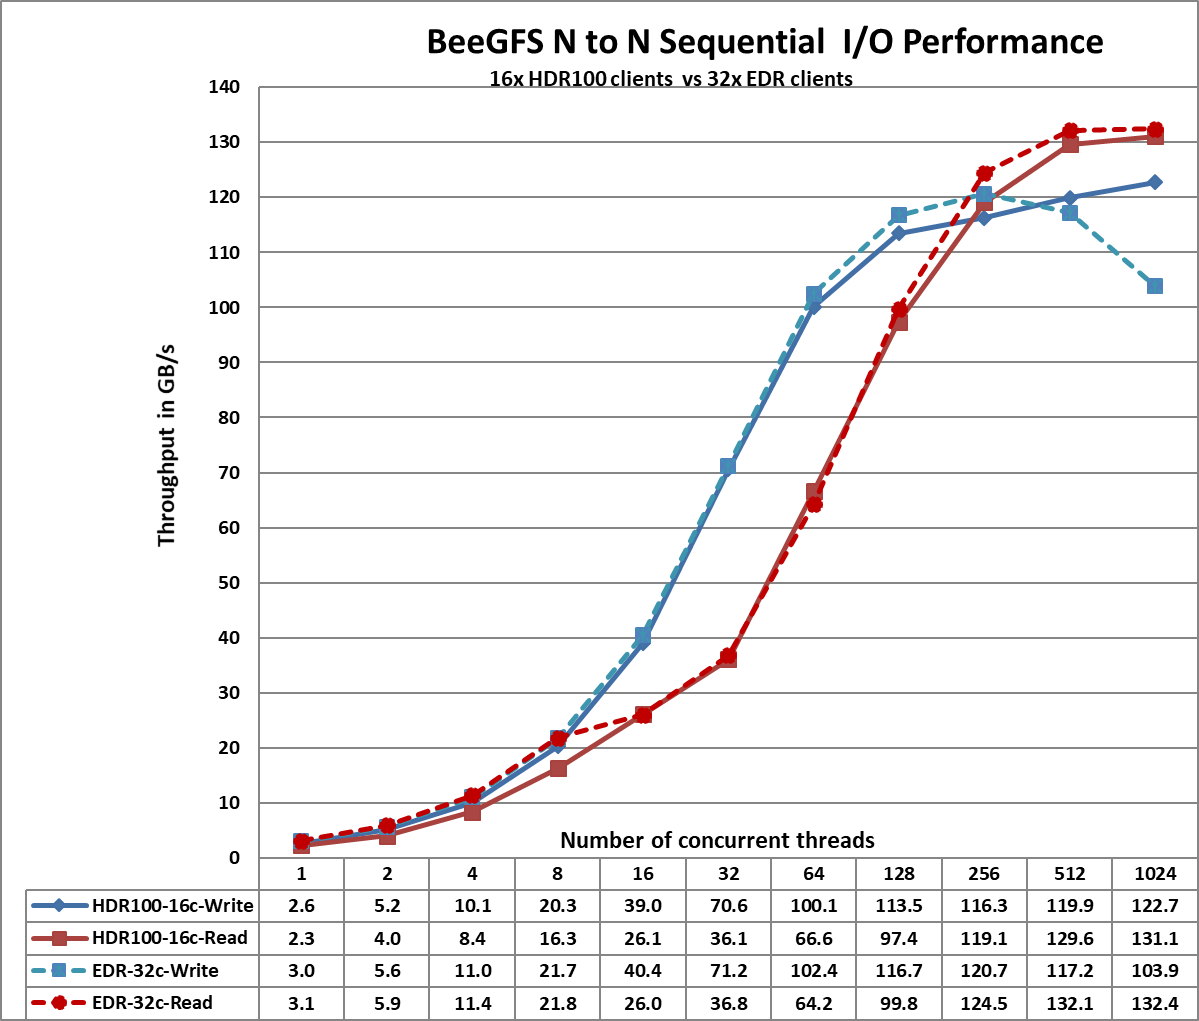
Figure 2. Sequential IOzone 8 TB aggregate file size
From Figure 2, we observe that the HDR100 peak read performance is ~131 GB/s and peak write is ~123 GB/s at 1024 threads. Each drive can provide 3.2 GB/s peak read performance and 3.0 GB/s peak write performance, which allows a theoretical peak of 460.8 GB/s for reads and 432 GB/s for the solution. However, in this solution, the network is the limiting factor. In the setup, we have a total of 11 InfiniBand HDR100 links for the storage servers. Each link can provide a theoretical peak performance of 12.4 GB/s which allows an aggregate theoretical peak performance of 136.4 GB/s. The achieved peak read and write performance are 96% and 90% respectively of the theoretical peak performance.
We observe that the peak read performance for the HDR100 based solution is slightly lower than that observed with the EDR based solution. This can be attributed to the fact that the benchmark tests were carried out using 16 clients for the HDR100 based setup while the EDR based solution used 32 clients. The improved write performance with HDR100 is due to the fact that the P4600 NVMe SSD used in the EDR based solution could provide only 1.3 GB/s for sequential writes whereas the P4610 NVMe SSD provides 3.0 GB/s peak write performance.
We also observe that the read performance is lower than writes for thread counts from 16 to 128. This is because a PCIe read operation is a Non-Posted Operation, requiring both a request and a completion, whereas a PCIe write operation is a Posted Operation that consists of a request only. A PCIe write operation is a fire and forget operation, wherein once the Transaction Layer Packet is handed over to the Data Link Layer, the operation completes.
Read throughput is typically lower than the write throughput because reads require two transactions instead of a single write for the same amount of data. The PCI Express uses a split transaction model for reads. The read transaction includes the following steps:
- The requester sends a Memory Read Request (MRR).
- The completer sends out the acknowledgement to MRR.
- The completer returns a Completion with Data.
The read throughput depends on the delay between the time the read request is issued and the time the completer takes to return the data. However, when the application issues enough number of read requests to offset this delay, then throughput is maximized. A lower throughput is measured when the requester waits for completion before issuing subsequent requests. A higher throughput is registered when multiple requests are issued to amortize the delay after the first data returns. This explains why the read performance is less than that of the writes from 16 threads to 128 threads and then an increased throughput is observed for higher thread counts of 256, 512 and 1024.
More details regarding the PCI Express Direct Memory Access is available at https://www.intel.com/content/www/us/en/programmable/documentation/nik1412547570040.html#nik1412547565760
Random Reads and Writes N-N
IOzone was used in the random mode to evaluate random IO performance. Tests were conducted with thread counts starting from 8 threads to up to 1024 threads. Direct IO option (-I) was used to run IOzone so that all operations bypass the buffer cache and go directly to the disk. BeeGFS stripe count of 3 and chunk size of 2MB was used. A 4KiB request size was used on IOzone and performance measured in I/O operations per second (IOPS). An aggregate file size of 8 TB was selected to minimize the effects of caching. The aggregate file size was equally divided among the number of threads within any given test. The OS caches were dropped between the runs on the BeeGFS servers as well as BeeGFS clients.
The command used for random reads and writes is given below:
iozone -i 2 -w -c -O -I -r 4K -s $Size -t $Thread -+n -+m /path/to/threadlist
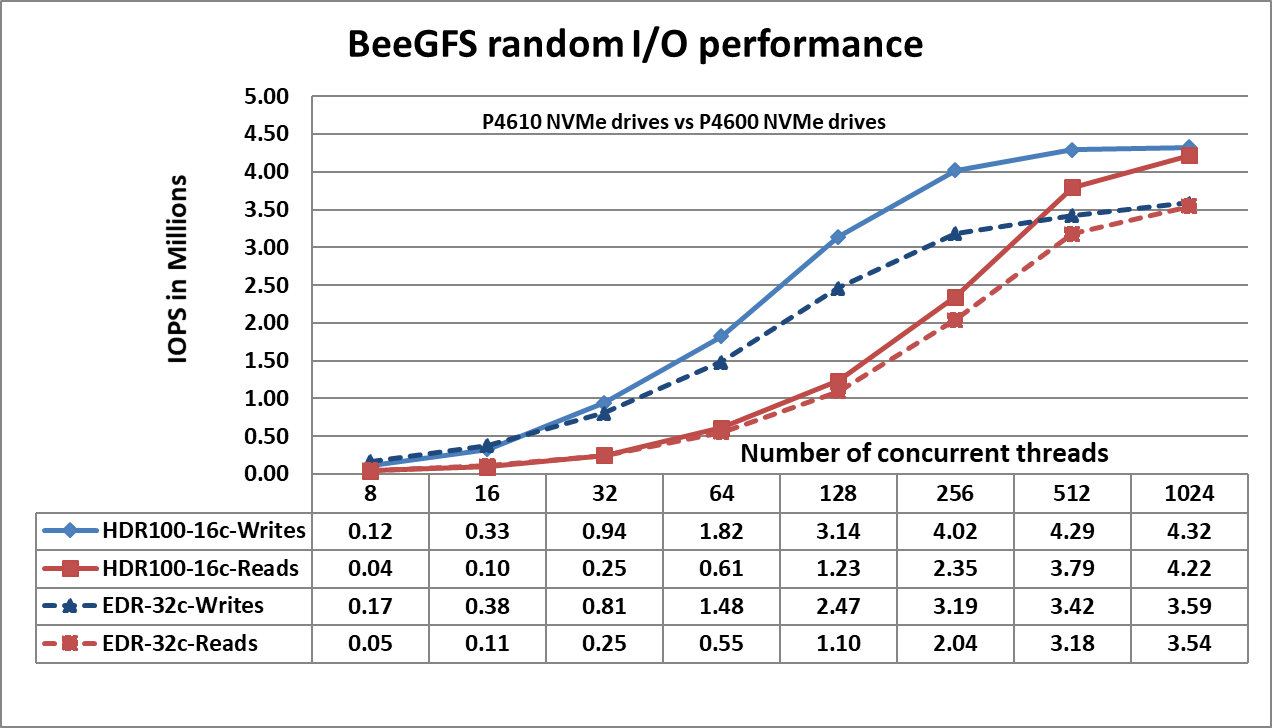
Figure 3. N-N Random Performance
Figure 3 shows that the random writes peak at ~4.3 Million IOPS at 1024 threads and the random reads peak at ~4.2 Million IOPS at 1024 threads. Both the write and read performance show a higher performance when there are a greater number of IO requests. This is because NVMe standard supports up to 64K I/O queue and up to 64K commands per queue. This large pool of NVMe queues provide higher levels of I/O parallelism and hence we observe IOPS exceeding 3 Million. The following table provides a comparison of the random IO performance of the P4610 and P4600 NVMe SSDs to better understand the observed results.
Table 6. Performance Specification of Intel NVMe SSDs
Product | P4610 3.2 TB NVMe SSD | P4600 1.6 TB NVMe SSD |
Random Read (100% Span) | 638000 IOPS | 559550 IOPS |
Random Write (100% Span) | 222000 IOPS | 176500 IOPS |
Metadata Tests
The metadata performance was measured with MDtest and OpenMPI to run the benchmark over the 16 clients. The benchmark was used to measure file creates, stats, and removals performance of the solution. Since performance results can be affected by the total number of IOPs, the number of files per directory and
the number of threads, a consistent number of files across tests was chosen to allow comparison. The total number of files was chosen to be ~ 2M in powers of two (2^21 = 2097152). The number of files per
directory was fixed at 1024, and the number of directories varied as the number of threads changed. The test methodology, and directories created are similar to that described in the previous blog.
The following command was used to execute the benchmark:
mpirun -machinefile $hostlist --map-by node -np $threads ~/bin/mdtest -i 3 -b
$Directories -z 1 -L -I 1024 -y -u -t -F
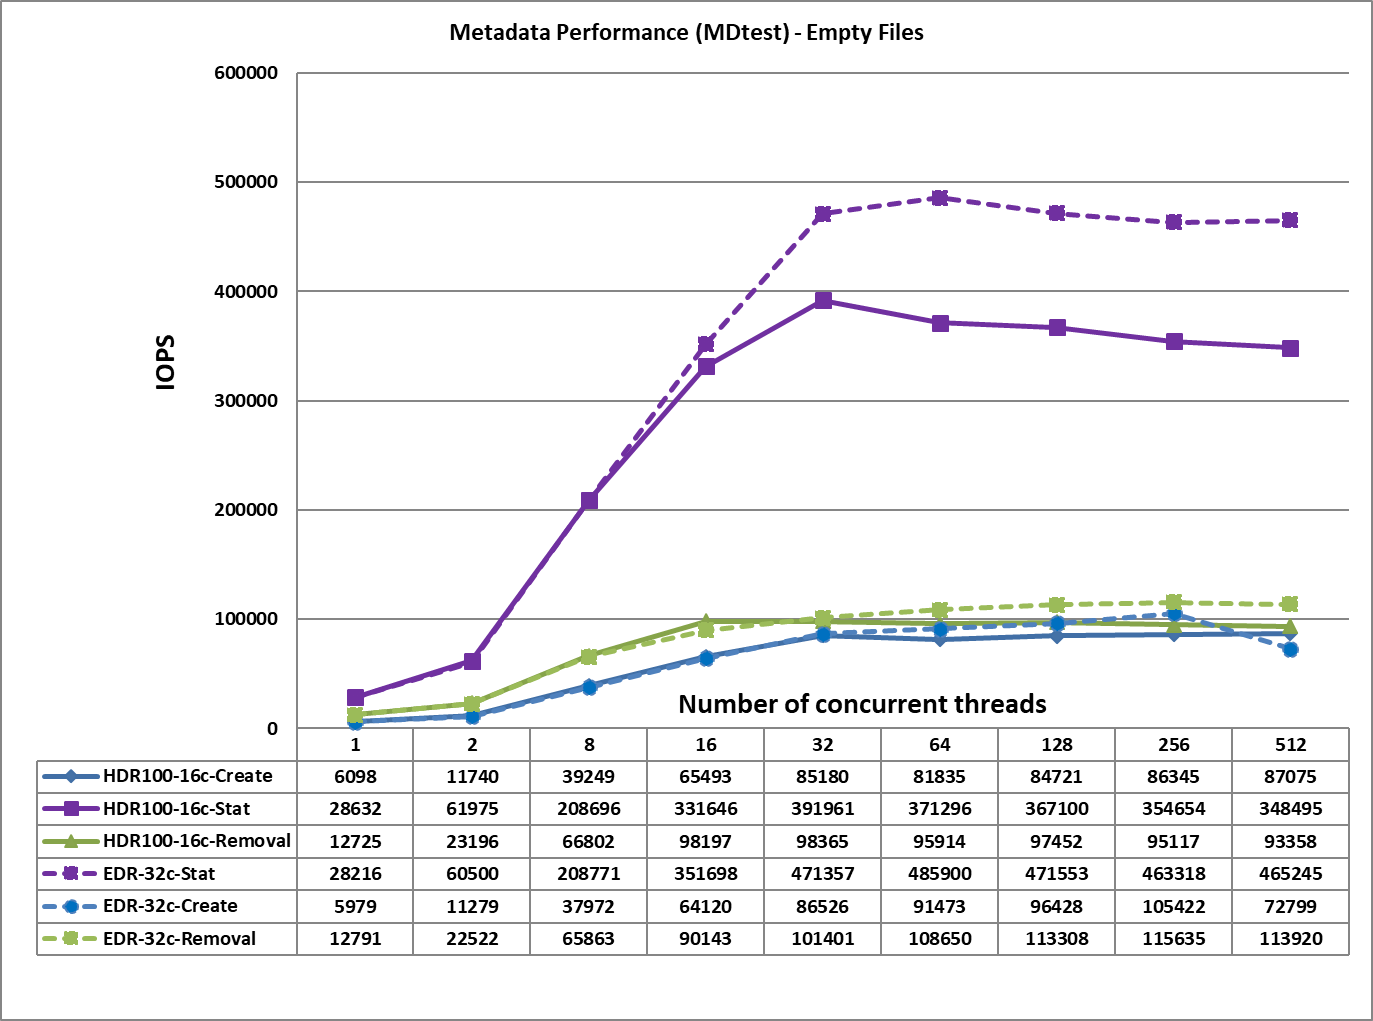
Figure 4. Metadata Performance – Empty Files
From Figure 4, we observe that the create, removal and read performance are comparable to those received for the EDR based solution whereas the Stat performance is lower by ~100K IOPS. This may be because the HDR100 based solution uses only 16 clients for performance characterization whereas the EDR based solution used 32 clients. The file create operations reach their peak value at 512 threads at ~87K op/s. The removal and stat operations attained the maximum value at 32 threads with ~98K op/s, and 392 op/s respectively.
Conclusion
This blog presents the performance characteristics of the Dell EMC High Performance BeeGFS Storage Solution with the latest software and hardware. At the software level, high-performance solution has now been updated with
- CentOS 8.2.2004 as the base OS
- BeeGFS v7.2
- Mellanox OFED version 5.0-2.1.8.0.
At the hardware level, the solution uses
- ConnectX-6 Single Port HDR100 adapters
- Intel P4610 3.2 TB Mixed use, NVMe drives and
- Quantum switch QM8790 with 80x HDR100 100 Gb/s ports.
The performance analysis allows us to conclude that:
- IOzone sequential read and write performance is similar to that of the EDR based solution because network is the bottleneck here.
- The IOzone random read and write performance is greater than the previous EDR based solution by ~ 1M IOPS because of the use of P4610 NVMe drives which provide improved random write and read performance.
- The file create and removal performance is similar to that of the EDR based solution.
- The file stat performance registers a 19% drop because of the use of only 16 clients in the current solution as compared to the 32 clients used in the previous EDR based solution.
References
Dell EMC Ready Solutions for HPC BeeGFS Storage - Technical White Paper
Features of Dell EMC Ready Solutions for HPC BeeGFS Storage
Scalability of Dell EMC Ready Solutions for HPC BeeGFS Storage
Dell EMC Ready Solutions for HPC BeeGFS High Performance Storage
Related Blog Posts

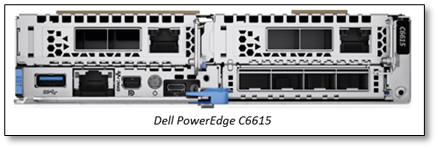
The Dell PowerEdge C6615: Maximizing Value and Minimizing TCO for Dense Compute and Scale-out Workloads
Mon, 02 Oct 2023 21:35:01 -0000
|Read Time: 0 minutes
In the ever-evolving landscape of data centers and IT infrastructure, meeting the demands of scale-out workloads is a continuous challenge. Organizations seek solutions that not only provide superior performance but also optimize Total Cost of Ownership (TCO).
Enter the new Dell PowerEdge C6615, a modular node designed to address these challenges with innovative solutions. Let's delve into the key features and benefits of this groundbreaking addition to the Dell PowerEdge portfolio.
Industry challenges
- Maximizing Rack utilization: One of the primary challenges in the data center world is maximizing rack utilization. The Dell PowerEdge C6615 addresses this by offering dense compute options.
- Cutting-edge processors: High-performance processors are crucial for scalability and security. The C6615 is powered by a 4th Generation AMD EPYC 8004 series processor, ensuring top-tier performance.
- Total Cost of Ownership (TCO): TCO is a critical consideration that encompasses power and cooling efficiency, licensing costs, and seamless integration with existing data center infrastructure. The C6615 is designed to reduce TCO significantly.
Introducing the Dell PowerEdge C6615
The Dell PowerEdge C6615 is a modular node designed to revolutionize data center infrastructure. Here are some key highlights:
 Price-performance ratio: The C6615 offers outstanding price per watt for scale-out workloads, with up to a 315% improvement compared to a one-socket (1S) server with AMD EPYC 9004 Series server processor.
- Optimized thermal solution: It features an optimized thermal solution that allows for air-cooling configurations with up to 53% improved cooling performance compared to the previous generation chassis.
- Density-optimized compute: The C6615's architecture is tailored for scale-out WebTech workloads, offering exceptional performance with reduced TCO.
- High-speed NVMe storage: It provides high-speed NVMe storage for applications with intensive IOPS requirements, ensuring efficient performance.
- Efficient scalability: With 40% more cores per rack compared to the AMD EPYC 9004 Series server processors, the C6615 allows for quicker and more efficient scalability.
- SmartNIC: It includes a SmartNIC with hardware-accelerated networking and storage, saving CPU cycles and enhancing security.
Key features
To maximize efficiency and reduce environmental impact, the PowerEdge C6615 incorporates several key features:
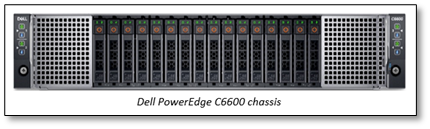 Power and thermal efficiency: The 2U chassis with four nodes enhances power and thermal efficiency, eliminating the need for liquid cooling.
- Flexible I/O options: It supports up to two PCIe Gen5 slots and one 16 PCIe Gen5 OCP 3.0 slot for network cards, ensuring versatile connectivity.
- Security: Security is integrated at every phase of the PowerEdge lifecycle, from supply chain protection to Multi-Factor Authentication (MFA) and role-based access controls.
Accelerating performance
In benchmark testing, the C6615 outperforms the competition:
- HPL Benchmark: It showcases up to a 335% improvement in performance per watt per dollar and a 210% increase in performance per CPU dollar compared to other 1S systems with the AMD EPYC 9004 Series server processor.
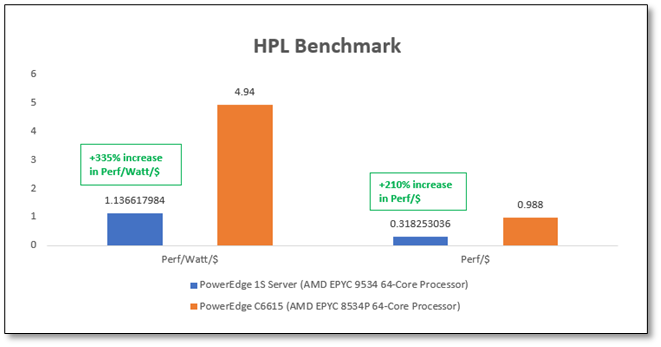
Figure 1. HPL benchmark performance
- SPEC_CPU2017 Benchmark: Results demonstrate up to a 205% improvement in performance per watt per dollar and a remarkable 128% increase in performance per CPU dollar compared to similar systems.
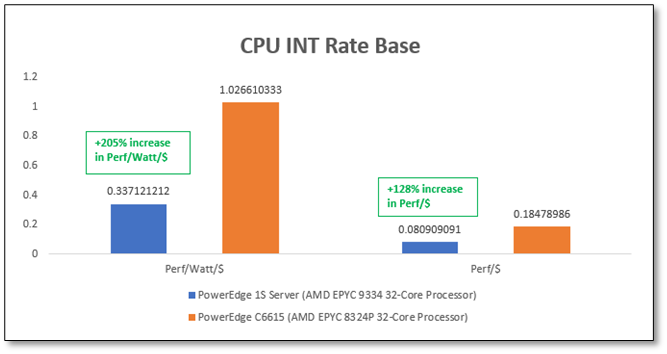
Figure 2. SPEC_CPU2017 benchmark performance
Final thoughts
The seamless integration of the Dell PowerEdge C6615 into existing processes and toolsets is facilitated by comprehensive iDRAC9 support for all components. This ensures a smooth transition while leveraging the full potential of your server infrastructure.
Dell's commitment to environmental sustainability is evident in its use of recycled materials and energy-efficient options, helping to reduce carbon footprints and operational costs.
In conclusion, the Dell PowerEdge C6615 emerges as a leading dense compute solution, delivering exceptional value and unmatched performance. For more information, visit the PowerEdge Servers Powered by AMD site and explore how this innovative solution can transform your data center operations.
Note: Performance results may vary based on specific configurations and workloads. It's recommended to consult with Dell or an authorized partner for tailored solutions.
Author: David Dam

How Dell PowerEdge XE9680 Accelerates AI and High Performance Computing
Tue, 11 Apr 2023 21:37:45 -0000
|Read Time: 0 minutes
The Dell PowerEdge XE9680 is a high-performance server designed to deliver exceptional performance for machine learning workloads, AI inferencing, and high-performance computing. In this short blog, we summarize three articles that showcase the capabilities of the Dell PowerEdge XE9680 in different computing scenarios.
Unlocking Machine Learning with Dell PowerEdge XE9680
The first article, which I co-wrote with Liz Raymond, Naye Yoni, and Frank Han, describes how Dell PowerEdge XE9680 can unlock machine learning performance by delivering high-speed processing and efficient training of machine learning models. Based on our testing, we concluded that Dell PowerEdge XE9680 can help organizations unlock the full potential of their machine learning workloads:
Unlocking Machine Learning with Dell PowerEdge XE9680: Insights into MLPerf 2.1 Training Performance
Accelerating AI Inferencing with Dell PowerEdge XE9680
The second article, also co-written with Liz Raymond, Naye Yoni, and Frank Han, focuses on how the Dell PowerEdge XE9680 can accelerate AI inferencing using various models to make predictions or decisions. Our testing found that the Dell PowerEdge XE9680 can help organizations achieve faster and more accurate AI inferencing:
Accelerating AI Inferencing with Dell PowerEdge XE9680: A Performance Analysis
Accelerating High Performance Computing with Dell PowerEdge XE9680
The third article, co-written with Frank Han, showcases how Dell PowerEdge XE9680 can accelerate high-performance computing (HPC) by leveraging parallel processing techniques to solve complex problems. It focuses on the system's impressive performance in the HPL benchmark, which measures HPC performance. We concluded that the Dell PowerEdge XE9680 can help organizations achieve faster and more efficient HPC performance, enabling them to solve complex problems in less time:
Accelerating High-Performance Computing with Dell PowerEdge XE9680: A Look at HPL Performance
Author: Delmar Hernandez, Server Technologist