


GROMACS — with Ice Lake on Dell EMC PowerEdge Servers
3rd Generation Intel Xeon® Scalable processors (architecture code named Ice Lake) is Intel’s successor to Cascade Lake. New features include up to 40 cores per processor, eight memory channels with support for 3200 MT/s memory speed and PCIe Gen4.
The HPC and AI Innovation Lab at Dell EMC had access to a few systems and this blog presents the results of our initial benchmarking study on a popular open-source molecular dynamics application – GROningen MAchine for Chemical Simulations (GROMACS).
Molecular dynamics (MD) simulations are a popular technique for studying the atomistic behavior of any molecular system. It performs the analysis of the trajectories of atoms and molecules where the dynamics of the system progresses over time.
At HPC and AI Innovation Lab, we have conducted research on the SARS-COV-2 study where applications like GROMACS helped researchers identify molecules that bind to the spike protein of the virus and block it from infecting human cells. Other use cases of MD simulation in medicinal biology is iterative drug design through prediction of protein-ligand docking (in this case usually modelling a drug to target protein interaction).
Overview of GROMACS
GROMACS is a versatile package to perform MD simulations, such as simulate the Newtonian equations of motion for systems with hundreds to millions of particles. GROMACS can be run on CPUs and GPUs in single-node and multi-node (cluster) configurations. It is a free, open-source software released under the GNU General Public License (GPL). Check out this page for more details on GROMACS.
Hardware and software configurations
Table 1: Hardware and Software testbed details
Component | Dell EMC PowerEdge R750 server | Dell EMC PowerEdge R750 server | Dell EMC PowerEdge C6520 server | Dell EMC PowerEdge C6520 server | Dell EMC PowerEdge C6420 server | Dell EMC PowerEdge C6420 server |
SKU | Xeon 8380 | Xeon 8358 | Xeon 8352Y | Xeon 6330 | Xeon 8280 | Xeon 6252 |
Cores/Socket | 40 | 32 | 32 | 28 | 28 | 24 |
Base Frequency | 2.30 GHz | 2.60 GHz | 2.20 GHz | 2.00 GHz | 2.70 GHz | 2.10 – GHz |
TDP | 270 W | 250 W | 205 W | 205 W | 205 W | 150 W |
L3Cache | 60M | 48M | 48M | 42M | 38.5M | 37.75M |
Operating System | Red Hat Enterprise Linux 8.3 4.18.0-240.22.1.el8_3.x86_64 | |||||
Memory | 16 GB x 16 (2Rx8) 3200 MT/s | 16 GB x 12 (2Rx8) 2933 MT/s | ||||
BIOS/CPLD | 1.1.2/1.0.1 | |||||
Interconnect | NVIDIA Mellanox HDR | NVIDIA Mellanox HDR100 | ||||
Compiler | Intel parallel studio 2020 (update 4) | |||||
GROMACS | 2021.1 | |||||
Datasets used for performance analysis
Table 2: Description of datasets used for performance analysis
Datasets/Download Link | Description | Electrostatics | Atoms | System Size |
Movement of Water This example is to simulate- the motion process of many water molecules in each space and temperature.
| Particle Mesh Ewald (PME)
| 1536K | small | |
3072K | Large | |||
This example is to simulate- 1.4M atom system - A Pair of hEGFR Dimers of 1IVO and 1IVO 3M atom system – A Pair of hEGFR tetramers of 1IVO and 1IVO
| Particle Mesh Ewald (PME)
| 1.5M | Small | |
3M | Large | |||
Prace – Lignocellulose | This example is to simulate the lignocellulose – the tpr was obtained from PRACE website
| Reaction Field (rf)
| 3M | Large |
Compilation Details
We compiled GROMACS from source (version-2021.1) using the Intel 2020 Update 5 Compiler to take advantage of AVX2 and AVX512 optimizations, and the Intel MKL FFT library. The new version of GROMACS has a significant performance gain due to the improvements in its parallelization algorithms. The GROMACS build system and the gmx mdrun tool have built-in and configurable intelligence that detects your hardware and make effective use of it.
Objective of Benchmarking
Our objective is to quantify the performance of GROMACS using different test cases, like performance evaluation on different Ice Lake processors as listed in Table 1, then we compare the 2nd and 3rd Gen Xeon Scalable (Cascade Lake vs Ice Lake), and finally we compare multi-node scalability with hyper threading enabled and disabled.
To evaluate the datasets results with an appropriate metric, we added associated high-level compiler flags, electrostatic field load balancing (like PME, etc), tested with multiple ranks, separate PME ranks, varying different nstlist values, and created a paradigm for our application (GROMACS).
The typical time scales of the simulated system are in the order of micro-seconds (µs) or nanoseconds (ns). We measure the performance for the dataset’s simulation as nanoseconds per day (ns/day).
Performance Analyses on Single Node
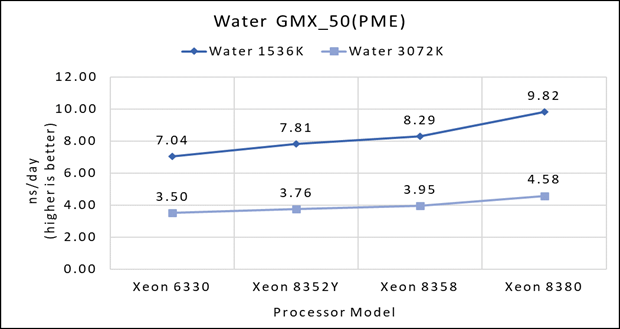
Figure 1(a): Single node performance of Water 1536K and Water 3072K on Ice Lake processor model
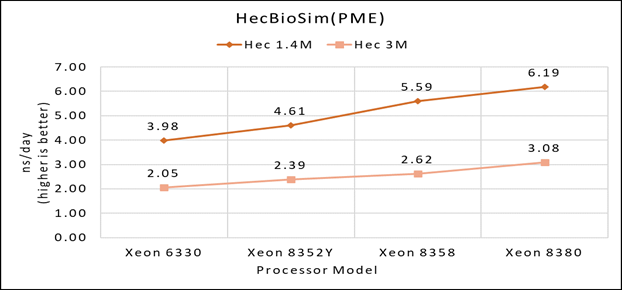 Figure 1(b): Single node performance of Lignocellulose 3M on Ice Lake processor model
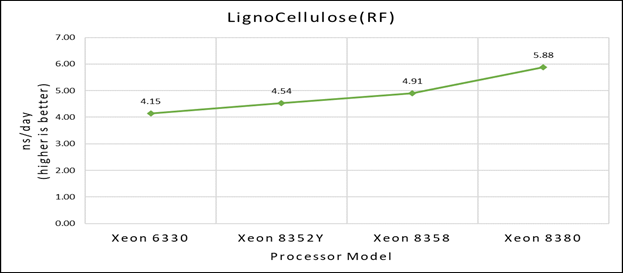 Figure 1(c): Single node performance of HecBioSim 1.4M and HecBioSim 3M on Ice Lake processor model
Figure 1 (a), (b) and (c) shows are the single node performance analyses for three datasets mentioned in Table 2 with the four processor models available for evaluation of GROMACS.
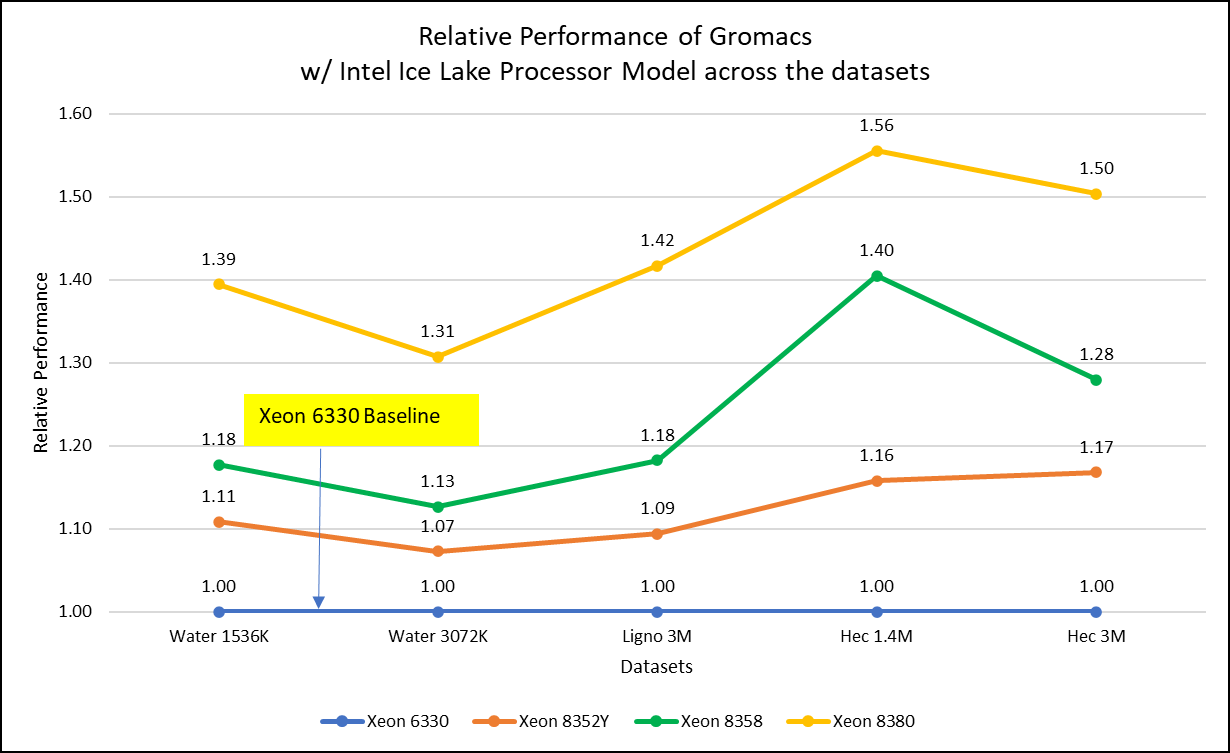
Figure 2: Relative Performance of GROMACS across the datasets with Intel Ice Lake Processor Model
For ease of comparison across the various datasets, the relative performance of the processor model has been included into a single graph. However, it is worth noting that each dataset behaves individually when performance is considered, as each uses different molecular topology input files (tpr), and configuration files.
Individual dataset performance is mentioned in Figures 1(a), 1(b), and 1(c) respectively.
Figure 2 shows increase in the core count in the processor model increases the performance, based on the dataset used. In here, we observe that smaller (water 1536K and HecBioSim 1400K) has more advantage 5 to 6 percent performance gain in counterpart to the larger datasets (water 3072, HecBioSim 3M, and Ligno 3M).
Next, by comparing the relative numbers to the baseline processor Xeon 6330(28C) with Xeon 8380(40C), we found a 30 to 50 percent performance gain according to the datasets with increases in cores, from 28 to 40. A fraction of gain is by frequency of the processor model.
Performance Analyses on Cascade Lake vs Ice Lake
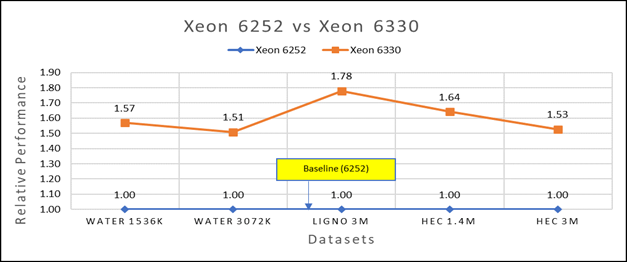
Figure 3(a): Performance of GROMACS on Cascade Lake (Xeon 6252) vs Ice Lake (Xeon 6330)
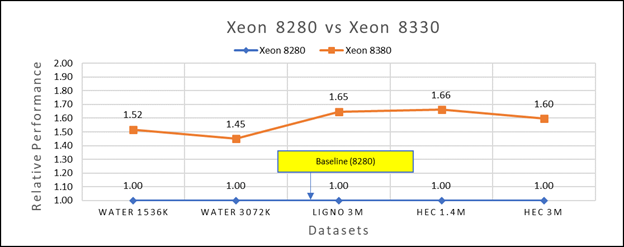
Figure 3(b): Performance of GROMACS on Cascade Lake (Xeon 8280) vs Ice Lake (Xeon 8380)
We accounted for the fact that the memory is rightly fit according to the datasets. To begin, we compared each processor with previous generation processors. For performance benchmark comparisons, we selected Cascade Lake closest to their Ice Lake counterparts in terms of hardware features such as cache size, TDP values, and Processor Base/Turbo Frequency, and marked the maximum value attained for Ns/day by each of the datasets mentioned in Table 2.
Figure 3a shows Ice Lake 6330 is up to 50 to 75 percent faster than the 6252. The Xeon 6330 has 16 percent more cores and 9 percent faster memory bandwidth. Figure 3b shows that Ice Lake 8380 is up to 50-65 percent faster than the Xeon 8280 on single node tests, this is in line with the 42 percent more cores and 9 percent faster memory bandwidth.
This result is due to a higher processor speed, wherein more data can be accessed by each core. Also, datasets are more memory intensive and some percentage is added on due frequency improvement Overall, the Ice Lake processor results demonstrated a substantial performance improvement for GROMACS over Cascade Lake processors.
Performance Analysis on Multi-Node
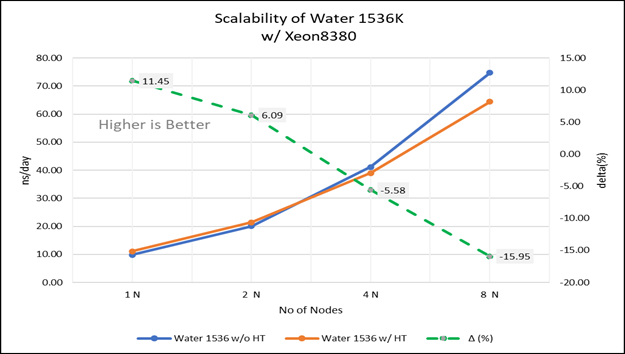 Figure 4(a): Scalability of water 1536K with hyper threading disabled(80C) vs hyperthreading enabled (160C) w/ Xeon 8380; the dotted line represent the delta between hyperthreading enabled vs hyperthreading disabled
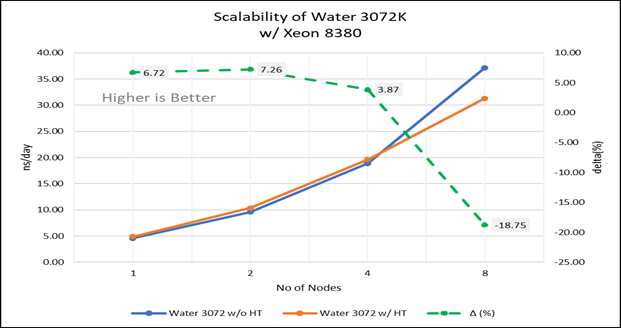 Figure 4(b): Scalability of water 3072K with hyper threading disabled(80C) vs hyperthreading enabled (160C) w/INTEL 8380; the dotted line represent the delta between hyperthreading enabled vs hyperthreading disabled
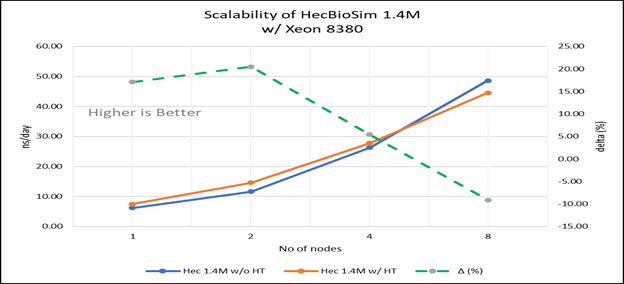 Figure 4(c): Scalability of HecBioSim 1.4M with hyper threading disabled(80C) vs hyperthreading enabled (160C) w/ Xeon 8380; the dotted line represent the delta between hyperthreading enabled vs hyperthreading disabled
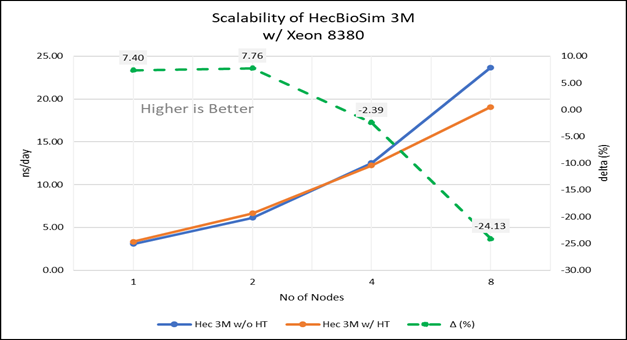 Figure 4(d): Scalability of HecBioSim 3M with hyper threading disabled(80C) vs hyperthreading enabled (160C) w/ Xeon 8380; the dotted line represent the delta between hyperthreading enabled vs hyperthreading disabled
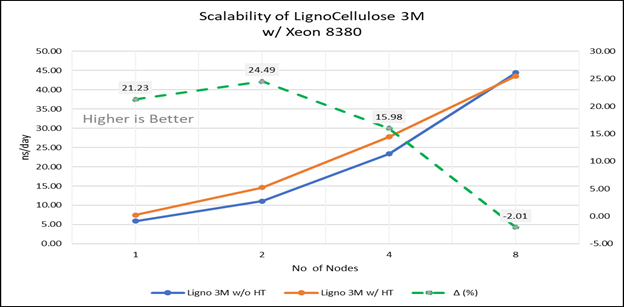 Figure 4(e): Scalability of Lignocellulose 3M with hyper threading disabled(80C) vs hyperthreading enabled (160C) w/INTEL 8380 ; the dotted line represent the delta between hyperthreading enabled vs hyperthreading disabled
For multi-node tests, the test bed was configured with an NVIDIA Mellanox HDR interconnect running at 200 Gbps and each server having the Ice Lake processor. We were able to achieve the expected linear performance scalability for GROMACS of up to eight nodes with hyper threading disabled and approximately 7.25X with hyper threading enabled for eight nodes, across the datasets. All cores in each server were used while running these benchmarks. The performance increases are close to linear across all the dataset types as the core count increases.
Conclusion
The Ice Lake processor-based Dell EMC Power Edge servers, with notable hardware feature upgrades over Cascade Lake, show up to 50 to 60 percent performance gain for all the datasets used for benchmarking GROMACS. Hyper threading should be disabled for the benchmarks addressed in this blog for getting better scalability above eight nodes. For small datasets mentioned in this blog benefits 5 to 6 percent in comparison to the larger ones with increase in the core count.
Watch our blog site for updates!