
Third-party Analysis

PowerEdge R7625 Rack Server & Emulex: Dell R7625 and 64GFC Combine to Accelerate Oracle Analytics Workloads
Fri, 29 Mar 2024 16:37:17 -0000
|Read Time: 0 minutes
Dell PowerEdge R7625 Rack Server & Emulex LPe36002 Host Bus Adapter
Dell R7625 and 64GFC Combine to Accelerate Oracle Analytics Workloads
Tolly Report #224106
Tolly test report demonstrating that Dell PowerEdge R7625 Rack Server outfitted with the Emulex LPe36002 64G Fibre Channel Host Bus Adapter can improve application performance up to 4x vs older generation 32/16G FC technologies.
Executive Summary
New generation technology can be expected to improve performance. There are times, however, when multiple technology advances can combine to provide an outsized advantage. Such is the case when the Dell PowerEdge R7625 Rack Server with AMD EPYC processors is combined with the Broadcom Emulex LPe36002 64G Fibre Channel Host Bus Adapter.
Dell commissioned Tolly to benchmark the analytics workload performance of the Broadcom Emulex LPe36002 64G Fibre Channel dual-port host bus adapter (HBA) running in the Dell PowerEdge R7625 Rack Server. Specifically, this report will focus on illustrating two points: 1) Improved database analytic performance due to the increased input/output (I/O) throughput of 64GFC, 2) Increased application performance when paired with PCIe 4.0/5.0 and the dual-port 64GFC HBA.
Tests showed that the new R7625 AMD EPYC platform's increased CPU power and PCIe 5.0 bus work in conjunction with the Broadcom 64GFC dual-port adapter to deliver line rate, 64G throughput that cannot be matched by earlier generation technology. See Figure 1.
The Bottom Line | |
Dell PowerEdge R7625 AMD EPYC processors & Emulex LPe36002 64G HBA benefits over older generation 16/32GFC PCIe 3.0 HBAs: | |
1 | R7625 with 64GFC HBA can achieve 4x the database analytics throughput of the16GFC HBA and 2x the throughput of the 32GFC HBA |
2 | 42% improvement in complex database ad hoc query processing time when running the dual-port 64GFC HBA on the PCIe 5.0-based R7625 server compared to the older generation R740 server |
Overview
The goal of these tests, as noted, was to illustrate, simply, that deploying a Dell PowerEdge R7625 Rack Server, powered by AMD EPYC processors, with the Emulex 64G Fibre Channel HBA can improve database analytic performance by providing double and quadruple the I/O throughput of the two prior generation HBAs respectively. Similarly, the tests were used to illustrate the key role of the newer-generation PCIe 5.0 server bus and PCIe 4.0 dual-port 64GFC HBA in increasing server I/O throughput.
All benchmarking was done using the open source TPROC-H analytics workload of HammerDB. The tests were run using the Oracle 19c database environment but the results are generally applicable to any database or other input/output intensive workload.
The TPROC-H workload measures how long it takes to run a series of 22 different types of decision support queries. This type of workload is “read only” with no database updates taking place. The Linux iostat utility was used to measure storage I/O throughput.
Test Background & Results
64GFC vs 16/32GFC
This test was run three times with the only variable being the link speed between the server’s FC HBA and the switch.
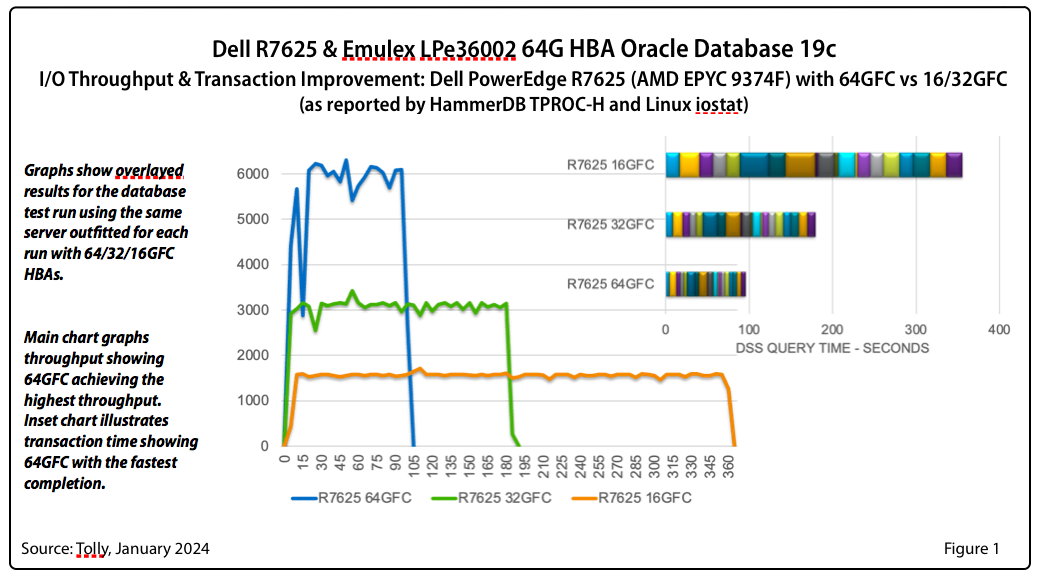
Figure 1 (main and inset), on the previous page, summarizes all three tests using two metrics: storage I/O throughput and query execution time as reported by the HammerDB database benchmark. What is important to note are the relative results across the three scenarios. The 16GFC HBA is clearly a bottleneck (blue dots) taking the longest to complete and delivering the lowest throughput. (Note: multiple colors in the inset bar chart represent the different transaction types used in the TPROC-H benchmark.)
Performance is improved, roughly by 2x, when the HBA is configured for 32GFC (gray dots) but, as will be seen, 32GFC still presented a transaction bottleneck.
When run using the 64GFC the database storage IO throughput is the highest and the query execution time is the shortest. Again, performance is improved roughly by a factor of two over the 32GFC results.
64GFC Dual-Port HBA Performance
The Emulex LPe36002 64GFC HBA is a PCIe 4.0 interface card and is the recommended HBA for the Dell R7625 server with AMD EPYC processors. The card’s total performance capacity is restricted by the bandwidth limitations of older generation servers that utilize PCIe 3.0.
As in the prior test, the TPROC-H benchmark was run on an Oracle 19c database multiple times using the same card but in servers that implement two different PCIe generation architectures.
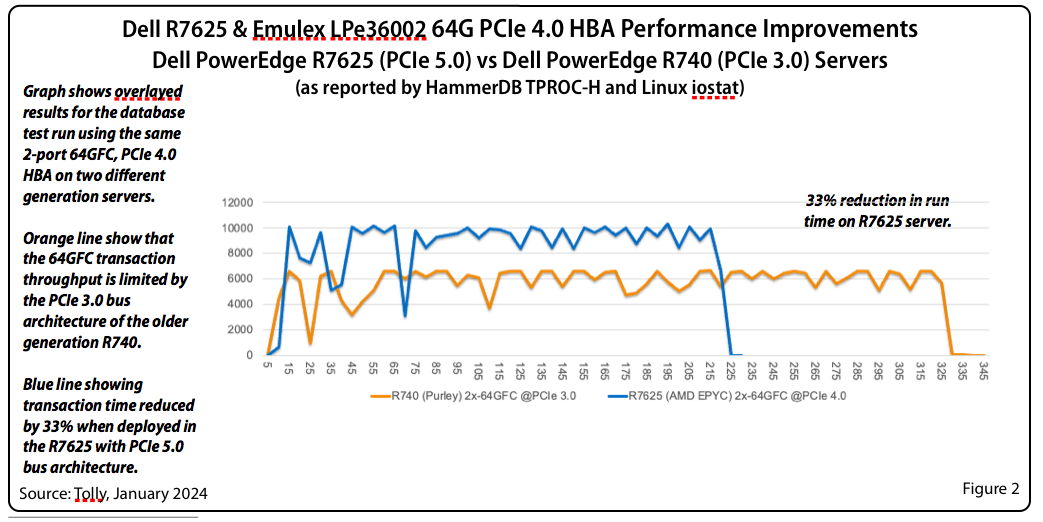
Figure 2, on the previous page, illustrates the how the same dual-port 64GFC HBA delivers dramatically higher throughput and shorter database query times when deployed in a current generation server that implements PCIe 5.0 bus architecture.
Taking the same dual-port 64GFC HBA and deploying it in a PCIe 5.0 R7625 server improved transaction time by 33% simply by removing the limitations imposed by the maximum bandwidth of the R740 PCIe 3.0 bus.
Test Setup & Methodology
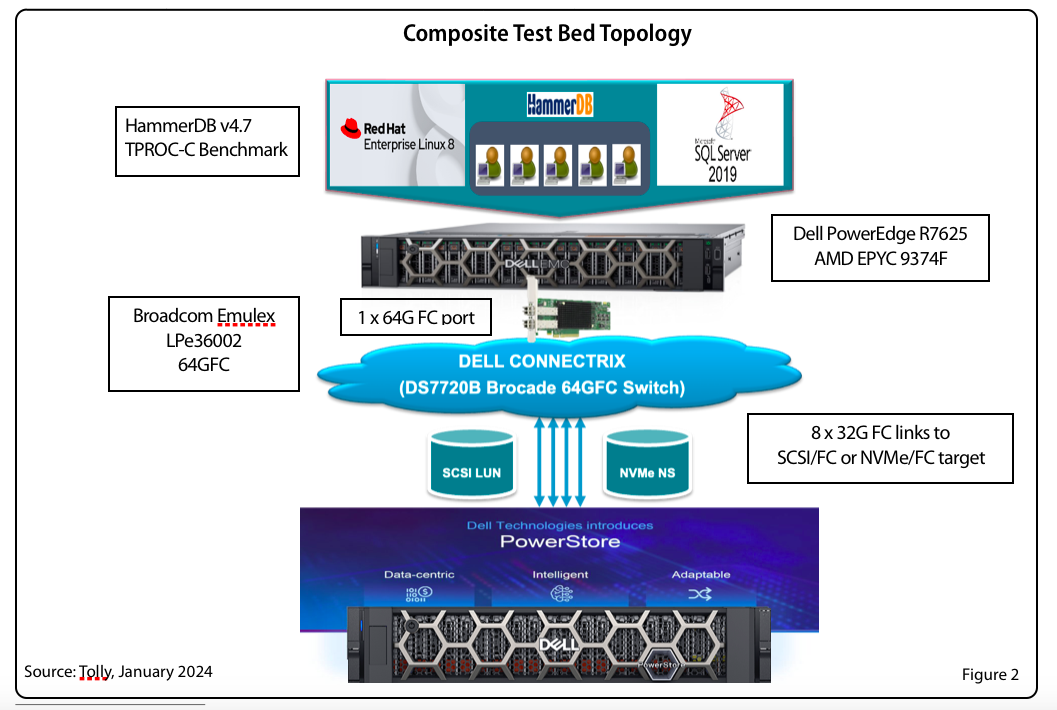
The HBA under test used current production drivers that are publicly available. Default settings were used. Details of the test environment and systems under test are found in Tables 1-6. Figure 3 shows a composite test environment.
Server systems were all VMware ESXi 8 hosts running ESXi-8.0U1. Storage volumes mapped to each VM were configured as thick provisioned, eagerly zeroed. PVSCSI controller was used.
Each VM was assigned 128GB of memory and 24 vCPUs. Each VM was running RHEL 8.9.
Details of the HammerDB tests are found in the “Overview” section above.
For the 16/32/64GFC comparisons the server’s HBA-to-switch connection was configured to each of the link speeds as required by each test scenario.
For the PCIe generation comparison test, the R7625 and R740 were not matched with respect to CPU and memory but as the test focused on I/O, the differences were acceptable.

Table 1. 64G HBA Under Test
Vendor | Product Name | Bus Architecture | Firmware | Driver |
Broadcom | Emulex LPe36002 | PCIe 4.0 | 14.0.539.26 | 14.0.0.21 |
Table 2. R7625 Server Configuration
Vendor/System | Dell PowerEdge R7625 |
CPU | 2 socket AMD EPYC 9374F 32-core processor @ 3.8 GHz |
Number of CPUs | 128 logical processors. Profile: Performance, Logical Processors: Enabled, Sub Numa Clustering: Disabled |
Memory (RAM) | 384 GB |
OS | Red Hat Ent. Linux 8.9 (RHEL8) |
Table 3. R740 Server Configuration
Vendor/System | Dell PowerEdge R740 |
CPU | 2 socket Intel(R) Xeon(R) Gold 6146 @ 3.2 GHz |
Number of CPUs | 24 |
Memory (RAM) | 128GB |
OS | Red Hat Ent. Linux 8.9 (RHEL8) |
Table 4. Database Test Tool
Vendor | Open Source |
Application | HammerDB 4.9 |
TPROC-H settings | Degree of parallelism = 80 Scale factor = 100 Virtual users = 1 |
Table 5. Storage Configuration
Vendor/Device | Dell PowerStore 9200T v3.5.0.0 |
Ports | 8 x 32G FC |
Volumes | 1200GB volume each for NVMe & SCSI |
Performance Policy | High |
Namespace/LUN | 8 |
Network Fabric | Dell Connectrix DS7720B 64GFC Switch v9.0.1a
|
Table 6. Oracle Database Configuration
Database | Oracle Database 19c (19.3) |
Storage Type | ASM Disk group external redundancy |
Dataset Size | 150GB |
Database Settings | SGA = 12 GB |
About AMD
For over 50 years, AMD has been at the forefront of driving innovation in high-performance computing, graphics, and visualization technologies. Their products are relied upon by billions of people, leading Fortune 500 businesses, and cutting-edge scientific research institutions worldwide. AMD's mission is to build exceptional products that accelerate next-generation computing experiences and power solutions for the world's most important challenges. Visit http://www.amd.com for more information about AMD.
Broadcom Emulex LPe36002
The Broadcom Emulex LPe36000-series Gen 7 Fibre Channel HBAs are designed for demanding mission-critical workloads and emerging applications. The family of adapters features Silicon Root of Trust security, designed to thwart firmware attacks aimed at enterprises and governments.
Gen 7 64G provides seamless backward compatibility to 32G and 16G networks.
Dell sells the LPe36002 64G HBA for the same price as the 32G model.
About Tolly
The Tolly Group companies have been delivering world-class IT services for over 30 years. Tolly is a leading global provider of third-party validation services for vendors of IT products, components and services.
You can reach the company by E-mail at sales@tolly.com, or by telephone at +1 561.391.5610.
Visit Tolly on the Internet at: http://www.tolly.com
Tolly Terms Of Usage
The Tolly Gro This document is provided, free-of-charge, to help you understand whether a given product, technology, or service merits additional investigation for your particular needs. Any decision to purchase a product must be based on your own assessment of suitability based on your needs. The document should never be used as a substitute for advice from a qualified IT or business professional. This evaluation was focused on illustrating specific features and/or performance of the product(s) and was conducted under controlled, laboratory conditions. Certain tests January have been tailored to reflect performance under ideal conditions; performance January vary under real-world conditions. Users should run tests based on their own real-world scenarios to validate performance for their own networks.
Reasonable efforts were made to ensure the accuracy of the data contained herein but errors and/or oversights can occur. The test/audit documented herein January also rely on various test tools the accuracy of which is beyond our control. Furthermore, the document relies on certain representations by the sponsor that are beyond our control to verify. Among these is that the software/hardware tested is production or production track and is, or will be, available in equivalent or better form to commercial customers. Accordingly, this document is provided "as is," and Tolly Enterprises, LLC (Tolly) gives no warranty, representation or undertaking, whether express or implied, and accepts no legal responsibility, whether direct or indirect, for the accuracy, completeness, usefulness, or suitability of any information contained herein. By reviewing this document, you agree that your use of any information contained herein is at your own risk, and you accept all risks and responsibility for losses, damages, costs, and other consequences resulting directly or indirectly from any information or material available on it. Tolly is not responsible for, and you agree to hold Tolly and its related affiliates harmless from any loss, harm, injury, or damage resulting from or arising out of your use of or reliance on any of the information provided herein.
Tolly makes no claim as to whether any product or company described herein is suitable for investment. You should obtain your own independent professional advice, whether legal, accounting or otherwise, before proceeding with any investment or project related to any information, products or companies described herein. When foreign translations exist, the English document is considered authoritative. To assure accuracy, only use documents downloaded directly from Tolly.com. No part of any document January be reproduced, in whole or in part, without the specific written permission of Tolly. All trademarks used in the document are owned by their respective owners. You agree not to use any trademark in or as the whole or part of your own trademarks in connection with any activities, products or services which are not ours, or in a manner which January be confusing, misleading, or deceptive or in a manner that disparages us or our information, projects or developments.

PowerEdge R7625 Rack Server & Emulex: 64G Fibre Channel up to 4:1 Server Virtualization Consolidation
Fri, 29 Mar 2024 16:28:58 -0000
|Read Time: 0 minutes
Dell PowerEdge R7625 Rack Server & Emulex LPe36002 Host Bus Adapter
64G Fibre Channel up to 4:1 Server Virtualization Consolidation
Tolly Report #224105
Tolly test report demonstrating that Dell PowerEdge R7625 Rack Server outfitted with the Emulex LPe36002 64G Fibre Channel adapter can improve virtualization server performance up to 4x vs older generation technologies.
Executive Summary
New generation technology can be expected to improve performance. There are times, however, when multiple technology advances can combine to provide an outsized advantage. Such is the case when the Dell PowerEdge R7625 Rack Server with AMD EPYC processors is combined with the Broadcom Emulex LPe36002 64G Fibre Channel Host Bus Adapter.
Dell commissioned Tolly to benchmark the database performance of the Broadcom Emulex LPe36002 64G Fibre Channel dual-port host bus adapter (HBA) running in the Dell PowerEdge R7625 Rack Server and compare that to the same combined workload performance running in four separate, R740-class servers each outfitted with a 16G FC HBA as was standard with that server generation.
Tests showed that the new R7625 AMD EPYC platform's increased CPU power and improved memory performance/capacity provide an environment where the database application can push the Emulex 64G FC HBA to full line rate performance of 64GFC thus matching the combined application throughput of four R740-class Purley platform servers using 16G FC HBAs. See Figure 1.
The Bottom Line | |
Dell PowerEdge R7625 with AMD EPYC processors & Emulex LPe36002 64GFC HBA benefits over older generation servers with 16GFC HBAs: | |
1 | 1x R7625 with 64GFC HBA can achieve the same VM “Boot Storm” throughput as 4x R740-class servers with 16GFC HBAs |
2 | Per-VM startup time improvement of 76% |
Overview
The goal of this test was to illustrate, simply, that a single Dell PowerEdge R7625 Rack Server using a single port of a PCIe 4.0-based, dual-port Emulex 64GFC HBA can equal the I/O throughput of four individual, older generation, R740-class servers each using a single port of a 16GFC HBA.
The Dell PowerEdge R740-class servers use older, less powerful CPUs and use 16GFC HBAs that offer, at best, 25% of the 64GFC HBA’s throughput. The HBAs are constrained by the bandwidth of the PCIe 3.0 bus architecture which would limit the benefits of using the higher FC speed HBAs in the older servers.
The broader point is that this significant performance improvement means that, for server virtualization applications, a single Dell PowerEdge R7625 Rack Server can be used to replace and consolidate the workloads and operating expenses of up to four older servers.
Test Background & Results
Server virtualization is an important part of IT infrastructure for countless businesses and organizations worldwide. Efficient use of the underlying server hardware components is an important aspect of providing high quality end-user experience while controlling costs. Certain elements of server virtualization can place a tremendous load on I/O resources. In particular, “Boot Storms” can be impacted severely by lack of sufficient I/O bandwidth. The scenario was run separately on a single Dell PowerEdge R7625 server, powered by AMD EPYC, outfitted with a 64GFC HBA and then, again, simultaneously on four R740-class servers each outfitted with a 16GFC HBA.
“Boot Storm”
This is an informal term applied to situations where multiple VMs are started simultaneously. During the boot process all of the VMs use a workspace profile that will, upon startup, load a standard set of applications and read initial data from the data store simultaneously thus creating the "storm" of I/O requests.
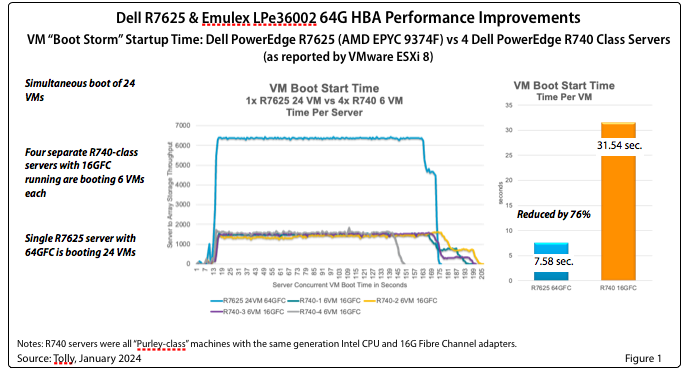
The test was run using two different scenarios. In the first scenario, four of the older servers each booted six VMs simultaneously against the same Dell data store. In the second scenario, the single Dell PowerEdge R7625 booted 24 VMs simultaneously against the same data store.
Figure 1, on the cover page, summarizes the results of the “Boot Storm” tests in terms of storage I/O and startup (boot) time. The I/O throughput difference between the single 64GFC server and the four 16GFC servers is apparent. Where each of the older servers delivers throughput of ~1,600MB/s, the 64GFC server throughput was measured at ~6,400MB/s.
This increase in throughput on the 64GFC Dell PowerEdge R7625 server results in dramatically faster boot times for each of the 24VMs tested. As shown in the the figure, the average, per-VM boot time for VMs running on the R740-class systems was 31.54. The the average, per-VM boot time for VMs running on the R7625 system was 7.58s. This represents an improvement of 76%.
Test Setup & Methodology
The HBA under test used current production drivers that are publicly available. Default settings were used. Details of the test environment and systems under test are found in Tables 1-9. Figure 2 shows a composite test environment.
As tests involved basic functions of VMware, no detailed test methodology is required.
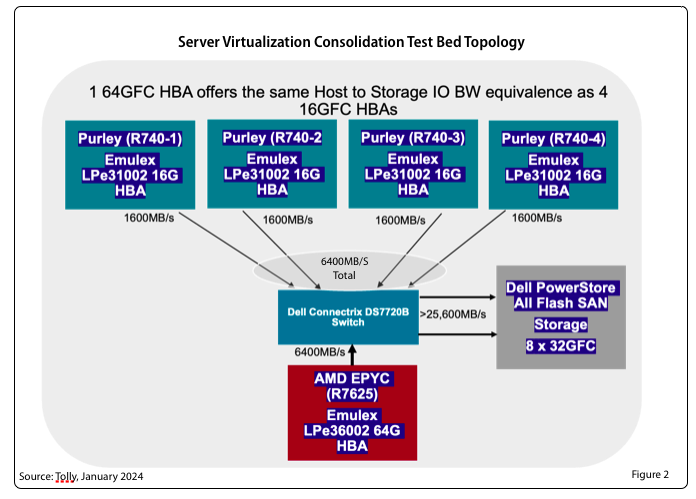
Table 1. 64G HBA Under Test
Vendor | Product Name | Bus Architecture | Firmware | Driver |
Broadcom | Emulex LPe36002 | PCIe 4.0 | 14.2.455.15 | 14.2.560.8 |
Table 2. R7625 Server Configuration
Vendor/System | Dell PowerEdge R7625 |
CPU | 2 socket AMD EPYC 9374F 32-core processor @ 3.8 GHz |
Number of CPUs | 128 logical processors. Profile: Performance, Logical Processors: Enabled, Sub Numa Clustering: Disabled |
Memory (RAM) | 384 GB |
OS | VMware ESXi-8 |
Table 3. VMware Configuration
VMware OS | RHEL 8.9 |
Storage/Controller | Storage volumes mapped to VM as thick provisioned, eagerly zeroed |
VM RAM | 15GB |
VM vCPU | 6 |
“Boot Storm” Settings | Total VMs: 24. R7625 ran 24 VMs, each R740 ran 6 VMs |
Table 4. Storage Configuration
Vendor/Device | Dell PowerStore 9200T v3.5.0.0 |
Ports | 8 x 32G FC |
Performance Policy | High |
Namespace/LUN | 8 x 32G Target ports per Namespace (single namespace) |
Namespaces | 24 namespaces, each 500GB
|
Network Fabric | Dell Connectrix DS7720B 64GFC Switch v9.0.1a
|
Table 5. 16G HBA Under Test
Vendor | Product Name | Bus Architecture | Firmware | Driver |
Broadcom | LPe31002 | PCIe 3.0 | 14.2.455.11 | 14.2.560.8 |
Table 6. R740 Class Server Configuration Host 1
CPU | 2 socket Intel(R) Xeon(R) Gold 6146 @ 3.2GHz |
Number of CPUs | 24 |
Memory (RAM) | 128 GB |
Table 7. R740 Class Server Configuration Host 2
CPU | 2 socket Intel(R) Xeon(R) Platinum 8176 @ 2.10GHz |
Number of CPUs | 56 |
Memory (RAM) | 128 GB |
Table 8. R740 Class Server Configuration Host 3
CPU | 2 socket Intel(R) Xeon(R) Platinum 8176 @ 2.10GHz |
Number of CPUs | 56 |
Memory (RAM) | 128 GB |
Table 9. R740 Class Server Configuration Host 4
CPU | 2 socket Intel(R) Xeon(R) Gold 6148 @ 2.40GHz |
Number of CPUs | 40 |
Memory (RAM) | 128 GB |
About AMD
For over 50 years, AMD has been at the forefront of driving innovation in high-performance computing, graphics, and visualization technologies. Their products are relied upon by billions of people, leading Fortune 500 businesses, and cutting-edge scientific research institutions worldwide. AMD's mission is to build exceptional products that accelerate next-generation computing experiences and power solutions for the world's most important challenges. Visit http://www.amd.com for more information about AMD.
Broadcom Emulex LPe36002
The Broadcom Emulex LPe36000-series Gen 7 Fibre Channel HBAs are designed for demanding mission-critical workloads and emerging applications. The family of adapters features Silicon Root of Trust security, designed to thwart firmware attacks aimed at enterprises and governments.
Gen 7 64G provides seamless backward compatibility to 32G and 16G networks.
Dell sells the LPe36002 64G HBA for the same price as the 32G model.
About Tolly
The Tolly Group companies have been delivering world-class IT services for over 30 years. Tolly is a leading global provider of third-party validation services for vendors of IT products, components and services.
You can reach the company by E-mail at sales@tolly.com, or by telephone at +1 561.391.5610.
Visit Tolly on the Internet at: http://www.tolly.com
Tolly Terms Of Usage
The Tolly Gro This document is provided, free-of-charge, to help you understand whether a given product, technology, or service merits additional investigation for your particular needs. Any decision to purchase a product must be based on your own assessment of suitability based on your needs. The document should never be used as a substitute for advice from a qualified IT or business professional. This evaluation was focused on illustrating specific features and/or performance of the product(s) and was conducted under controlled, laboratory conditions. Certain tests January have been tailored to reflect performance under ideal conditions; performance January vary under real-world conditions. Users should run tests based on their own real-world scenarios to validate performance for their own networks.
Reasonable efforts were made to ensure the accuracy of the data contained herein but errors and/or oversights can occur. The test/audit documented herein January also rely on various test tools the accuracy of which is beyond our control. Furthermore, the document relies on certain representations by the sponsor that are beyond our control to verify. Among these is that the software/hardware tested is production or production track and is, or will be, available in equivalent or better form to commercial customers. Accordingly, this document is provided "as is," and Tolly Enterprises, LLC (Tolly) gives no warranty, representation or undertaking, whether express or implied, and accepts no legal responsibility, whether direct or indirect, for the accuracy, completeness, usefulness, or suitability of any information contained herein. By reviewing this document, you agree that your use of any information contained herein is at your own risk, and you accept all risks and responsibility for losses, damages, costs, and other consequences resulting directly or indirectly from any information or material available on it. Tolly is not responsible for, and you agree to hold Tolly and its related affiliates harmless from any loss, harm, injury, or damage resulting from or arising out of your use of or reliance on any of the information provided herein.
Tolly makes no claim as to whether any product or company described herein is suitable for investment. You should obtain your own independent professional advice, whether legal, accounting or otherwise, before proceeding with any investment or project related to any information, products or companies described herein. When foreign translations exist, the English document is considered authoritative. To assure accuracy, only use documents downloaded directly from Tolly.com. No part of any document January be reproduced, in whole or in part, without the specific written permission of Tolly. All trademarks used in the document are owned by their respective owners. You agree not to use any trademark in or as the whole or part of your own trademarks in connection with any activities, products or services which are not ours, or in a manner which January be confusing, misleading, or deceptive or in a manner that disparages us or our information, projects or developments.

PowerEdge R7625 Rack Server & Emulex: 64G Fibre Channel Enables up to 4:1 Application Server Consolidation
Fri, 29 Mar 2024 16:19:02 -0000
|Read Time: 0 minutes
Dell PowerEdge R7625 Rack Server & Emulex LPe36002 Host Bus Adapter
64G Fibre Channel Enables up to 4:1 Application Server Consolidation
Tolly Report #224104
Tolly test report demonstrating that Dell PowerEdge R7625 Rack Server outfitted with the Emulex LPe36002 64G Fibre Channel adapter can improve application performance up to 4x vs older generation technologies.
Executive Summary
New generation technology can be expected to improve performance. There are times, however, when multiple technology advances can combine to provide an outsized advantage. Such is the case when the Dell PowerEdge R7625 Rack Server with AMD EPYC processors is combined with the Broadcom Emulex LPe36002 64G Fibre Channel Host Bus Adapter.
Dell commissioned Tolly to benchmark the database performance of the Broadcom Emulex LPe36002 64G Fibre Channel dual-port host bus adapter (HBA) running in the Dell PowerEdge R7625 Rack Server and compare that to the same combined workload performance running in four separate, R740-class servers each outfitted with a 16G FC HBA as was standard with that server generation.
Tests showed that the new R7625 AMD EPYC platform's increased CPU power and improved memory performance/capacity provide an environment where the database application can push the Emulex 64G FC HBA to full line rate performance of 64GFC thus matching the combined application throughput of four R740-class Purley platform servers using 16G FC HBAs. See Figure 1.
The Bottom Line | |
Dell PowerEdge R7625 with AMD EPYC processors & Emulex LPe36002 64G HBA benefits over older generation with 16G HBAs: | |
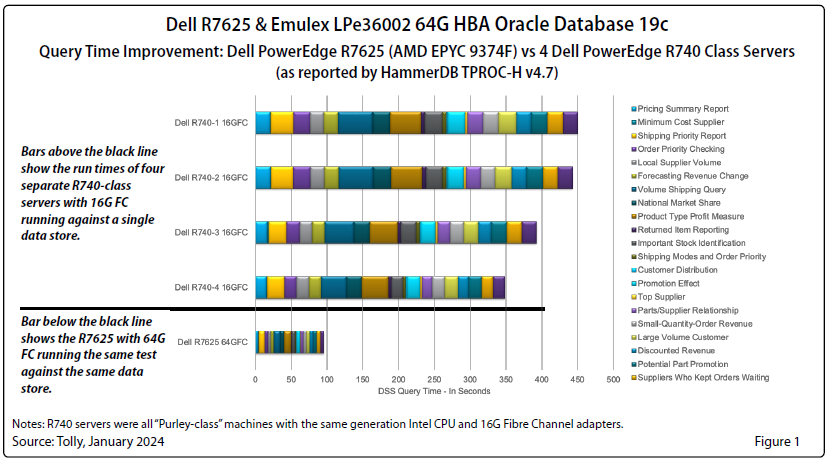
1 | 1x R7625 with 64GFC HBA can achieve same TPROC-H query throughput compared to 4x R740-class servers with 16GFC HBA |
2 | Consolidating Oracle DSS workloads from 4 R740 servers with 16GFC HBA to a single R7625 with 64GFC can significantly reduce I/O bound TPROC-H query time |
Overview
The goal of this test was to illustrate, simply, that a single Dell PowerEdge R7625 Rack Server using a single port of a PCIe 4.0-based, dual-port Emulex 64G FC can equal the I/O throughput of four individual, older generation, R740-class servers each using a single port of a 16G FC HBA.
The R740-class servers use older, less powerful CPUs and use 16G FC HBAs that offer, at best, 25% of the 64G FC HBA’s throughput. The HBAs are constrained by the bandwidth of the PCIe 3.0 bus architecture which would limit the benefits of using the higher FC speed HBAs in the older servers.
The broader point is that this significant performance improvement means that, for I/O-bound applications, a single Dell PowerEdge R7625 Rack Server can be used to replace and consolidate the workloads and operating expenses of up to four older servers.
Test Background & Results
The same test was run on all of the servers and consisted of running the TPROC-H analytics workload of HammerDB. The tests were run using the Oracle 19c database environment, but the results are generally applicable to any database or other input/output intensive workload.
The TPROC-H workload measures how long it takes to run a series of 22 different types of decision support queries. This type of workload is “read only” with no database updates taking place.
The test was run using two different scenarios. In the first scenario, four of the older servers ran the HammerDB benchmark simultaneously against the same Dell data store. In the second scenario, the single Dell PowerEdge R7625 ran the benchmark against the same data store.
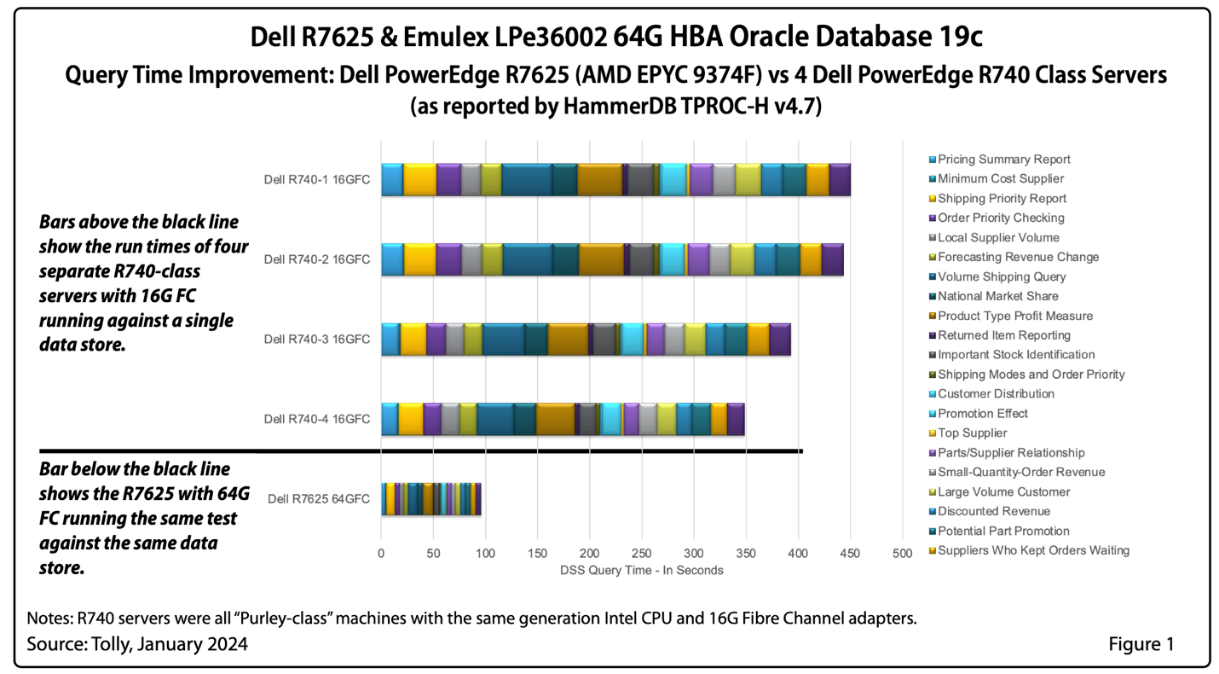
Figure 1, above the horizontal dividing line, summarizes results of the first scenario. Because those servers were using 16G FC HBAs, 16G was the theoretical maximum for network I/O and, thus a potential bottleneck for each server. As each server finished the test, the reduced load on the target data store allowed subsequent server’s tests to run more quickly. The fastest completion time was 335 seconds and the slowest was 448 seconds with the average being 405.5 seconds.
Figure 1, below the horizontal dividing line, summarizes results of the second scenario. Here, a single Dell PowerEdge R7625 Rack Server outfitted with an Emulex 64G FC HBA was able to complete the same test in 99 seconds. This illustrates that the R7625 could take on the full load of four servers running this type of workload.
Figure 2 shows the results of the same two scenarios overlaid and measured in terms of disk I/O over the course of the tests. The red dots represent the combined disk I/O of all four older generation servers. The blue dots represent the single Dell PowerEdge R7625 Rack Server, powered by AMD EPYC processors. The disk throughput of the single R7625 at 64G matches or exceeds the combined throughput of the four 16G servers.
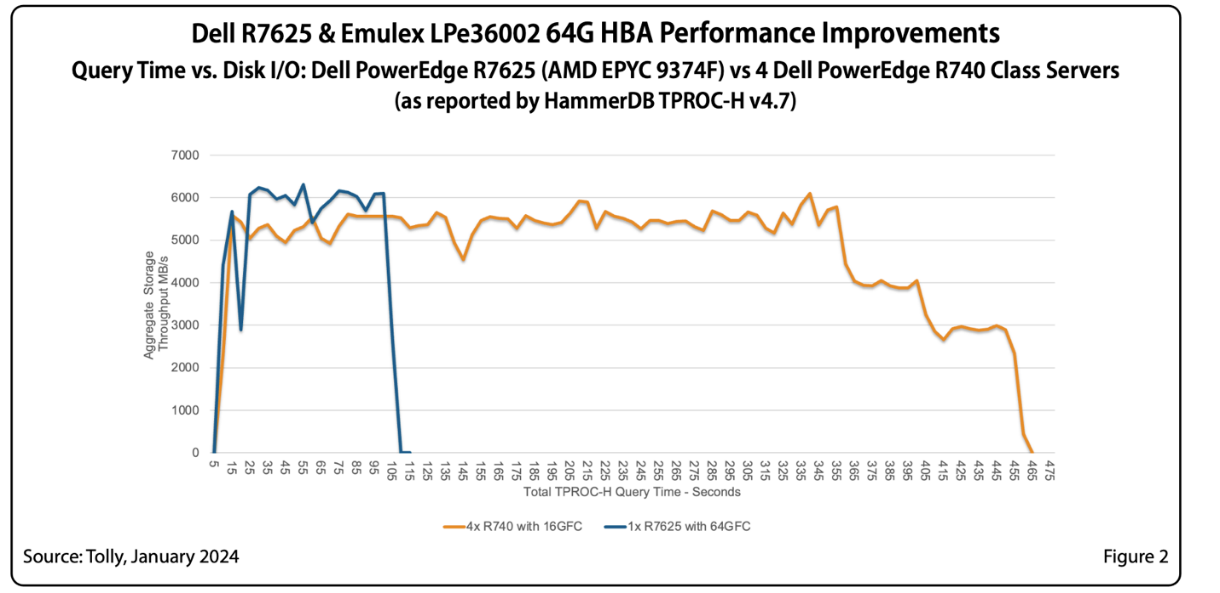
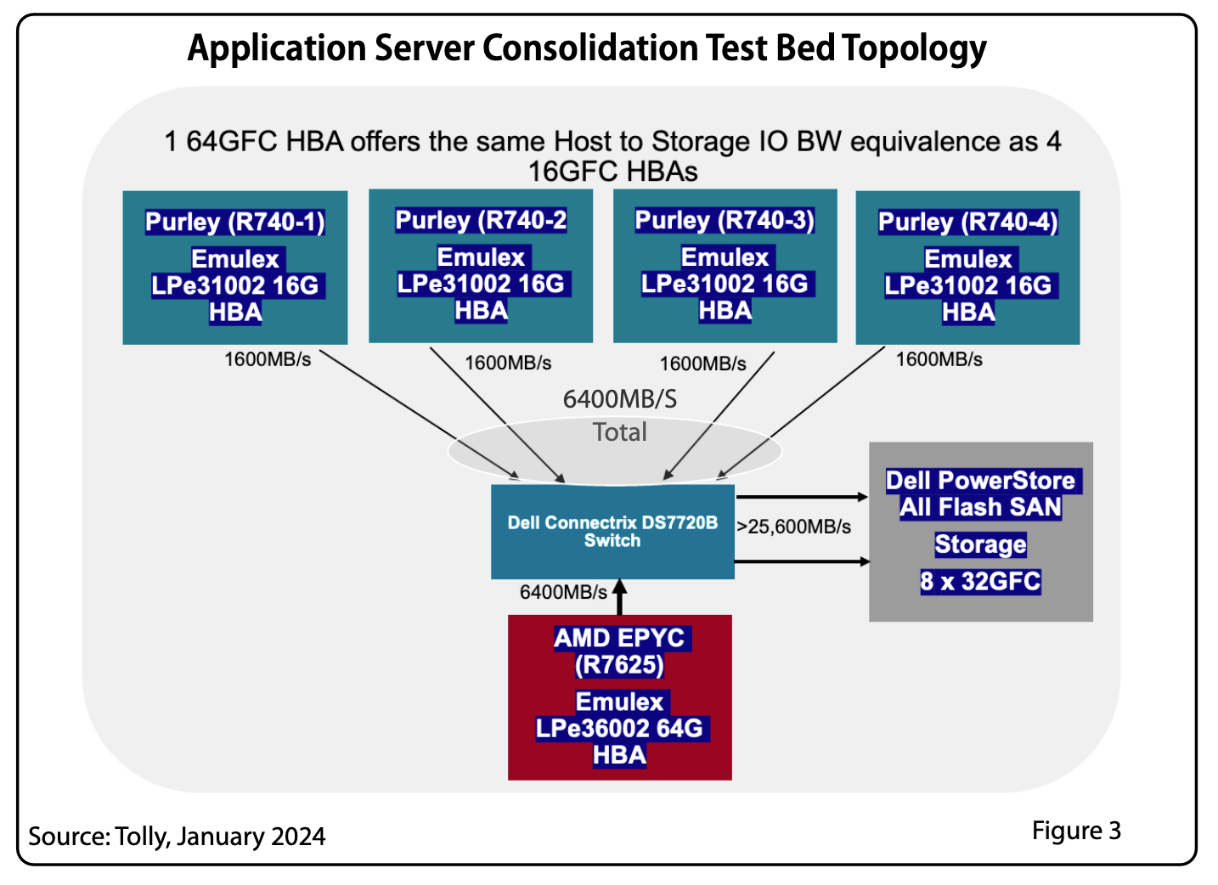
Figure 3, below, illustrates the networking flow of the four older generation servers, in blue, and the Dell PowerEdge R7625, in red, across the Broadcom Brocade 64G Fibre Channel switch.
Test Setup & Methodology
The HBA under test used current production drivers that are publicly available. Default settings were used. Details of the test environment and systems under test are found in Tables 1-10. Figure 3 shows a composite test environment.
Server systems were all VMware ESXi 8 hosts running ESXi-8.0U1-21495797 (8U2 GA). Storage volumes mapped to each VM were configured as thick provisioned, eagerly zeroed. PVSCSI controller was used.
Each VM was assigned 100GB of memory and 40 vCPUs. Each VM was running RHEL 8.8
Details of the HammerDB tests are found in the “Test Background & Results” section above.
Table 1. 64G HBA Under Test
Vendor | Product Name | Bus Architecture | Firmware | Driver |
Broadcom | Emulex LPe36002 | PCIe 4.0 | 14.2.455.15 | 14.2.560.8 |
Table 2. R7625 Server Configuration
Vendor/System | Dell PowerEdge R7625 |
CPU | 2 socket AMD EPYC 9374F 32-core processor @ 3.8 GHz |
Number of CPUs | 64 physical, 128 logical |
Memory (RAM) | 384 GB |
OS | VMware ESXi 8 |
Guest OS | RHEL 8.9 |
Table 3. Database Test Tool
Vendor | Open Source |
Application | HammerDB 4.7 |
TPROC-H settings | Degree of parallelism = 32 Scale factor = 30 Virtual users = 1 Ramp-up time: 2 minutes Run time: 5 minutes |
Table 4. Oracle Database Configuration
Database | Oracle Database 19c (19.3) |
Storage | Oracle Grid 19c, ASM disk group with external redundancy, 1 namespace for data |
Dataset Size | 40GB |
Database Settings | SGA = 12000 MB |
Table 5. Storage Configuration
Vendor/Device | Dell PowerStore 9200T v3.2.0.1 |
Ports | 8 x 32G FC |
Volumes | 2 x NVMe: 200 GB and 1 TB |
Performance Policy | High |
Namespace/LUN | 8 x 32G Target ports per Namespace |
Network Fabric | Dell Connectrix 64G FC Switch v9.0.1.a |
Table 6. 16G HBA Under Test
Vendor | Product Name | Bus Architecture | Firmware | Driver |
Broadcom | LPe31002 | PCIe 3.0 | 14.2.455.11 | 14.2.560.8 |
Table 7. R740 Class Server Configuration Host 1
CPU | 2 socket Intel(R) Xeon(R) Gold 6146 @ 3.2GHz |
Number of CPUs | 24 |
Memory (RAM) | 128 GB |
Table 8. R740 Class Server Configuration Host 2
CPU | 2 socket Intel(R) Xeon(R) Platinum 8176 @ 2.10GHz |
Number of CPUs | 56 |
Memory (RAM) | 128 GB |
Table 9. R740 Class Server Configuration Host 3
CPU | 2 socket Intel(R) Xeon(R) Platinum 8176 @ 2.10GHz |
Number of CPUs | 56 |
Memory (RAM) | 128 GB |
Table 10. R740 Class Server Configuration Host 4
CPU | 2 socket Intel(R) Xeon(R) Gold 6148 @ 2.40GHz |
Number of CPUs | 40 |
Memory (RAM) | 128 GB |
About AMD
For over 50 years, AMD has been at the forefront of driving innovation in high-performance computing, graphics, and visualization technologies. Their products are relied upon by billions of people, leading Fortune 500 businesses, and cutting-edge scientific research institutions worldwide. AMD's mission is to build exceptional products that accelerate next-generation computing experiences and power solutions for the world's most important challenges. Visit http://www.amd.com for more information about AMD.
Broadcom Emulex LPe36002
The Broadcom Emulex LPe36000-series Gen 7 Fibre Channel HBAs are designed for demanding mission-critical workloads and emerging applications. The family of adapters features Silicon Root of Trust security, designed to thwart firmware attacks aimed at enterprises and governments.
Gen 7 64G provides seamless backward compatibility to 32G and 16G networks.
Dell sells the LPe36002 64G HBA for the same price as the 32G model.
About Tolly
The Tolly Group companies have been delivering world-class IT services for over 30 years. Tolly is a leading global provider of third-party validation services for vendors of IT products, components and services.
You can reach the company by E-mail at sales@tolly.com, or by telephone at +1 561.391.5610.
Visit Tolly on the Internet at: http://www.tolly.com
Tolly Terms Of Usage
The Tolly Gro This document is provided, free-of-charge, to help you understand whether a given product, technology, or service merits additional investigation for your particular needs. Any decision to purchase a product must be based on your own assessment of suitability based on your needs. The document should never be used as a substitute for advice from a qualified IT or business professional. This evaluation was focused on illustrating specific features and/or performance of the product(s) and was conducted under controlled, laboratory conditions. Certain tests January have been tailored to reflect performance under ideal conditions; performance January vary under real-world conditions. Users should run tests based on their own real-world scenarios to validate performance for their own networks.
Reasonable efforts were made to ensure the accuracy of the data contained herein but errors and/or oversights can occur. The test/audit documented herein January also rely on various test tools the accuracy of which is beyond our control. Furthermore, the document relies on certain representations by the sponsor that are beyond our control to verify. Among these is that the software/hardware tested is production or production track and is, or will be, available in equivalent or better form to commercial customers. Accordingly, this document is provided "as is," and Tolly Enterprises, LLC (Tolly) gives no warranty, representation or undertaking, whether express or implied, and accepts no legal responsibility, whether direct or indirect, for the accuracy, completeness, usefulness, or suitability of any information contained herein. By reviewing this document, you agree that your use of any information contained herein is at your own risk, and you accept all risks and responsibility for losses, damages, costs, and other consequences resulting directly or indirectly from any information or material available on it. Tolly is not responsible for, and you agree to hold Tolly and its related affiliates harmless from any loss, harm, injury, or damage resulting from or arising out of your use of or reliance on any of the information provided herein.
Tolly makes no claim as to whether any product or company described herein is suitable for investment. You should obtain your own independent professional advice, whether legal, accounting or otherwise, before proceeding with any investment or project related to any information, products or companies described herein. When foreign translations exist, the English document is considered authoritative. To assure accuracy, only use documents downloaded directly from Tolly.com. No part of any document January be reproduced, in whole or in part, without the specific written permission of Tolly. All trademarks used in the document are owned by their respective owners. You agree not to use any trademark in or as the whole or part of your own trademarks in connection with any activities, products or services which are not ours, or in a manner which January be confusing, misleading, or deceptive or in a manner that disparages us or our information, projects or developments.

Dell PowerEdge R7625 Rack Server & Emulex LPe36002 Host Bus Adapter: 64G Fibre Channel Microsoft SQL Server
Fri, 29 Mar 2024 16:19:02 -0000
|Read Time: 0 minutes
Dell PowerEdge R7625 Rack Server & Emulex LPe36002 Host Bus Adapter
64G Fibre Channel Microsoft SQL Server Performance – NVMe/FC vs. SCSI/FC
Tolly Report #224107
Tolly test report demonstrating that Dell PowerEdge R7625 Rack Server outfitted with the Emulex LPe36002 Host Bus Adapter using NVMe/FC can improve application performance vs older generation SCSI/FC.
Executive Summary
New generation servers can bring higher performance across a range of areas. This is certainly the case with Dell’s 16th-generation server line. Similarly, newer protocols like NVM Express (NVMe) over Fibre Channel (FC) can provide greater throughput and efficiency than older SCSI over FC. Dell is unique in offering an end-to-end NVMe/FC connectivity solution in the mid-range storage marketplace with the PowerStore line.
Dell commissioned Tolly to benchmark the performance of the Broadcom Emulex LPe36002 64G Fibre Channel dual-port host bus adapter (HBA) running in the Dell PowerEdge R7625 Rack Server with AMD EPYC processors by testing using actual database applications rather than simulated I/O microbenchmarks. Testing focused on evaluating the database throughput, latency, and CPU efficiency of accessing Microsoft SQL Server 2019 for Linux systems over older SCSI/FC and newer NVMe/FC. Databases were stored on a Dell PowerStore 9200T storage appliance.
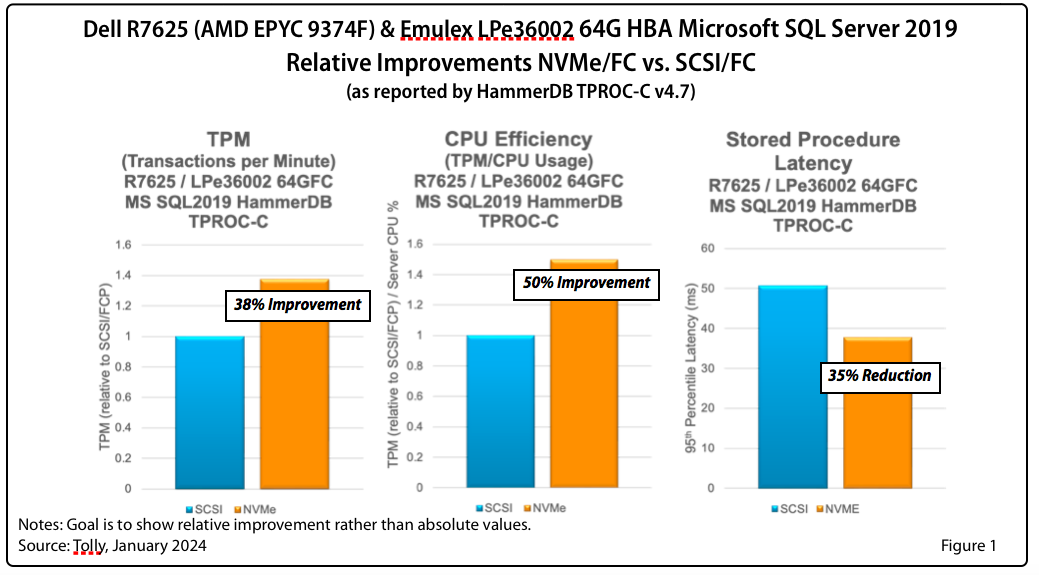
Tests showed significant improvements in transaction throughput, latency reduction, and CPU efficiency. See Figure 1 for a summary of relative improvements.
The Bottom Line | |
Dell PowerEdge R7625 with AMD EPYC processors & Emulex LPe36002 64G HBA using NVMe/FC: | |
1 | Improved database transactions by 38% |
2 | Reduced database stored procedure latency by 35% |
Overview
The goal of this test was to illustrate the performance benefits of using the newer, more-efficient NVMe/FC protocol in lieu of the older, less-efficient SCSI/FC protocol in conjunction with Emulex 64G FC HBAs running under Linux in a Dell PowerEdge R7625 Rack Server. (Dell sells the Emulex 64G FC HBA for the same price as the Emulex 32G FC HBA.)
The test was run using Microsoft SQL Server 2019 for Linux accessing the database via SCSI and then via NVMe.
While low-level component benchmarks are instructive, ultimately system architects are rightly most interested in how network-level improvements can translate into application performance improvements. This benchmarking was done with HammerDB which generates actual user transactions against an actual database. The test was focused on TPROC-C which is the HammerDB, database-oriented implementation of the de facto standard TPC-C online transaction processing benchmark.
Tests showed significant improvements in key benchmarks.
Test Results
Microsoft SQL Server 2019 for Linux
Transaction Processing. The NVMe/FC results were significantly better than the SCSI/FC results. When run over NVMe/FC, 38% more transactions per minute were processed.
CPU Efficiency. The NVMe/FC results were significantly better than the SCSI/FC results. When run over NVMe/FC, the CPU efficiency was improved by 50%.
P95 Stored Procedure Latency. Similarly, the NVMe/FC results were significantly better than the SCSI/FC results. When run over NVMe/FC, the latency was reduced by 35%.
Test Setup & Methodology
The HBA under test used current production drivers that are publicly available. Default settings were used. Details of the test environment and systems under test are found in Tables 1-5. Figure 2 shows a composite test environment.
Database Test
The goal of this test was to benchmark the database transaction performance of each HBA running the HammerDB “TPROC-C” workload which, as noted earlier, is the HammerDB, database version of the Transaction Processing Council’s TPC-C OLTP benchmarked
A Dell PowerEdge R7625 server, powered by AMD EPYC processors, was configured with the HBA under test. The Broadcom Emulex LPe36002 64G HBA connected to a Dell PowerStore 9200T via a Dell Connectrix 64G Fibre Channel switch. The test utilized a single 64G FC port of the Emulex HBA.
The server ran RHEL 8.9. SCSI Device Mapper and NVMe native multipath were enabled for the respective devices. NUMA was set to off and “transparent huge pages” was disabled.
For storage, path selection policy for NVMe native multipath was set to “round-robin". For SCSI Device mapper multipath was set to "queue-length 0”.
This test was run using Microsoft SQL Server 2019 for Linux,
The open source HammerDB test tool was used to populate the database schema and run the workload.
Table 1. HBA Under Test
Vendor | Product Name | Firmware | Driver |
Broadcom | Emulex LPe36002 (64G) (PCIe 4.0) | 14.0.539.26 | 14.0.0.15 |
Table 2. Server Configuration
Vendor/System | Dell PowerEdge R7625 |
CPU | 2 socket AMD EPYC 9374F 32-Core Processor @ 3.8 GHz |
Number of CPUs | 128 logical processors. Profile: Performance, Logical Processors: Enabled, Sub Numa Clustering: Disabled |
Memory (RAM) | 256 GB |
Power Mode
| Performance |
OS | Red Hat Ent. Linux 8.9 (RHEL8) |
Kernel | 4.18.0-425.3.1 |
Table 3. Microsoft Database Configuration
Database | Microsoft SQL Server 2019 for Linux |
Storage | Single volume, XFS |
Dataset Size | 100 GB |
DB Memory Allocation | 10G |
Table 4. Database Test Tool
Vendor | Open Source |
Application | HammerDB 4.7 |
TPROC-C settings | Total # of Warehouses = 1,000 Transactions per user = 1 million Ramp-up time: 2 minutes Run time: 5 minutes |
Table 5. Storage Configuration
Vendor/Device | Dell PowerStore 9200T v3.5 |
Ports | 8 x 32G FC |
Volume Size | 1,024GB volume each for NVMe/FC and SCSI/FC |
Namespace/LUN | 8 x 32G target ports (single namespace) |
Network Fabric | Dell Connectrix 64G FC switch v9.0.1a |
About AMD
For over 50 years, AMD has been at the forefront of driving innovation in high-performance computing, graphics, and visualization technologies. Their products are relied upon by billions of people, leading Fortune 500 businesses, and cutting-edge scientific research institutions worldwide. AMD's mission is to build exceptional products that accelerate next-generation computing experiences and power solutions for the world's most important challenges. Visit http://www.amd.com for more information about AMD.
Broadcom Emulex LPe36002
The Broadcom Emulex LPe36000-series Gen 7 Fibre Channel HBAs are designed for demanding mission-critical workloads and emerging applications. The family of adapters features Silicon Root of Trust security, designed to thwart firmware attacks aimed at enterprises and governments.
Gen 7 64G provides seamless backward compatibility to 32G and 16G networks.
Dell sells the LPe36002 64G HBA for the same price as the 32G model.
About Tolly
The Tolly Group companies have been delivering world-class IT services for over 30 years. Tolly is a leading global provider of third-party validation services for vendors of IT products, components and services.
You can reach the company by E-mail at sales@tolly.com, or by telephone at +1 561.391.5610.
Visit Tolly on the Internet at: http://www.tolly.com
Tolly Terms Of Usage
The Tolly Gro This document is provided, free-of-charge, to help you understand whether a given product, technology, or service merits additional investigation for your particular needs. Any decision to purchase a product must be based on your own assessment of suitability based on your needs. The document should never be used as a substitute for advice from a qualified IT or business professional. This evaluation was focused on illustrating specific features and/or performance of the product(s) and was conducted under controlled, laboratory conditions. Certain tests January have been tailored to reflect performance under ideal conditions; performance January vary under real-world conditions. Users should run tests based on their own real-world scenarios to validate performance for their own networks.
Reasonable efforts were made to ensure the accuracy of the data contained herein but errors and/or oversights can occur. The test/audit documented herein January also rely on various test tools the accuracy of which is beyond our control. Furthermore, the document relies on certain representations by the sponsor that are beyond our control to verify. Among these is that the software/hardware tested is production or production track and is, or will be, available in equivalent or better form to commercial customers. Accordingly, this document is provided "as is," and Tolly Enterprises, LLC (Tolly) gives no warranty, representation or undertaking, whether express or implied, and accepts no legal responsibility, whether direct or indirect, for the accuracy, completeness, usefulness, or suitability of any information contained herein. By reviewing this document, you agree that your use of any information contained herein is at your own risk, and you accept all risks and responsibility for losses, damages, costs, and other consequences resulting directly or indirectly from any information or material available on it. Tolly is not responsible for, and you agree to hold Tolly and its related affiliates harmless from any loss, harm, injury, or damage resulting from or arising out of your use of or reliance on any of the information provided herein.
Tolly makes no claim as to whether any product or company described herein is suitable for investment. You should obtain your own independent professional advice, whether legal, accounting or otherwise, before proceeding with any investment or project related to any information, products or companies described herein. When foreign translations exist, the English document is considered authoritative. To assure accuracy, only use documents downloaded directly from Tolly.com. No part of any document January be reproduced, in whole or in part, without the specific written permission of Tolly. All trademarks used in the document are owned by their respective owners. You agree not to use any trademark in or as the whole or part of your own trademarks in connection with any activities, products or services which are not ours, or in a manner which January be confusing, misleading, or deceptive or in a manner that disparages us or our information, projects or developments.

Gen 7 Emulex® HBAs by Broadcom® Application Advantage for Dell R7625 AMD EPYC Servers
Tue, 02 Apr 2024 23:05:59 -0000
|Read Time: 0 minutes
Dell PowerEdge R7625 servers with AMD EPYC processors & Emulex 64G Fibre Channel LPe36002 Host Bus Adapters demonstrate Application Advantages
Executive Summary
New generation technology can be expected to improve performance. There are times, however, when multiple technology advances can combine to provide an outsized advantage. Such is the case when the Dell PowerEdge R7625 Rack Server is combined with the Broadcom Emulex LPe36002 64G Fibre Channel Host Bus Adapter.
Dell commissioned Tolly to benchmark the database performance of the Broadcom Emulex LPe36002 64G Fibre Channel dual-port host bus adapter (HBA) running in the Dell PowerEdge R7625 Rack Server and compare that to the same combined workload performance running in four separate, R740- class servers each outfitted with a 16G FC HBA as was standard with that server generation.
Following is a summary of the 4 tests conducted:
- The first test measured HammerDB “TPROC-C” Online Transaction Processing (OLTP) workload performance with Microsoft SQL Server Database to compare the NVMe/FC vs SCSI/FC performance on a Dell PowerEdge R7625 server with Broadcom Emulex LPe36002 64G Fibre Channel HBA.
Key Findings:
- Improved database transactions by up to 38%
- Reduced database stored procedure latency by up to 35%
- Improved server CPU efficiency by up to 50%
READ THE FULL STUDY HERE:

2. The second test measured the HammerDB “TPROC-H” Decision Support System (DSS) analytics workload queries on a single Dell R7625 AMD EPYC-based platform and found that it pushed Emulex 64G Fibre Channel HBA to full line rate performance of 64G Fibre Channel, thus matching the combined application throughput of four previous generation R740-class Purley platform servers using 16G Fibre Channel HBAs.
Key Findings:
- Impressive database analytics throughput consolidation- from four R740 servers with 16G Fibre Channel HBAs to a single R7625 with 64G Fibre Channel HBA
- Consolidating analytics workload can significantly reduce I/O bound query times
READ THE FULL STUDY HERE:
3. The third test revealed a 4:1 server consolidation benefit for Virtualization workloads where a single Dell R7625 AMD EPYC-based platform with 64G Fibre channel HBA matched the combined application throughput of four Dell R740-class Purley platform servers using 16G Fibre Channel HBAs.
Key Findings:
- Consolidation of virtual machine (VM) “Boot Storm” - Virtualization workloads throughput from four Dell R740 servers with 16GFC HBA to a singleDell R7625 with Emulex 64G Fibre Channel
- A VDI boot storm is the consumption of compute and disk I/O resources during the initial startup of end-user desktop virtual images that results in poor performance for all users. VDI environments need read I/O at boot (Bootstorm).
READ THE FULL STUDY HERE:

4. The final test determined that the Dell R7625 with PCIe Gen5 and Emulex 64G Fibre Channel HBA combined to overcome bottlenecks for Oracle database HammerDB “TPROC-H” DSS analytics workload queries, achieving maximum throughput
Key Findings:
- R7625 with 64GFC HBA can achieve 4x the database analytics throughput of the16GFC HBA and 2x the throughput of the 32GFC HBA
- 42% improvement in complex database ad hoc query processing time when running the dual-port 64GFC HBA on the PCIe 5.0-based R7625 server compared to the older generation R740 server


Harness Increased Performance, Efficiency, and Lower TCO with Dell PowerEdge Powered by AMD
Wed, 15 Nov 2023 16:55:11 -0000
|Read Time: 0 minutes
Key performance indicators (KPIs) show that a hardware refresh with the latest-generation Dell PowerEdge servers and AMD EPYC™ processors can help enterprises improve the performance, efficiency, and security of their server infrastructures.
Executive Summary
Forrester Consulting reports that data centers that refresh their servers at least every three years can gain technological and business benefits compared to data centers that do not.[1] These benefits manifest themselves through higher performance, increased efficiency, and better security. Prowess Consulting investigated these benefits further by examining results from industry-standard benchmarks and environmental ratings. Based on our research, we concur with the Forrester Consulting opinion that the benefits of a server refresh can easily outweigh the costs.
If you are still wondering whether it’s time to refresh your servers, you can use this study to help you decide. We examined the effects of upgrading legacy servers running on x86-based processors that are more than three years old to Dell PowerEdge servers powered by 4th Generation AMD EPYC processors. Examples of the kinds of benefits we uncovered in the course of our investigation include:
- Up to 232% higher performance per watt[2]
- Up to 48% lower processor cost[3]
- Up to 40% lower software licensing costs through 5:1 server consolidation[4]
Exploring the Value of a Server Refresh
A 2019 report by Forrester Consulting determined that in order to be more agile and productive, data centers should be refreshing their servers at least every three years.1 The online survey showed numerous technical benefits to be gained from a server refresh, and it concluded that organizations that keep their servers modernized and updated tend to earn greater benefits from their infrastructure investments.1 Security is also a critical concern for businesses with aging server platforms. Older-generation processors might not have the latest security features necessary to protect against modern security threats.
These findings suggest that if you are running legacy servers powered by processors more than three years old, you simply cannot afford not to consider a server refresh. With the innovative hardware technologies being released in 2023, Prowess Consulting believes that now is an excellent time to look at the latest server and processor offerings. In this article, we examine the performance, efficiency, and security benefits of upgrading your legacy server platforms to the latest PowerEdge servers built on 4th Gen AMD EPYC processors.
With the goal of identifying the potential benefits you could enjoy by refreshing to latest-generation server hardware, we looked at the popular combination of Dell servers and AMD processors. Our analysis indicates that upgrading to PowerEdge servers with 4th Gen AMD EPYC processors can help improve performance, efficiency, and security. To quantify these improvements, we used a variety of industry-standard benchmarks, published results, and environmental ratings. We also evaluated qualitative benefits of refreshing servers, such as the security benefits provided by current-generation servers.
Much of this study refers to a hypothetical update scenario that involves moving from a two-node cluster of 2S 2U Fujitsu PRIMERGY® RX2540 M5 servers with two Intel® Xeon® Platinum 8280 processors each to a two-node cluster of 2S 2U Dell PowerEdge R7615 servers with a single AMD EPYC 9654P processor each. This tangible comparison helps illustrate how a server refresh can help with performance, efficiency, and security.
Total Cost of Ownership (TCO)
The total cost of owning and running a server—and its reciprocal, the value of upgrading legacy servers to the latest generation—is complex. Specific benefits from a server refresh will vary from organization to organization and from use case to use case. This study does not attempt to generate a single number that quantifies the TCO benefits of a server refresh, but we found that an upgrade from three-to-five-year-old x86 processors to 4th Gen AMD EPYC processors can provide several indicative benefits:
- Up to 40% lower software licensing costs through 5:1 server consolidation4
- Up to 38% lower software licensing costs per unit of performance[5]
- Up to 31% reduction in average energy cost[6]
These figures offer a sense of the cost benefits that can come with a server refresh. And while this analysis lays out specific benefits from refreshing legacy servers in the context of performance, efficiency, and security, all of these kinds of benefits have a direct bearing on the cost of ownership for servers—and the gains from refreshing them.

Boost Performance
A server refresh can help you lower TCO while delivering the insights you need when you need them. Newer processors can deliver higher performance per core, meaning you can run the most demanding AI and high-performance computing (HPC) workloads while still lowering your power consumption and physical footprint.
Get Higher Performance Per Core and Per Watt
Based on SPEC® benchmarking results comparing high-performance processors from several generations, we found that refreshing the two-socket Fujitsu PRIMERGY RX2540 M5 server with two Intel Xeon Platinum 8280 processors (28 cores) to a PowerEdge R7615 server with a single AMD EPYC 9654P processor (96 cores) could deliver up to twice the performance (102% higher) per core.[7]
Raw performance is an important pillar in understanding the full story of a server’s capabilities and cost of ownership. For example, virtualization continues to be a vital workload for many businesses, and while mere computational horsepower alone cannot capture how good a server might be for hosting virtual machines (VMs), it is still an important factor. With that fact in mind, we used VMmark® 3.x benchmarking results to analyze this same refresh scenario looking specifically at performance/watt for virtualization workloads. A refresh from servers powered by three-to-five-year-old x86 processors to 4th Gen AMD EPYC processors can provide up to 232% higher performance per watt for virtualization workloads.2
A single AMD EPYC 9654P processor has more cores than two Intel Xeon Platinum 8280 processors combined. However, even accounting for this difference in core count, the refreshed servers powered by a 4th Gen AMD EPYC processor can provide up to 93% higher performance/watt/core than the legacy servers powered by three-to-five-year-old x86 processors.2 Higher performance per watt and per core mean that you can either shrink your energy costs or server footprint for the same performance, or increase performance while holding power consumption and server footprint the same.

Increase Efficiency
IT budgets are being cut everywhere, and IT organizations are being told to do more with less. In short, improving the efficiency of hardware is critical to companies of all sizes.
Reducing capital expenditures (CapEx) is often the first consideration for organizations seeking to increase efficiency with a server refresh. Reduced costs upfront get reflected in lower amortized costs over the life of a server. The good news from our investigation is that upgrading to servers powered by current-generation processors can actually cost less than the legacy systems originally did.
Consider again the example of the legacy Fujitsu PRIMERGY RX2540 M5 servers running 2nd Gen Intel Xeon Platinum 8280 processors being refreshed to PowerEdge R7615 servers powered by 4th Gen AMD EPYC 9654P processors. Pricing servers is complex and multidimensional, but the majority of the price comes from the processors and the memory. If we hold memory roughly even between these two systems, processor price can give a rough idea of the relative prices of the two servers.
The two 2nd Gen Intel Xeon Scalable processors in each legacy server have a total MSRP of $22,920, compared to an MSRP of $11,805 for the single 4th Gen AMD EPYC processor in each new server.3 The representative 48% lower price can translate directly into lower system cost for the newer server—or, more likely, it can help absorb some of the cost of putting more memory into the new server to increase system efficiency, such as by hosting more VMs.
Improve License Efficiency
Using fewer servers to do the same amount of computing offers a number of savings opportunities, notably by reducing costs for software licensed by the server core. Licensing costs can end up forming a sizeable plurality if not an outright majority of the TCO of a server. Reducing the number of cores that you need to license can be a powerful way to reduce licensing costs.
To cite just one example, a study conducted by Dell Technologies showed that the latest-generation PowerEdge R7625 server with 4th Gen AMD EPYC processors offers 5:1 server consolidation compared to legacy servers using 1st Gen Intel Xeon Scalable processors. Specifically, 380 VMs running on five 2S legacy servers using 10 Intel Xeon Platinum 8180 processors (28 cores, 205 W) could be successfully migrated to one 2S 2U PowerEdge R7625 server powered by two AMD EPYC 9654 processors (96 cores, 360 W).4
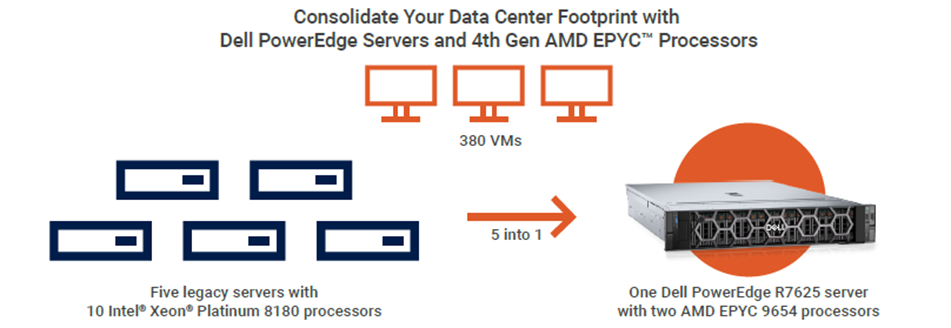
Figure 1. Dell PowerEdge servers and 4th Gen AMD EPYC processors can help consolidate your data center footprint4
The refreshed server uses 31% fewer cores, which can help reduce virtualization licensing costs. For example, you could reduce the number of VMware® licenses from 10 licenses for the five legacy 2S servers to six licenses for the new 2S server, a 40% cost savings on VMware licensing.4
In another example, the newer-generation processors were more performant than the three-to-five-year-old processors they replaced and so could provide the same level of performance using fewer cores. In this case, the lower core count due to the refresh lowered VMware licensing costs per unit of performance by up to 38%.5
Streamline Infrastructure Costs
Beyond savings on software costs, consolidating your servers with a refresh can save money on your physical infrastructure too. For example, fewer servers consume fewer networking resources, which can help reduce the cost of your networking infrastructure. A smaller number of servers also takes up less rack space, which can help reduce the footprint in your own data center—or it can translate directly into lower monthly costs if you use a co-location facility to host your data center (such as with a 5:1 server consolidation).4
Manage Power Consumption
Consolidating workloads from legacy servers to the newest-generation hardware can also lower power consumption. In our example, the 10 legacy processors in the consolidation scenario illustrated in Figure 1 are rated to have a combined maximum power draw of 2,050 W, compared to the total 720 W maximally drawn by the newest-generation processors, which represents a 64% reduction in power consumption by the processors.
Even if your server refresh plans call for keeping the same number of servers from generation to generation, you have options. If you anticipate needing additional performance, you could replace a legacy two-socket server with a newer two-socket model and gain the benefits of the higher core count in newest-generation processors. Alternatively, you could replace a two-socket legacy server with a single-socket server that provides similar performance but consumes less power. For example, VMmark benchmarking for the server-upgrade path discussed earlier recorded average usage for the Fujitsu PRIMERGY RX2540 M5 server running 2nd Gen Intel Xeon Platinum 8280 processors at 1,425.14 W and an average power draw for the PowerEdge R7615 server powered by a 4th Gen AMD EPYC 9654P processor of 982.42 W, demonstrating a drop of 31% in average power consumption.[8]
A server refresh allows you to take advantage of the latest advancements in management features, which you can use to improve performance, efficiency, and sustainability across your data center. For example, Dell OpenManage Enterprise Power Manager can help optimize the energy usage and power consumption of PowerEdge servers and servers from other top server vendors. You can use its real-time monitoring to identify power-hungry applications and devices or “zombie servers” that are running but not in use. Hardware and software telemetry helps you configure policies that will automatically take steps to reduce energy consumption or set power caps at the rack or group level. Predictive analytics can help identify power-usage trends so that you can proactively make changes to lower power consumption. For example, you can schedule low-demand workloads outside of regular business hours and take advantage of off-peak electricity rates.
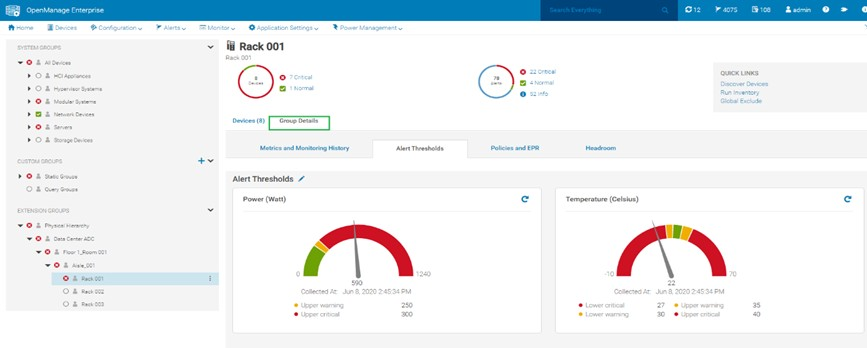
Figure 2. Dell OpenManage Enterprise Power Manager (www.dell.com/en-us/dt/solutions/openmanage/power-management.htm) lets you set up alerts for excessive power usage and temperature
Cost-Effective Ways of Keeping Your Servers Cool
The latest-generation Dell PowerEdge servers include high-efficiency cooling technologies designed to reduce the amount of power needed to cool your servers. PowerEdge servers are designed with Dell Smart Cooling (www.dell.com/en-us/dt/servers/power-and-cooling.htm), which uses state-of-the-art thermal and mechanical simulation tools to ensure optimal cooling and sustained system performance.
- Multi Vector Cooling (MVC) (https://infohub.delltechnologies.com/p/multi-vector-cooling-2-0-for-next-generation-poweredge-servers/) intelligently adapts to changing environments and configurations by regulating the speed of PowerEdge servers’ case fans so that they use less energy, which also helps increase the lifespan of the servers.
- Dell Smart Flow (https://infohub.delltechnologies.com/p/improved-poweredge-server-thermal-capability-with-smart-flow/) is a PowerEdge server chassis design that pairs a larger air intake with less obstructed internal airflow, which helps to move more air more efficiently.
- Dell Direct Liquid Cooling (https://infohub.delltechnologies.com/p/dell-technologies-direct-liquid-cooling-support-for-new-poweredge-servers/) technology is available for the latest PowerEdge servers. Liquid cooling used alone or combined with air cooling provides highly efficient temperature management for processors with high thermal design power (TDP) limits.
Improve Sustainability
Dell PowerEdge servers can help “green up” your data center. As of July 2023, PowerEdge servers are the only Silver-rated data center servers listed in the Global Electronics Council’s Electronic Product Environmental Assessment Tool (EPEAT™) (www.epa.gov/greenerproducts/electronic-product-environmental-assessment-tool-epeat).[9] EPEAT ranks qualifying products as Gold, Silver, or Bronze according to a set of required and optional criteria for environmental and social responsibility (https://globalelectronicscouncil.org/wp-content/uploads/NSF-426-2019.pdf); in achieving Silver ranking, PowerEdge servers meet all the required criteria and at least half of the optional criteria set out by EPEAT.[10]

Harden Security
With the increasing frequency and severity of cyberattacks, organizations must be proactive in ensuring that their security measures align with the latest cybersecurity standards. An upgraded server platform allows you to implement the latest multi-layered security, deploy advanced platform monitoring and management capabilities, and enable hardware security features.
Holistically Address Security with PowerEdge Servers
We found that PowerEdge servers are designed from the ground up with security in mind, and they thus provide holistic security. Holistic security for servers refers both to the defenses that OEMs such as Dell Technologies provide to protect servers from attack and to the design ideals that help support actions in response to attacks that succeed. PowerEdge servers are designed to conform to the US National Institute of Standards and Technology (NIST) Cybersecurity Framework. The NIST Cybersecurity Framework (www.nist.gov/cyberframework) consists of standards, guidelines, and best practices for organizations through five phases of cyberattacks: identification, protection, detection, response, and recovery.
A subset of this framework is the zero-trust paradigm for cybersecurity. Zero-trust is a cyber-protection paradigm that assumes all users and devices are untrusted until proven otherwise. For Dell hardware, this paradigm starts with its immutable hardware root of trust, hardware-based encryption that is used to verify subsequent operations within the server, such as booting. This verification establishes a chain of trust that extends throughout the server lifecycle, from deployment through maintenance to decommissioning. If a step in the boot process fails verification, the server shuts down so that automatic BIOS recovery can begin.
Similarly, PowerEdge servers use digital signatures on firmware updates to attest to the authenticity of the firmware running on a given server. Organizations can also use Dell management tools to maintain server firmware to a specified baseline. OpenManage Enterprise (www.dell.com/en-us/dt/solutions/openmanage/enterprise.htm) is a platform-management solution that can detect deviations from the baseline. Organizations can then use the Integrated Dell Remote Access Controller (iDRAC) (www.dell.com/en-us/dt/solutions/openmanage/idrac.htm) management controller to schedule repairs for the next time servers are rebooted for maintenance.
OpenManage Enterprise also helps deploy end-to-end security across all servers in an organization in other ways. Centralized management provided by the software uses real-time monitoring to detect potential threats, examine server activity, track user access, and analyze security logs. This makes it easier to identify and respond to potential threats before they can cause significant damage.
OpenManage Enterprise can help you quickly recover from a security breach with data backup and restoration capabilities. We highly recommend scheduling regular backups and restoration checks, which can help minimize the impact of an attack and ensure your data is protected.
Harness Hardware-Based Security with AMD EPYC Processors
4th Gen AMD EPYC processors offer a suite of hardened security technologies called AMD Infinity Guard (www.amd.com/en/processors/epyc-5-reasons-security), designed to complement your existing software- and hardware-based security. These built-into-the-silicon features can help you extend protections holistically across your x86 server platforms, regardless of what workloads they are running, who is accessing them, or where they are physically located.
AMD Infinity Guard consists of five CPU-enforced security technologies:
- AMD Secure Processor works with the immutable Dell hardware root of trust to secure BIOS boot, ensuring that only validated and verified components are allowed to boot up and run.
- Secure Memory Encryption (SME) helps protect against threats that target system memory, such as memory-scraping attacks. Even if an attacker gains access to system memory, they are unable to read or modify the encrypted data.
- AMD Shadow Stack protects in-memory data against return-oriented programming (ROP) attacks. This feature supports Microsoft hardware-enforced stack protection.
- Secure Encrypted Virtualization (SEV) blocks attacks against VMs by keeping guest operating systems and the hypervisor environment isolated from each other. The SEV Encrypted State (SEV-ES) extension adds another layer of protection for data in use.
- SEV-Secure Nested Paging (SEV-SNP) helps protect the integrity of the hypervisor, ensuring that a corrupted VM cannot access the hypervisor's memory.
Insights and Support for Complex Infrastructures
Management decisions that optimize your IT environment can help you gain even more benefits from a server refresh. For example, Dell Live Optics (www.dell.com/en-us/dt/live-optics/index.htm) is a tool that lets you see into file systems, storage and database servers, on-premises and cloud environments, workloads, and data-protection operations. You can use these insights to get your server platforms running as performantly and efficiently as possible.
The last thing you want to happen after upgrading your servers is a disruption to resource availability and user productivity. However, achieving a seamless transition to the latest and emerging technologies might require a higher level of expertise than you have available in-house. In that case, you might choose to engage additional IT support, such as Dell ProSupport for Enterprise (www.dell.com/en-us/dt/services/support-services/prosupport-infrastructure-suite.htm).
Conclusion
Organizations that adopt a modernized server strategy, which includes a three-year hardware refresh cycle, can lower the TCO of their server estates. This lower cost of ownership can manifest itself both through aggregated costs and benefits for their overall server performance, efficiency, and security.
Research conducted by Prowess Consulting found that refreshing your servers to the latest-generation Dell PowerEdge servers and AMD EPYC processors can:
- Improve performance/watt by up to 232% after upgrading from 2nd Gen AMD EPYC processors2
- More than double performance/core after upgrading from 2nd Gen Intel Xeon Scalable processors7
Refreshing your servers can also improve efficiency in a number of ways, with:
- Up to 5:1 server consolidation after upgrading from 1st Gen Intel Xeon Scalable processors, helping with server-license efficiency4
- Up to 38% lower VMware vSphere® licensing costs per unit of performance5
- Up to 31% lower average power consumption after upgrading from 2nd Gen Intel Xeon Scalable processors6
Moreover, newer environmentally and socially responsible server infrastructures can help reduce power and cooling costs for your data center.9
Finally, refreshing to newer servers can help holistically improve security for your server estate. Crucially, new servers with the latest-generation processors can help you adopt a zero-trust paradigm through features such as the Dell hardware root of trust and AMD Secure Processor, which require cryptographic authentication for each step of the server-boot process in order to head off attacks through compromised firmware. And features like AMD SME, SEV, and SEV-ES can help protect server operating systems and the VMs that depend upon them from low-level attacks.
Learn More
Learn more about Dell PowerEdge servers with 4th Gen AMD EPYC processors: www.dell.com/en-us/dt/servers/amd.htm
Discover other research reports by Prowess Consulting: https://prowessconsulting.com/labs/
Appendix
Table A1. Benchmarks and registry used for this study
Registry and benchmarks | Description |
Electronic Product Environmental Assessment Tool (EPEAT™): https://epeat.net/search-computers-and-displays | Registry of products that meet the EPEAT environmental and social responsibility criteria. Qualifying products are given a rating of Bronze, Silver, or Gold. |
SPEC CPU® 2017 Results: https://spec.org/cpu2017/results/ | Measures and compares compute-intensive performance. |
VMmark® 3.x: www.vmware.com/products/vmmark/results3x.html | Measures power-performance for mixed virtualized workload environments. |
The analysis in this document was done by Prowess Consulting and commissioned by Dell Technologies.
Prowess and the Prowess logo are trademarks of Prowess Consulting, LLC.
Copyright © 2023 Prowess Consulting, LLC. All rights reserved.
Other trademarks are the property of their respective owners.
Author: Prowess Consulting, LLC
[1] Tech Republic. “Forrester: Why Faster Refresh Cycles and Modern Infrastructure Management are Critical to Business Success.” Forrester Consulting report sponsored by Dell Technologies. December 2018. www.techrepublic.com/resource-library/casestudies/forrester-why-faster-refresh-cycles-and-modern-infrastructure-management-are-critical-to-business-success/.
[2] Results based on VMmark® 3.x server power-performance results as of July 2023, comparing a 2S 2U Fujitsu® PRIMERGY® RX2540 M server with two Intel® Xeon® Platinum 8280 processors to a 1S 2U Dell PowerEdge R7615 server with an AMD EPYC 9654P processor. Intel Xeon Platinum 8280 processor: 28 cores, 205 W, server PPKW score = 6.329/kW, 0.0565/kW/core. AMD EPYC 9654P processor: 96 cores, 360 W, server PPKW score = 21.0179/kW, 0.1094/kW/core. Source: “VMmark 3.x server power-performance results.” www.vmware.com/products/vmmark/results3x.1.html?sort=score.
[3] Intel Xeon Platinum 8280 processor MSRP = $11,460.00. Source: Intel. “Intel® Xeon® Platinum 8280 Processor.” Accessed July 2023. https://ark.intel.com/content/www/us/en/ark/products/192478/intel-xeon-platinum-8280-processor-38-5m-cache-2-70-ghz.html. (Note: Archived copies of this website on the Internet Archive do not contain pricing information prior to the present; current pricing was thus used for this analysis.) AMD EPYC 9654P processor MSRP = $11,805. Source: Paul Alcorn. “AMD 4th-Gen EPYC Genoa 9654, 9554, and 9374F Review: 96 Cores, Zen 4 and 5nm.” Tom’s Hardware. November 2022. www.tomshardware.com/reviews/amd-4th-gen-epyc-genoa-9654-9554-and-9374f-review-96-cores-zen-4-and-5nm-disrupt-the-data-center. (Note: Processor specification available on list pricing details for 1,000-unit purchases only.)
[4] Results based on VMmark® 3.x benchmarking conducted by Dell Technologies as of March 2023. 380 VMs on ten 2S servers with two Intel® Xeon® Platinum 8180 processors were migrated to two 2S 2U Dell PowerEdge R7625 servers with two AMD EPYC 9654 processors. Source: Dell. “Save Time, Rack Space, and Money—5:1 Server Consolidation Made Possible with the Latest AMD EPYC Processors.” April 2023. https://infohub.delltechnologies.com/p/save-time-rack-space-and-money-5-1-server-consolidation-made-possible-with-the-latest-amd-epyc-processors/. VMware vSphere® virtualization software can be licensed by either the core or the socket. The most cost-efficient method of calculating licenses in this scenario is to use the per-socket method, which requires one vSphere license per processor with up to 32 cores per processor. This results in two licenses per legacy server (28 cores/processor, 2 processors/server) and six licenses per new server (96 cores/processor, 2 processors/server). Source: VMware. “License Usage Calculation.” June 2023. https://docs.vmware.com/en/VMware-vRealize-Network-Insight/6.9/com.vmware.vrni.using.doc/GUID-5F19393A-D57D-4B29-8940-176CFA4C10F2.html.
[5] Results based on SPECrate® floating point (SPECfp) and integer (SPECint) testing as of July 2023, comparing a two-node cluster of 2S 2U Fujitsu® PRIMERGY® RX2540 M5 servers with two Intel® Xeon® Platinum 8280 processors each to a two-node cluster of 1S 2U Dell PowerEdge R7615 servers with a single AMD EPYC 9654P processor each. Fujitsu PRIMERGY RX2540 M5 server with Intel Xeon Platinum 8280 processors: 28 cores, 4 VMware vSphere® licenses. SPECfp = 283; SPECint = 342; geometric mean of scores per core = 311.10, 77.77/vSphere license. Dell PowerEdge R7615 server with AMD EPYC 9654P processor: 96 cores, 6 VMware vSphere licenses. SPECfp = 704; SPECint = 825; geometric mean of scores per core = 762.10, 127.01/vSphere license. Comparison of blended performance for both servers taken from the ratio of their respective geometric means per vSphere license. Source: “SPEC CPU2017 Results.” www.spec.org/cpu2017/results/. vSphere virtualization software can be licensed by either the core or the socket. The most cost-efficient method of calculating licenses in this scenario is to use the per-socket method, which requires one vSphere license per processor with up to 32 cores per processor. Source: VMware. “License Usage Calculation.” June 2023. https://docs.vmware.com/en/VMware-vRealize-Network-Insight/6.9/com.vmware.vrni.using.doc/GUID-5F19393A-D57D-4B29-8940-176CFA4C10F2.html.
[6] Results based on details from VMmark® 3.x server power-performance results as of July 2023, comparing a two-node cluster of 2S 2U Fujitsu® PRIMERGY® RX2540 M servers with two Intel® Xeon® Platinum 8280 processors each to a two-node cluster of 1S 2U Dell PowerEdge R7615 servers with a single AMD EPYC 9654P processor each. Intel Xeon Platinum 8280 processor: 28 cores, 205 W, server average power consumption = 1,425.14 W, source: VMware. “VMmark® 3.1 Results.” March 2019. www.vmware.com/content/dam/digitalmarketing/vmware/en/pdf/vmmark/2019-04-02-Fujitsu-RX2540M5-serverPPKW.pdf. AMD EPYC 9654P processor: 96 cores, 360 W, server average power consumption = 982.42 W, source: VMware. “VMmark® 3.1.1 Results.” March 2023. www.vmware.com/content/dam/digitalmarketing/vmware/en/pdf/vmmark/2023-03-21-Dell-PowerEdge-R7615-serverPPKW.pdf.
[7] Results based on SPECrate® floating point (SPECfp) and integer (SPECint) testing as of July 2023, comparing a two-node cluster of 2S 2U Fujitsu® PRIMERGY® RX2540 M5 servers with two Intel® Xeon® Platinum 8280 processors each to a two-node cluster of 1S 2U Dell PowerEdge R7615 servers with a single AMD EPYC 9654P processor each. Fujitsu PRIMERGY RX2540 M5 server with Intel Xeon Platinum 8280 processors: 28 cores, 280 W. SPECfp = 283, 2.526/core; SPECint = 342, 3.0535/core; geometric mean of scores per core = 2.7777. Dell PowerEdge R7615 server with AMD EPYC 9654P processor: 96 cores, 360 W. SPECfp = 704, 7.3333/core; SPECint = 825, 4.2968/core; geometric mean of scores per core = 5.6134. Comparison of blended performance for both servers taken from the ratio of their respective geometric means. Source: SPEC. “SPEC CPU2017 Results.” www.spec.org/cpu2017/results/.
[8] Results based on details from VMmark® 3.x server power-performance results as of July 2023, comparing a two-node cluster of 2S 2U Fujitsu® PRIMERGY® RX2540 M servers with two Intel® Xeon® Platinum 8280 processors each to a two-node cluster of 1S 2U Dell PowerEdge R7615 servers with a single AMD EPYC 9654P processor each. Intel Xeon Platinum 8280 processor: 28 cores, 205 W, server average power consumption = 1,425.14 W, source: VMware. “VMmark® 3.1 Results.” March 2019. www.vmware.com/content/dam/digitalmarketing/vmware/en/pdf/vmmark/2019-04-02-Fujitsu-RX2540M5-serverPPKW.pdf. AMD EPYC 9654P processor: 96 cores, 360 W, server average power consumption = 982.42 W, source: VMware. “VMmark® 3.1.1 Results.” March 2023. www.vmware.com/content/dam/digitalmarketing/vmware/en/pdf/vmmark/2023-03-21-Dell-PowerEdge-R7615-serverPPKW.pdf.
[9] Global Electronics Council. EPEAT™ product registry. Product name: Dell PowerEdge servers. Product type: All servers. Manufacturer: Dell. Location of use: All. EPEAT Tier: Silver. Status: Active. Accessed May 2023. https://epeat.net/search-servers.
[10] Global Electronics Council. “EPEAT™ Policy Manual.” July 2023. https://globalelectronicscouncil.org/wp-content/uploads/EPEATPolicyManual-Effective2023_Jul01_P65_Iss2Rev2.pdf.

The case for upgrading your servers to Dell PowerEdge R7625 servers powered by 4th Gen AMD EPYC processors
Mon, 25 Sep 2023 15:51:00 -0000
|Read Time: 0 minutes
Principled Technologies examined the performance improvements and cost savings associated with upgrading to the 16th Generation Dell PowerEdge R7625 for machine learning algorithms
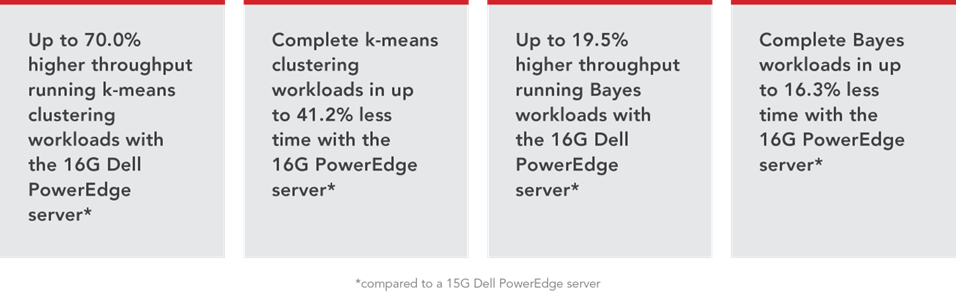
Overview
Recent years have seen a dramatic increase in the amount of data organizations store and analyze. Between 2010 and 2020, the amount of data people and organizations created, copied, consumed, and stored increased from 2 zettabytes to 64 zettabytes.[i] Machine learning (ML) tools can help companies put this data to work by analyzing it and extracting key insights, enabling more informed, data-driven business decisions. To meet this need, ML tools have become more powerful—but these workloads also put more demand on data centers.
We used the HiBench benchmark to understand the benefits of upgrading from the 15G Dell™ PowerEdge™ R7525 server to the 16G Dell PowerEdge R7625 server powered by Broadcom® network interface cards (NICs) and PERC 11 storage controllers. Both servers feature two AMD EPYC™ 64-core processors for a direct core-to-core generational comparison. We measured the throughput and time to complete k-means clustering and Bayesian classification workloads using both servers. We found the latest-generation PowerEdge R7625 offered better performance for the same amount of cores running both workloads. This means that organizations that upgrade to the latest-generation PowerEdge R7625 servers could process ML workloads faster, allowing them to update their models with new data more frequently for more timely insights. Plus, organizations that choose PowerEdge R7625 servers could save money by reducing the number of servers required to do the same amount of work as PowerEdge R7525 servers, which could reduce energy/cooling costs as well as licensing costs—up to $10,178.99 per year per consolidated server on Red Hat OpenShift licensing.
The challenges of data proliferation and compute‑intensive workloads
The rise of the Internet of Things (IoT), cloud computing, and smartphones have made it possible for businesses to harvest data from a wide range of sources and utilize it to improve their operations. Retailers can use data to track customer behavior and make their marketing more effective; manufacturers can use data to make their processes more efficient; and financial institutions can use data to detect fraud or predict market changes. As businesses gain access to new sources of data and use new technologies to analyze that data, the demand for more powerful servers will continue to grow.
Machine learning and artificial intelligence (AI) workloads have enormous potential to improve business operations, but as they gain popularity, they consume increasing amounts of processing power.[ii] According to OpenAI, developers of ChatGPT, the computing power of their AI system doubles every 3.4 month.[iii] As the ML applications organizations use become more demanding, they will need more powerful servers in their data centers as well as efficient data analysis tools in the ML pipeline. Among those data analysis tools is Apache Spark™.
Apache Spark is an open-source computing framework that converts very large data sets into smaller blocks of data for the purpose of applying machine learning algorithms and analyzing the data quickly using a distributed network of devices. For algorithms that operate on chunks of data, Spark is effective because it farms the data out to servers in the cluster, the servers process the chunks of data, and then Spark combines them for the final result. One of the main advantages of using Spark is that it can split data sets into chunks that fit in memory (when the entire data set might not) and operate with data that is entirely in memory—it doesn’t need to write to disk, which saves time. Spark is scalable: users can expand the size of their data set by adding more nodes. According to Databricks®, Spark can process “multiple petabytes of data on clusters of over 8,000 nodes,” and Spark supports a variety of data sources, including Hadoop HDFS. [iv]
We focused on two Apache Spark capabilities—k-means clustering and Bayesian classification—in our examination of the value of upgrading to the 16G Dell EMC PowerEdge R7625 server powered by 4th Gen AMD EPYC processors along with Broadcom NICs and PERC 11 storage controllers. Using these workloads, we measured the throughput and speed of the servers. A server with better throughput and speed can process more data, handle more concurrent users, handle heavier workloads, and improve response times.
About Dell EMC PowerEdge R7625 servers
The Dell EMC PowerEdge R7625 server we tested features two AMD EPYC™ 9554 processors that each contain 64 cores and a Broadcom BCM5720 NIC. According to Dell, “the PowerEdge R7625 is a highly scalable two-socket, 2U rack server packed with 50 percent more cores and up to 6 GPUs in a package that combines powerful performance and flexible configuration.”[v] According to Dell, the R7625 features:
- “Up to two 4th Gen AMD EPYC processors with up to 96 cores
- Available with either liquid or air-cooled configurations
- Low-latency storage options”[vi]
How we tested
We tested the following configurations:
- One 16G Dell PowerEdge R7625 server powered by 4th Gen AMD EPYC 64-core processors along with Broadcom NICs and PERC 11 storage controllers
- One 15G Dell PowerEdge R7525 server powered by 3rd Gen AMD EPYC 64-core processors along with Broadcom NICs and PERC 10 storage controllers
We configured both systems at maximum RDIMM capacity. The R7625 has a higher maximum capacity at 3TB and higher speed RAM at 4800 MT/s than the R7525 at 2TB and 3200MT/s, which is a useful upgrade for processing memory-intensive Spark workloads. We used Red Hat® OpenShift® virtualization. OpenShift is an open-source, Kubernetes-based container platform that offers a set of tools to manage, scale, and deploy containerized applications. For our deployment of OpenShift, we used a single-node deployment mode which is a new feature that is meant for proof of concept type environments. A typical OpenShift deployment uses three or more servers in a clustered configuration.
On each system, we created 10 OpenShift VMs with 24 cores, 96GB RAM, and one OpenShift VM with 12 cores, 32GB RAM, and one 30GB storage volume. We used this network for Spark cluster communications and Spark testing. We used Red Hat Enterprise Linux® 8 for the OS and installed Java™ 1.8.0, Python2®, and Apache Maven® 3.5.4; Apache Spark 3.0.3 with the Apache Hadoop 3.2 libraries; Apache Hadoop 3.2.4 for its HDFS capabilities; and the HiBench testing framework, version 7.1.1 with updates up to June 12, 2023 from its GitHub repository. We configured the 12-core VM as the Spark primary, and as the Hadoop manager for HDFS. We configured the remaining 10 VMs as Spark workers and Hadoop data nodes for HDFS. We used the storage volume for both the OS and for HDFS. We ran HiBench Bayes and k-means workloads from the Spark primary VM. Below is a table showing a summary of the system configurations we used in testing. For more details about our testing and configurations, read the science behind the report.
Table 1: System configurations we used in testing. Source: Principled Technologies.
Server configuration information | Dell PowerEdge R7625 | Dell PowerEdge R7525 |
Hardware |
| |
Processor | AMD EPYC 9554 – 64 cores, 3.10 GHz | AMD EPYC 7763 – 64 cores, 2.45 GHz |
Storage controller | PERC H755 Front, 8GB cache | PERC H745 Front, 4GB cache |
Total memory in system (GB) | 3,072 | 2,048 |
Disks | 4x Dell Ent NVMe v2 AGN MU U.2 6.4TB, 6,144GB, NVMe v2, PCle, SSD | 4x Dell Ent NVMe v2 AGN MU U.2 6.4TB, 6,144GB, NVMe v2, PCle,SSD |
Software | ||
VM software | Spark 3.03 Hadoop 3.2.4 Open JDK 1.8.0_372 | |
Operating system name and version | Red Hat Enterprise Linux CoreOS 4.12 Linux kernel 4.18.0-372.49.1.el8_6.x86_64 | |
Virtualization | OpenShift Virtualization 4.12 | |
VM operating system name and version | Red Hat Enterprise Linux 8.8 Linux kernel 4.18.0-477.13.1.el8_8.x86_64 | |
About 4th Gen AMD EPYC 9554 processors
According to AMD, EPYC 9554 processors deliver fast performance “for cloud, enterprise, and HPC workloads- helping accelerate your business.”[vii] EPYC processors include AMD Infinity Guard, which per AMD is “a set of layered, cutting-edge security features that help you protect sensitive data and avoid the costly downtime cause by security breaches.”[viii]
The EPYC 9554 has support for AVX512 processor extensions that speed up AI inference, including the use of the BFloat 16 data type (AVX512_BF16), and Vector Neural Network Instructions (AVX512_VNNI). In contrast, the EPYC 7763 processor has no support for AVX512 instructions.
In addition to performance and security features, AMD claims their processors are energy-efficient, which can reduce energy costs and “minimize environmental impacts from data center operations while advancing your company’s sustainability objectives.”[ix]
For more information about 4th Gen AMD EPYC processors visit: https://www.amd.com/en/processors/epyc-server-cpu-family.
About the HiBench benchmark suite
According to its GitHub repository, the HiBench benchmark suite “is a big data benchmark suite that helps evaluate different big data frameworks in terms of speed, throughput and system resource utilizations.”[x] The HiBench benchmark suite offers performance testing for 29 different types of workloads, including the machine learning algorithms associated with Bayesian Classification (Bayes) and k-means clustering.
Our results
K-means clustering
For large data sets, it isn’t possible for a human to analyze the data as efficiently or effectively as a machine learning algorithm can. K-means clustering is a machine learning algorithm that aims to group similar or dissimilar data points together in clusters. By finding similarities between data points that wouldn’t be obvious with other means of analysis, k-means clustering can unlock valuable insights into individual data points, whether they are about the customers of a business, the manufacturing processes of a factory, or some other aspect of a business. These insights could help an e-commerce company offer promotions to similar types of customers or help an insurance company detect anomalies or fraud. Using the latest generation of server technology has the potential to help businesses unlock these actionable data insights faster. Tools like RapidMiner®, ELKI, Orange, Weka®, and MATLAB™ rely on k-means clustering for some of types of calculations.
To better understand how upgrading server technology might benefit organizations that use k-means clustering to analyze their data, we used the HiBench benchmark suite to compare the k-means performance in terms of throughput (megabytes per second) and speed (seconds). As Figures 1 and 2 show, the new Dell PowerEdge R7625 server outperformed the previous-generation server in both measurements. The latest-generation server had 70.0 percent higher throughput and completed the k-means workload 41.2 percent faster than the previous-generation device.
These results suggest that organizations that frequently use k-means clustering to gain insights might benefit from upgrading their older servers. For an e-commerce company that provides personalized product recommendations to millions of users based on data, better throughput and faster k-means speed could allow them to tailor their recommendations more quickly. Faster throughput and speed could allow the e-commerce company to update their clustering model more frequently so that it adapts to changing customer behavior in real time. These improvements could lead to more customer engagement and higher sales.
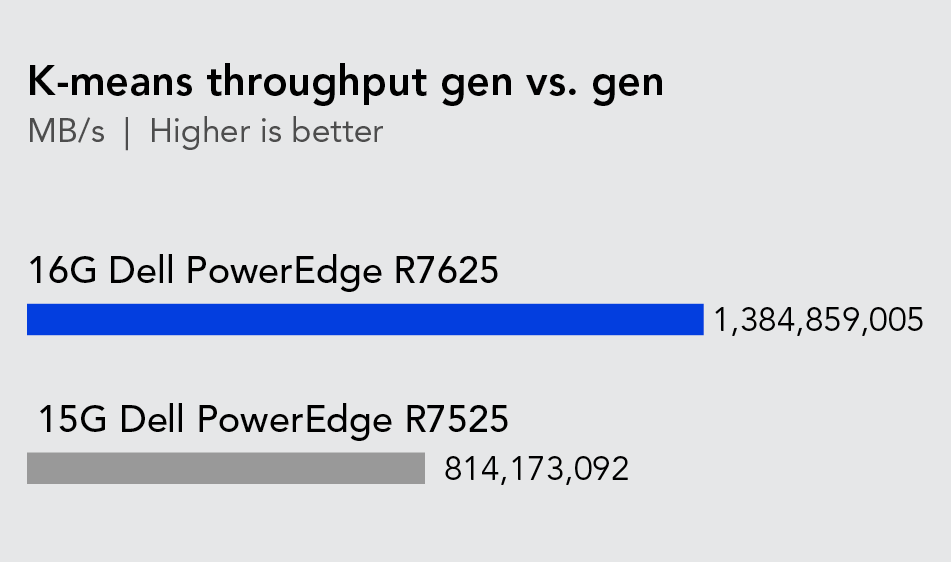
Figure 1: A comparison of the k-means throughput of the two servers in megabytes per second. Higher is better. Source: Principled Technologies.
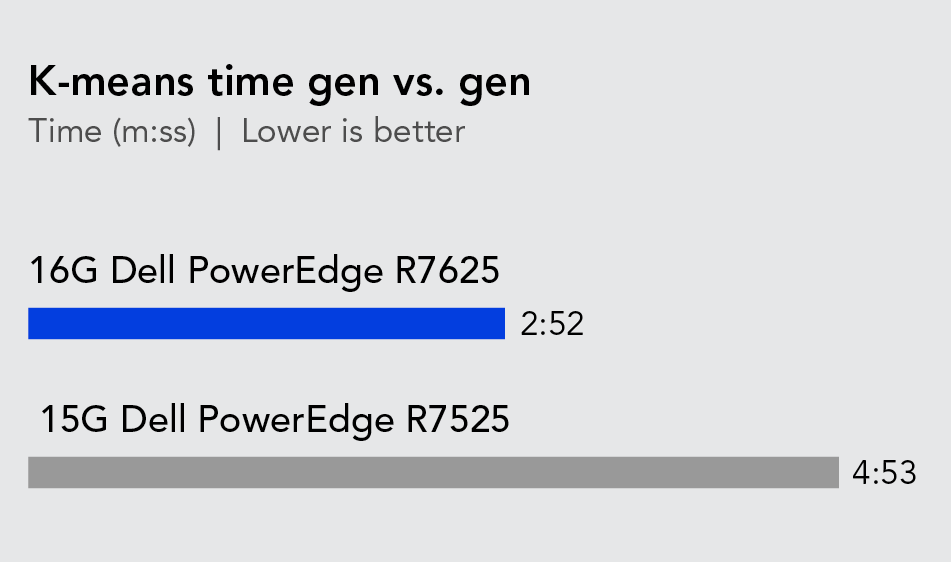
Figure 2: A comparison of the times, in seconds, that the two servers took to complete the test k-means workload. Lower is better. Source: Principled Technologies.
Bayesian classification
Bayesian classification (or Bayesian inference) is a method of estimating the probability of an outcome and calculating the uncertainty around this probability using historical data. By analyzing prior outcomes, Bayesian machine learning can give organizations a statistical probability for a future outcome. A retailer may want to know the probability of a customer making a purchase after receiving a coupon code, for example. More advanced applications of Bayesian inference have helped scientists develop new drugs and assign probability to the accuracy of diagnostic tests.[xi],[xii] Being able to quickly analyze data sets for predictions about the future can be a powerful tool for businesses and organizations.
To evaluate the Bayesian analysis performance of the servers, we used the HiBench benchmark suite to compare the total throughput, measured in megabytes per second, and the speed of analysis, in seconds. As Figure 3 shows, the 16G Dell PowerEdge R7625 achieved 19.5 percent more throughput than the previous-generation server. As Figure 4 shows, the new server was 16.3 percent faster at completing the Bayesian classification workload than the previous-generation server we compared it to.
These results indicate just how much organizations that use Bayesian machine learning to make probabilistic calculations might benefit from upgrading their aging servers. For a financial services company that uses Bayesian analysis to make investment decisions and assess risk, higher throughput and speed could allow them to handle larger data sets and run more complex models to make more accurate, real-time decisions. Alternatively, a healthcare system that uses Bayesian models for diagnosis and treatment could update patient models faster and more frequently, leading to more accurate diagnosis and better health outcomes for patients.

Figure 3: A comparison of the Bayes throughput of the two servers in megabytes per second. Higher is better. Source: Principled Technologies.

Figure 4: A comparison of the times, in seconds, that the two servers took to complete the test Bayes workload. Lower is better. Source: Principled Technologies.
Performance and value – How these results can impact the bottom line
With any decision to upgrade a server environment, companies want to know that their upfront investment in new technology provides opportunities to save money further down the road. New technologies come at a price, but improvements in performance and efficiency can pay off in the long run.
Organizations can potentially save money by consolidating older servers with higher-performing, newer servers that each do more work. In our testing, a single Dell PowerEdge R7625 outperformed the Dell PowerEdge R7525 by up to 70 percent, completing 1.7 times as much k-means work as a single PowerEdge R7525. This means that two PowerEdge R7625 servers could process 3.4 times as much k-means work as one PowerEdge R7525 server. In other words, two PowerEdge R7625 servers can process the same amount of work as three PowerEdge R7525 servers with an additional 40 percent headroom. Thus, an organization that upgrades the servers in their data centers could likely reduce the total number of servers and still process the same workloads.
For each server a company can consolidate onto new gear, they can reduce their licensing cost for Red Hat OpenShift Platform Plus licensing costs for a standard 1-year subscription by $10,178.99 or by $27,820.99 for a standard 3-year subscription.[xiii],[xiv] These savings don’t even take into account premium subscriptions or additional support add-ons, which would further reduce annual licensing and support costs. By reducing server counts, companies could also find savings in the reduction of cooling costs, power costs, and data center footprints. As the number of servers in a data center scales, so too do the savings associated with upgrading to the latest-generation PowerEdge R7625 servers.
About Broadcom Gigabit Ethernet BCM5720 Controller
The Dell PowerEdge servers we tested feature Broadcom Gigabit Ethernet BCM5720 controllers. According to Broadcom, its 1G Ethernet Controllers are “the ideal solution for multicore servers, delivering full line-rate throughput across all ports.”[xv]
The BCM5720 Dual-Port 1GBASE-T PCle 2.1 Ethernet Controller is a 13th generation 10/100/1000BASE-T and 10/100/1000BASE-X Ethernet LAN controller solution. The host interface supports a separate PCle function for each LAN interface and the controller includes I/O Virtualization (IOV) features such as 17 receive and 16 transmit queues, and 17 MSI-X vectors with flexible vector-to-queue association. These IOV features enable the BCM5720 to support the VMware® NetQueue and Microsoft VMQ technologies.[xvi]
Broadcom also states that this controller has “a comprehensive set of hardware features that the system may use to implement IEEE 1588 or IEEE 802.1AS-based time synchronization. These hardware features include a high-precision clock, timestamp registers for receive/transmit packets, and programmable trigger inputs and watchdog outputs.”[xvii]
Learn more at https://www.broadcom.com/products/ethernet-connectivity/network-adapters/bcm5720-1gbase-t-ic.
About Broadcom PERC 11 PERC H755N controllers
The PERC11 series of adapters presents a diverse range of notable features. It ensures dependable, high-performance, and fault-tolerant management of the disk subsystem. These adapters possess extensive RAID control capabilities, offering support for multiple RAID levels, such as 0, 1, 5, 6, 10, 50, and 60.[xviii] This facilitates efficient data safegaurding and redundancy mechanisms within the system.
Regarding compatibility, the PERC11 adapters conform to the Serial Attached SCSI (SAS) 3.0 standard, which facilitates a maximum data throughput of 12 Gb/s. This adherence ensures streamlined data transfer and seamless operations within the storage environment. Furthermore, the adapters boast extensive compatibility with a wide array of storage devices. They seamlessly integrate with Dell-qualified Serial Attached SCSI (SAS) and SATA hard drives, solid-state drives (SSDs), and PCle SSDs (NVMe). This versatility empowers users to leverage diverse storage options that align with their specific requirements and preferences.
Conclusion
As data proliferates and the sizes of databases grow, the potential to unlock valuable insights from them becomes increasingly dependent on fast architectures that can handle compute-intensive machine learning workloads such as k-means clustering and Bayesian inference. By upgrading to the latest servers, organizations can scale their processing power to meet the growing demands of their databases.
Larger databases and more powerful algorithms have the potential to give organizations a competitive edge. Faster servers can improve the accuracy of data-driven decisions by allowing organizations to use more complex algorithms and update ML models more frequently. To consider just two examples, improved performance could allow an e-commerce company to make better recommendations to customers and a financial services company to assess risks more accurately.
When we compared the machine learning performance of a 16G Dell PowerEdge R7625 server powered by 4th Gen AMD EPYC 64-core processors with Broadcom NICs and PERC 11 storage controllers to a previous-generation PowerEdge server, we found performance enhancements in terms of throughput and speed, whether running k-means clustering or Bayesian workloads. These findings suggest that organizations that rely on machine learning algorithms might gain performance advantages by upgrading to the latest generation of these Dell servers.
This project was commissioned by Dell Technologies.
September 2023
Principled Technologies is a registered trademark of Principled Technologies, Inc.
All other product names are the trademarks of their respective owners.
[i] Petroc Taylor, “Volume of data/information created, captured, copied, and consumed worldwide from 2010 to 2020, with forecasts from 2021 to 2025,” accessed June 12, 2023, https://www.statista.com/statistics/871513/worldwide-data-created/.
[ii] Andreja Velimirovic, “Why Density per Rack is Going Up,” accessed June 12, 2023, https://phoenixnap.com/blog/rack-density-increasing.
[iii] The Science of Machine Learning, “Exponential Growth,” accessed June 12, 2023, https://www.ml-science.com/exponential-growth.
[iv] Databricks, “Apache Spark.”
[v] Dell, “PowerEdge R7625 Rack Server,” accessed June 11, 2023, https://www.dell.com/en-us/shop/dellpoweredge-servers/poweredge-r7625-rack-server/spd/poweredge-r7625/pe_r7625_15972_vi_vp.
[vi] Dell, “PowerEdge R7625 Rack Server.”
[vii] AMD, “AMD EPYC Processors,” accessed June 27, 2023, https://www.amd.com/en/processors/epyc-server-cpu-family.
[viii] AMD, “AMD EPYC Processors.”
[ix] AMD, “AMD EPYC Processors.”
[x] GitHub, “HiBench Suite,” accessed June 27, 2023, https://github.com/Intel-bigdata/HiBench.
[xi] Christopher J. Yarnell, John T. Granton, and George Tomlinson, “Bayesian Analysis in Critical Care Medicine,” accessed June 27, 2023, https://www.atsjournals.org/doi/10.1164/rccm.201910-2019ED.
[xii] Sandeep K. Gupta, “Use of Bayesian statistics in drug development: Advantages and challenges,” accessed June 16, 2023, https://www.ncbi.nlm.nih.gov/pmc/articles/PMC3657986/.
[xiii] Insight, “Red Hat OpenShift Platform Plus - standard subscription (1 year) - 1-2 sockets,” accessed July 16, 2023, https://www.insight.com/en_US/shop/product/MW01624/red%20hat%20software/MW01624/Red-[…]nShift-Platform-Plus-standard-subscription-1-year-12-sockets/.
[xiv] Insight, “Red Hat OpenShift Platform Plus - standard subscription (3 years) - 1-2 sockets,” accessed July 26, 2023, https://www.insight.com/en_US/shop/product/MW01624F3/red%20hat%20software/MW01624F3/[…]Shift-Platform-Plus-standard-subscription-3-years-12-sockets/.
[xv] Broadcom, “BCM5720 - Dual-Port 1GBASE-T,” accessed June 8. 2023, https://www.broadcom.com/products/ethernet-connectivity/network-adapters/bcm5720-1gbase-t-ic.
[xvi] Broadcom, ”BCM5720 - Dual-Port 1GBASE-T.”
[xvii] Broadcom, ”BCM5720 - Dual-Port 1GBASE-T.”
[xviii] Dell, “Dell PowerEdge RAID Controller 11 User’s Guide PERC H755, H750, H355, and H350 Controller Series—Dell Technologies PowerEdge RAID Controller 11,” accessed June 28, 2023, https://www.dell.com/support/manuals/en-us/poweredge-r6525/perc11_ug/dell-technologies-poweredge-raid-controller-11?.

SMBs can reduce licensing & other costs by choosing latest-gen 16G Dell PowerEdge servers with AMD processors
Thu, 07 Sep 2023 18:46:38 -0000
|Read Time: 0 minutes
A cluster of these servers ran a mix of applications with up to 27 percent better application performance than a previous-generation cluster, which could allow companies to do a given amount of work with fewer servers

Introduction
COVID-19 forced many small or medium-sized businesses (SMBs) to make changes, such as shifting to new markets or moving portions of their business online. Given the overall mood of uncertainty during the pandemic, some companies chose to delay technology purchases. Supply chain issues also affected the availability of some hardware. As conditions have stabilized, however, decision makers may be looking at the legacy gear in their data centers and questioning its ability to meet current requirements.
When upgrading, purchasers have a choice between investing in the latest-generation hardware or trying to reduce their capital expenditure (CAPEX) by going with previous-generation gear. To help those in this position understand the implications of both options, Principled Technologies conducted a series of tests on two three-node Microsoft Windows Server 2022 clusters with Hyper-V and Storage Spaces Direct. One cluster used previous-generation single-socket 15G Dell™ PowerEdge™ R7515 servers powered by 3rd Gen AMD EPYC 7543P processors; the other used latest-generation single-socket 16G Dell PowerEdge R7615 servers powered by 4th Gen AMD EPYC™ 9354P processors along with Broadcom® network interface cards (NICs) and PERC 11 storage controllers. We measured each cluster’s capabilities by making it simultaneously handle a database workload, a container-based application, and a web app—a mix of workloads similar to the ones that many SMBs run.
On all three workloads, the new cluster demonstrated significant performance advantages over the previous-generation cluster, to the point where you would need fewer new servers to do a given amount of work. With software licensing being such a large expense, the savings you would reap from being able to eliminate one server could more than offset the purchase price of the new servers. This would help your company deliver a better experience to end users while also lowering other costs, such as power and cooling and IT staff time for maintenance.
Considerations SMBs face when upgrading IT infrastructure
When preparing to replace their outdated servers with modern ones, small and medium-sized businesses face a wide range of challenges, but three common ones are cost, staffing, and equipment longevity.
IT budgets are limited, and it can be easy to underestimate the true cost of new gear if decision makers account for only the CAPEX of the hardware purchase. Companies should also consider the ongoing operating expenditures (OPEX) involved with servers, such as rack space and power for servers, IT staffing resources, and the most expensive item: software licensing.
Researching technology solutions, deploying servers, and providing support once the new equipment is up and running can all be extremely time-consuming tasks. By choosing a solution that minimizes these IT burdens, companies can free their in-house admin teams to take care of other needs or limit costs for third-party IT.
Choosing a server solution that is a good fit for the unique needs of your business can feel like walking a tightrope. On the one hand, you want to avoid overinvesting in technologies with capabilities that exceed the requirements of your workloads. On the other hand, underinvesting can also be a mistake, leaving you with servers that lack the power and reliability necessary for mission-critical workloads for the lifespan of the new equipment, cannot handle future growth well, and risk delivering an unsatisfactory experience to both customers and employees. An underpowered solution could have a shorter lifecycle, which would put you back at square one of the decision-making process sooner. Perhaps the greatest downside to choosing a previous-generation solution is that doing so can require you to purchase operating system and application software licenses for an additional server.
All these considerations make it very important to take time to assess your current and future needs, such as the types of workloads you run, the number of customers and employees you support, and the growth you anticipate. By doing so, you greatly improve the likelihood of selecting a cost-effective hardware solution that will suit your needs for the life span you hope the solution to have.
The limitations of cloud
Before we dive into data center upgrades, we must consider the cloud. While many companies have shifted business applications to the cloud, there are potential disadvantages and limitations, which you should weigh against the convenience of this approach. These include security concerns, dependence on the internet, lack of control of resources, occasional downtime, vendor compatibility, and cost.
Security concerns
While cloud service providers (CSPs) typically apply multiple security measures to keep their cloud infrastructure safe from attack, data breaches do occur. For instance, a 2021 flaw in the Microsoft Azure Cosmos DB database resulted in customer information being exposed to hackers.[i] While threats such as this one do not make cloud computing entirely insecure, they demonstrate “a higher chance of successful attacks or data breaches when there is human error in cloud setup and issues with endpoint configurations.”[ii]
Limited flexibility and control over resources
Cloud providers typically do not allow business owners to manage and monitor the hardware in their cloud environment. This limits the visibility into potential future problems or hardware failures, leaving the business completely reliant on the cloud provider’s planning and reliability. CSPs can also place limits on the tools, applications, and data that customers can deploy on cloud servers.[iii]
Occasional downtime
When cloud servers go down, forcing users to wait until a connection is restored, businesses can lose customers and revenue.[iv] One example of downtime affecting cloud-based businesses was the hour-long 2020 blackout of all Google services.[v] This type of downtime may be rare, but it can have an enormous negative impact.
Vendor compatibility issues
Transitioning from one CSP to another is not necessarily a seamless experience. Applications working properly in one cloud platform will not always be compatible with another provider’s platform, a risk that can make decision makers feel “locked in” with a single provider.[vi]
Cost
A company’s monthly CSP bill increases along with usage, making cloud potentially very expensive. As Wang and Casado outline in the Andreesen Horowitz paper “The Cost of Cloud, a Trillion Dollar Paradox, ”paying a “flexibility tax” for the public cloud often makes good business sense early in a company’s journey, but can lead to large OPEX outlays that can offset the flexibility benefits.[vii]
One company that left the cloud for economic reasons was project management platform Basecamp. In October 2022, Basecamp CTO David Heinemeier Hansson wrote, “Renting computers is (mostly) a bad deal for medium-sized companies like ours with stable growth. The savings promised in reduced complexity never materialized.”[viii]
A look at the applications SMBs are running in their data centers
These downsides of the cloud are some of the reasons decision makers run certain applications in their data centers. Another reason is the nature of the applications themselves. For example, companies may choose to keep internal applications such as company portals and human resources applications on servers that are on site. We tested with three types of applications companies might place on on-site servers.
Kubernetes containers for containerized apps
A container is a unit of software packaged with everything required to run that software in a standalone state, including binaries, libraries, dependencies, and of course, the application itself. Kubernetes® is an open-source platform for deploying and managing applications that run in containerized environments.
Organizations deploy applications in Kubernetes containers for scalability and flexibility; containers also give them the ability to burst to cloud when necessary. Thanks to software improvements, Kubernetes technology has become more accessible in recent years. Running your containerized applications on high-performing servers is a win because the smaller footprint of containerized applications lets you take better advantage of the increased resources of those servers.
Kubernetes containerized environments can allow organizations to offer a high-quality user experience for multi-tiered web applications, such as those for online auctions and ecommerce.
WordPress for websites
Websites are a critical resource for many small and medium-sized businesses, and WordPress is an extremely popular web platform for businesses of all shapes and sizes. According to WordPress, “More bloggers, small businesses, and Fortune 500 companies use WordPress than all other options combined.”[ix] Almost as important as having a website is having it perform well in terms of speed and responsiveness. For example, if your site takes more than 3 seconds to load, 40 percent of potential customers will abandon it.[x]
The WordPress platform provides a way for companies to have a web presence, which is obviously a vital component of success because web searches may well be the way most customers will find businesses. Because users expect web pages to load quickly and have little patience when they fail to do so, strong WordPress performance can translate to attracting and keeping customers, while poor WordPress performance can cause you to lose customers before they even see your site.
Online transaction processing (OLTP) databases that underlie many critical business applications
For SMBs, OLTP databases are essential tools for organizing and tracking customers, inventory, employees, and finances. Examples of OLTP databases include:
- Customer relationship management (CRM) databases maintain all the information about accounts, contacts, leads, and opportunities. The record for an individual customer might track not only contact information and order history, but also details of service calls and more. Companies can also use CRM databases to manage marketing and promotions, export email addresses, and generate shipping labels.[xi]
- Inventory tracking databases help companies keep tabs on how much inventory they have and where it is located. The database can include integrated bar codes and scanners that employees can use to track and monitor items as they travel from one location to another, and can send alerts when supplies of critical items are running low.[xii]
- Payroll and scheduling databases keep track of employee data, such as wages, accrued vacation time, and benefits.[xiii]
One such OLTP database application is Microsoft SQL Server, a widely recognized relational database management system (RDBMS) that utilizes the SQL programming language. At the center of its architecture is the Database Engine, a relational engine for query processing and a storage engine for database file and index management. It also includes other data-related services such as SQL Server Integration Services (SSIS), SQL Server Analysis Services (SSAS), and SQL Server Reporting Services (SSRS).
For those running these and other SMB database applications, performance is an important element of effectiveness. Servers that deliver database results quickly mean less waiting and frustration for your employees as they perform their jobs, and putting important information into the hands of decision makers sooner.
Testing this mixed, multi-application workload
To help small and medium-sized businesses considering upgrading their legacy servers, we conducted testing using two different three-node Microsoft Windows Server 2022 clusters with Hyper-V and Storage Spaces Direct:
- One using previous-generation single-socket 15G Dell PowerEdge R7515 servers with 3rd Gen AMD EPYC processors
- One using current-generation 2U, single-socket 16G Dell PowerEdge R7615 servers powered by 4th Gen AMD EPYC processors along with Broadcom NICs and PERC11 storage controllers
We chose the PowerEdge R7615 for a number of reasons. As a 2U rack server, it offers better storage options than a 1U server. The fact that it uses single-socket processors provides a financial advantage over multi-socket servers in terms of both its purchase price and its licensing requirements. Any software that uses a per-socket licensing structure will be less expensive to license. We configured the PowerEdge R7615 servers with PERC11 storage controllers because of their effect on both redundancy and performance. We selected 16G servers with AMD EPYC 9354P processors because they strike a balance between strong performance and optimized cost and because 32 cores is a sweet spot for licensing. The 9354P is also less expensive than the two-socket 9354 version of the processor.[xiv]
Our mixed workload included a Microsoft SQL Server database component, a multi-tier web app (Weathervane) on Kubernetes, and a WordPress component. All applications ran simultaneously to simulate an organization using a single cluster of three servers to run multiple concurrent applications.
Table 1 shows the server hardware we used, Table 2 shows the software we used, and Figure 1 shows a diagram of our test bed. Note that given the differences in memory channel architecture between the two server generations, we could not match the RAM capacities while also configuring the systems in a balanced, optimized configuration. We chose to ensure a balanced configuration to optimize for performance. As a result, the 16G servers had a greater memory capacity than the 15G servers.
Table 1: Server configuration information.
Three Dell PowerEdge R7615 servers | Three older Dell PowerEdge R7515 servers | |
Processors | AMD EPYC 9354P 32 cores 3.25 GHz | AMD EPYC 7543P 32 cores 2.80 GHz |
Storage controller | PERC H755N Front 8GB cache | PERC H740P Mini (Embedded) 8GB cache |
Network interface cards | Broadcom® Gigabit Ethernet BCM5720 2x 1Gb Ethernet
Broadcom 57414 Dual Port 10/25GbE SFP28, OCP NIC 3.0 | Broadcom Gigabit Ethernet BCM5720 2x 1Gb Ethernet
Broadcom 57414 Dual Port 10/25GbE SFP28, OCP NIC 3.0 |
Total memory in system (GB) | 192 | 128 |
Host operating system name and version/build number | Microsoft Windows Server 2022 Datacenter Version 10.0.20348 Build 20348 | |
Table 2: Software we used.
Workload | Application | VM operating system | Benchmarking tool |
OLTP database | SQL Server 2019 | Microsoft Windows Server 2022 Datacenter | DVD Store 3 |
Kubernetes | Tanzu Community Edition v0.12.1 | Ubuntu 22.04 | Weathervane 2.1 |
Web application | WordPress 6.2 | Ubuntu 22.04 | Siege HTTP load tester and benchmarking utility |
About Dell PowerEdge R7615 servers
The Dell PowerEdge R7615 is a 2U, single-socket rack server. Dell states that it has designed this server to provide “performance and flexible, low-latency storage options in an air or Direct Liquid Cooling (DLC) configuration.”[xv]
According to Dell, this server uses the AMD EPYC 4th generation processor to deliver up to 50 percent higher core count per single-socket platform in an innovative air-cooled chassis and supports DDR5 at 4800 MT/s memory and PCIe® Gen5 with double the speed of previous Gen4 for faster access and transport of data, optimizing application output.[xvi] It supports up to six single-wide full-length GPUs or three double-wide full-length GPUs to improve responsiveness or reduce app load time for power users and supports lower-latency, high-performance NVMe SSDs in a hardware RAID solution to help maximize compute performance.[xvii]
Learn more at https://www.delltechnologies.com/asset/en-us/products/servers/technicalsupport/poweredge-r7615-spec-sheet.pdf.
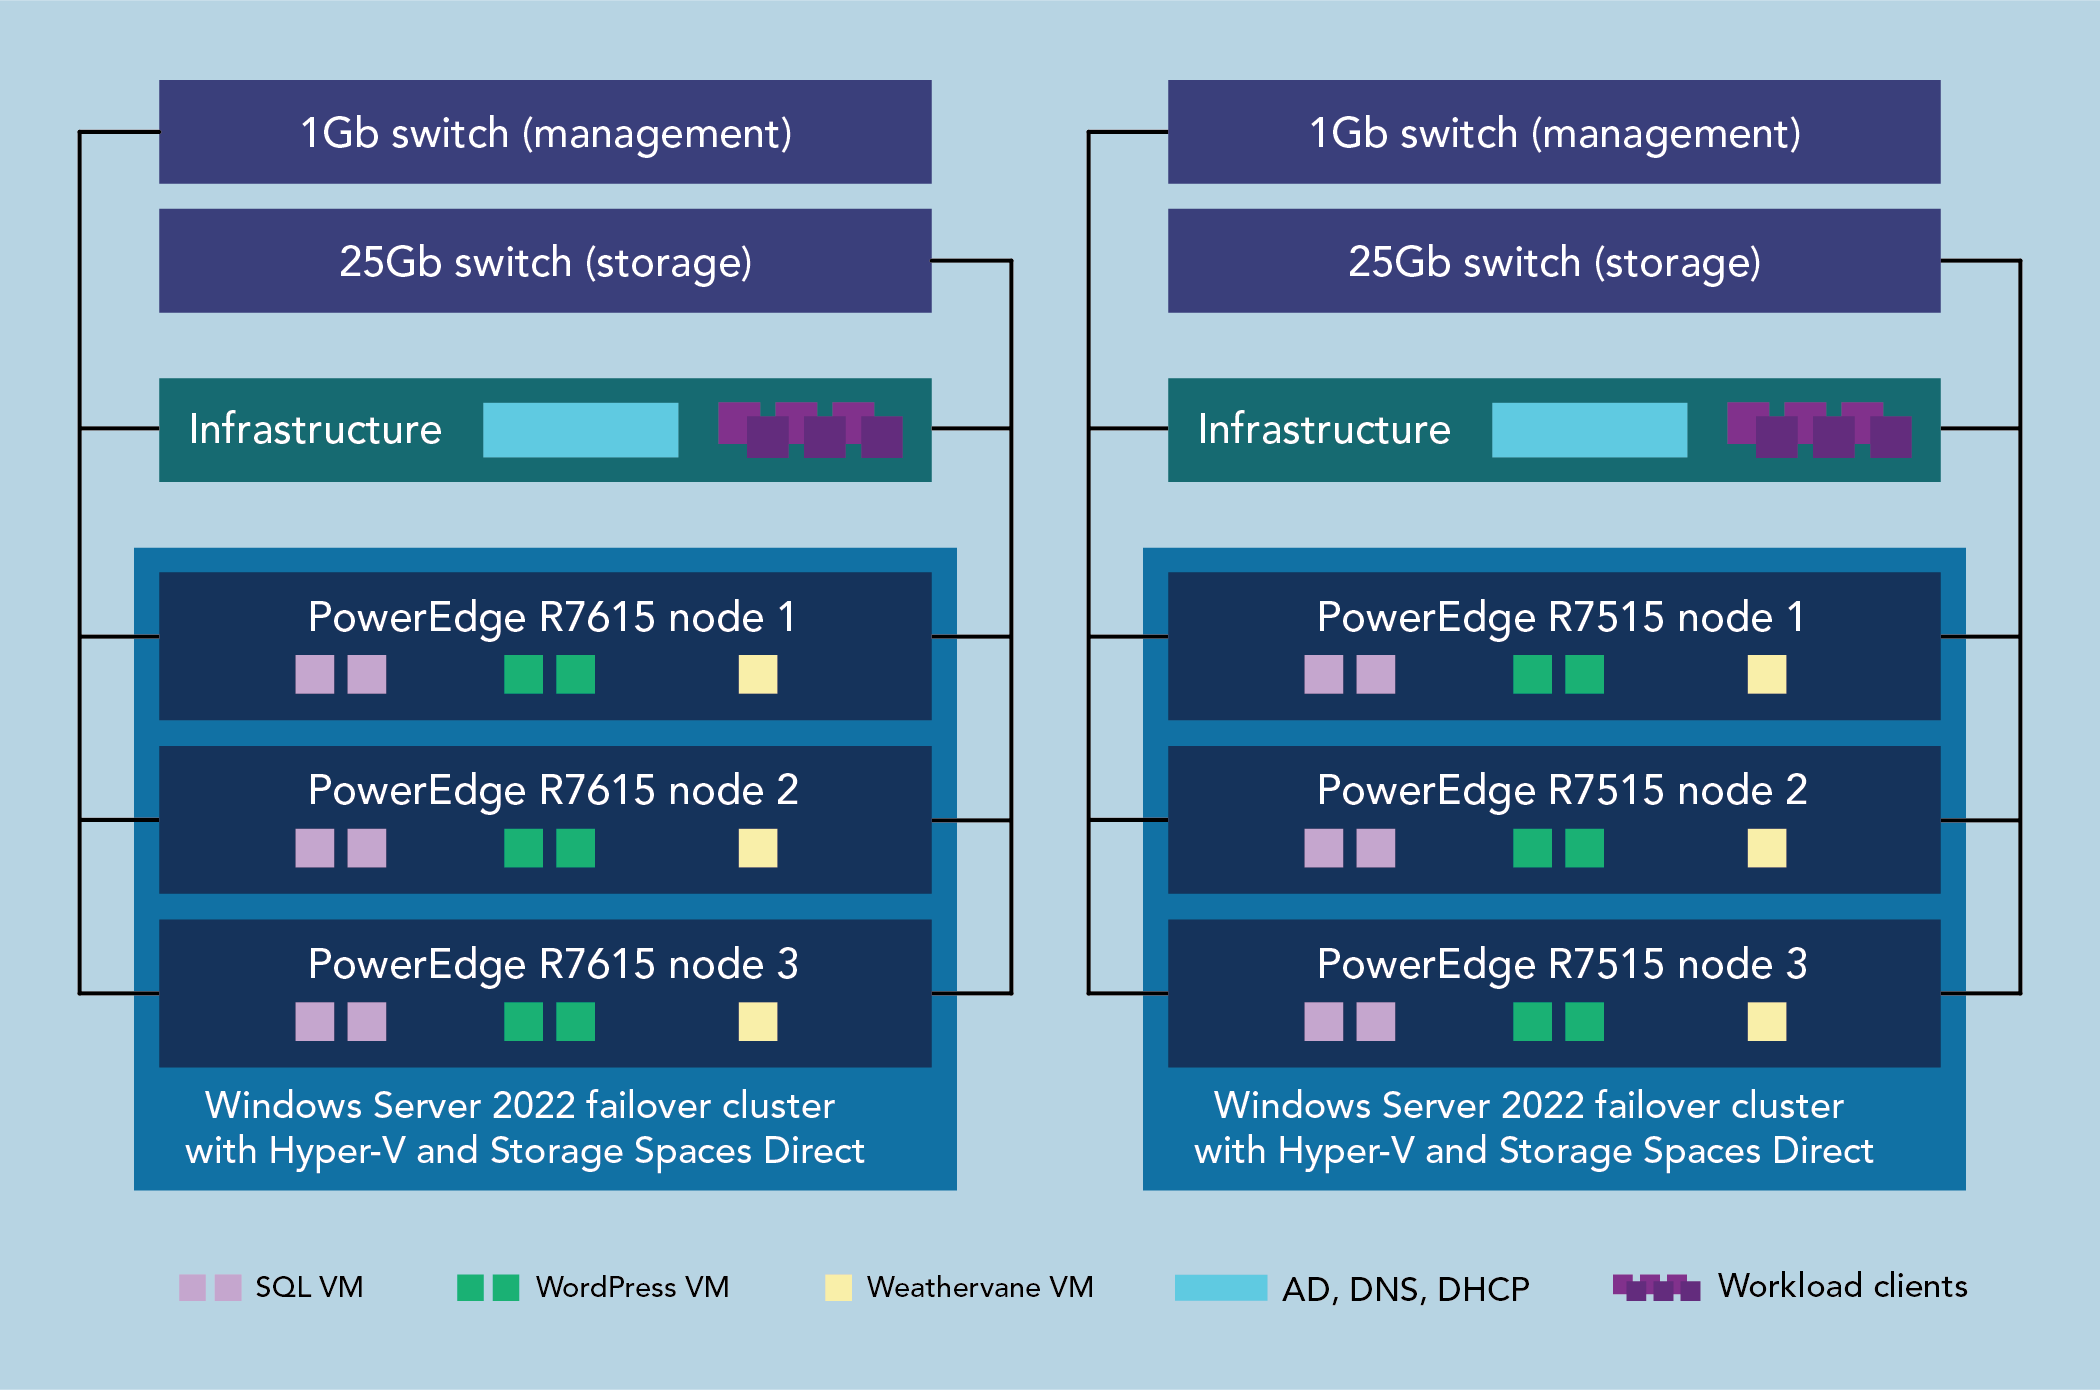
Figure 1: Test bed diagram. Source: Principled Technologies.
SQL Server with DVD Store workload
We conducted a series of tests on an OLTP workload that we set up using the DVD Store 3 benchmarking tool.[xviii] DVD Store, an open-source test and benchmark tool, emulates an online store specializing in DVD sales. The test utility simulates customers logging in, browsing products by title or author, accessing reviews, submitting new reviews, rating existing reviews, signing up for premium membership, and making purchases.
To gauge performance, the benchmarking tool generates a metric of orders placed per minute. For our testing, we generated a pre-sized database elsewhere, then restored that database backup in our environment for testing.
About AMD EPYC 9354P processors
Part of the Platform Server Product Family and the AMD EPYC 9004 Series, these 32-core, 64-thread processors have a maximum boost clock of 3.8GHz, an all-core boost speed of 3.75GHz, a base clock of 3.25GHz, and a 256MB L3 cache.[xix] These are the single-socket versions of the 64-core processors that are cost optimized for single-socket servers.
Learn more at https://www.amd.com/en/products/cpu/amd-epyc-9354p.
Kubernetes with Weathervane 2.1 benchmark
According to VMware, “Weathervane 2.1 is an application-level performance benchmark which lets users investigate the performance characteristics of on-premises and cloud-based Kubernetes clusters… by deploying one or more applications on the cluster and then driving a load against those applications.”[xx] Weathervane uses a multi-tier web application that includes both stateless and stateful services. The Weathervane benchmark provides a variety of pre-tuned configurations (i.e., deployment sizes) for the app, allowing users to select a configuration appropriate for their cluster sizing. The Weathervane workload driver generates the load and runs on a Kubernetes cluster. Users can configure Weathervane “to generate a steady load using a fixed number of simulated users, or to automatically vary the number of users to find the maximum number that can be supported on the cluster without violating quality-of-service (QoS) requirements.”[xxi]
In the fixed-load scenario, Weathervane gives the test a passing score only if the run completes without violating the QoS requirements. In the maximum-user scenario, Weathervane reports the highest number of simulated users that completed the test without violating the QoS requirements. Weathervane refers to this number as the peak WvUsers. In our testing, we used the fixed-load scenario to allow us more control over system resource utilization while running our three different workloads. We ran one Kubernetes cluster using Docker on one VM per node for a total of three Kubernetes clusters per physical cluster. We then deployed an instance of the Weathervane workload to each Kubernetes cluster.
WordPress with Siege benchmark
Siege is an open-source HTTP load testing benchmark utility designed to measure a website or multiple websites performance under stress. It can test a single URL with a set number of simulated users, or can read multiple URLs into memory and stress them simultaneously.[xxii] According to the Siege GitHub page, “Siege supports HTTP/1.0 and 1.1 protocols, the GET and POST directives, cookies, transaction logging, and basic authentication. Its features are configurable on a per user basis.”[xxiii] In our testing, we used Siege to target a default WordPress install on Ubuntu 20.04. We ran the test for 30 minutes and report the average transactions per second.
Our test configuration
We configured each cluster with the same number of VMs:
- Six OLTP (SQL Server) VMs, with two on each physical node
- Six WordPress VMs, with two on each physical node
- Three Weathervane VMs, with one on each physical node. Each of the three VMs ran containers in a single Kubernetes cluster, with a single Weathervane instance targeting that Kubernetes cluster.
We sized the VM memory to mostly fill the host capacity (192 GB and 128 GB for the 16G server and the 15G server, respectively). Table 3 provides details of our test configuration.
Table 3: Details of our test configuration.
Workload VM number and type on each node | Number of vCPUs per VM | Memory per VM (MB) | Virtual hard disk number and size per VM |
16G Dell PowerEdge R7615 | |||
2x SQL Server | 10 | 28,672 | 1x 140 GB OS 1x 140 GB DB 1x 40 GB log |
1x Weathervane | 16 | 61,440 | 1x 256 GB |
2x WordPress | 10 | 28,672 | 1x 48 GB |
15G Dell PowerEdge R7515 | |||
2x SQL Server | 10 | 16,384 | 1x 140 GB OS 1x 140 GB DB 1x 40 GB log |
1x Weathervane | 16 | 40,960 | 1x 256 GB |
2x WordPress | 10 | 16,384 | 1x 48 GB |
We ran the following parameters:
Database (DVD Store 3)
- 16 threads
- 5ms think time
- 30s run time
- 24s warmup time
- 10 users per second ramp rate
WordPress
- 25 users per VM
- 0ms think time
Weathervane
- 2,500 users per VM
About Broadcom PERC11 PERC H755N controllers
The PERC11 series of adapters presents a diverse range of notable features. To begin with, it ensures dependable, high-performance, and fault-tolerant management of the disk subsystem. These adapters possess extensive RAID control capabilities, offering support for multiple RAID levels, such as 0, 1, 5, 6, 10, 50, and 60.[xxiv] This facilitates efficient data safeguarding and redundancy mechanisms within the system.
Regarding compatibility, the PERC11 adapters conform to the Serial Attached SCSI (SAS) 3.0 standard, which facilitates a maximum data throughput of 12 Gb/sec. This adherence ensures streamlined data transfer and seamless operations within the storage environment. Furthermore, the adapters boast extensive compatibility with a wide array of storage devices. They seamlessly integrate with Dell-qualified Serial Attached SCSI (SAS) and SATA hard drives, solid-state drives (SSDs), and PCIe SSDs (NVMe).[xxv] This versatility empowers users to leverage diverse storage options that align with their specific requirements and preferences.
What testing revealed
In the sections below, we present the findings of the three workloads we ran simultaneously on our two clusters, each of which comprised three servers. We identified the highest-performing server in each cluster and present the results that server achieved on each of our three workloads.
Kubernetes/Weathervane
As we noted earlier, our Weathervane testing consisted of a fixed-user scenario with the same number of WvUsers on both clusters. With an almost identical throughput rate, response time on the highest-performing new Dell PowerEdge R7615 server was half that of the highest-performing previous-generation Dell PowerEdge R7515 server (see Figure 2). This performance advantage could translate to higher numbers of supported users, or lower latencies for a fixed set of users, improving user experience due to reduced response time while interacting with the site.
We identified the response time from the single Weathervane application on the best-performing server and present that time here.
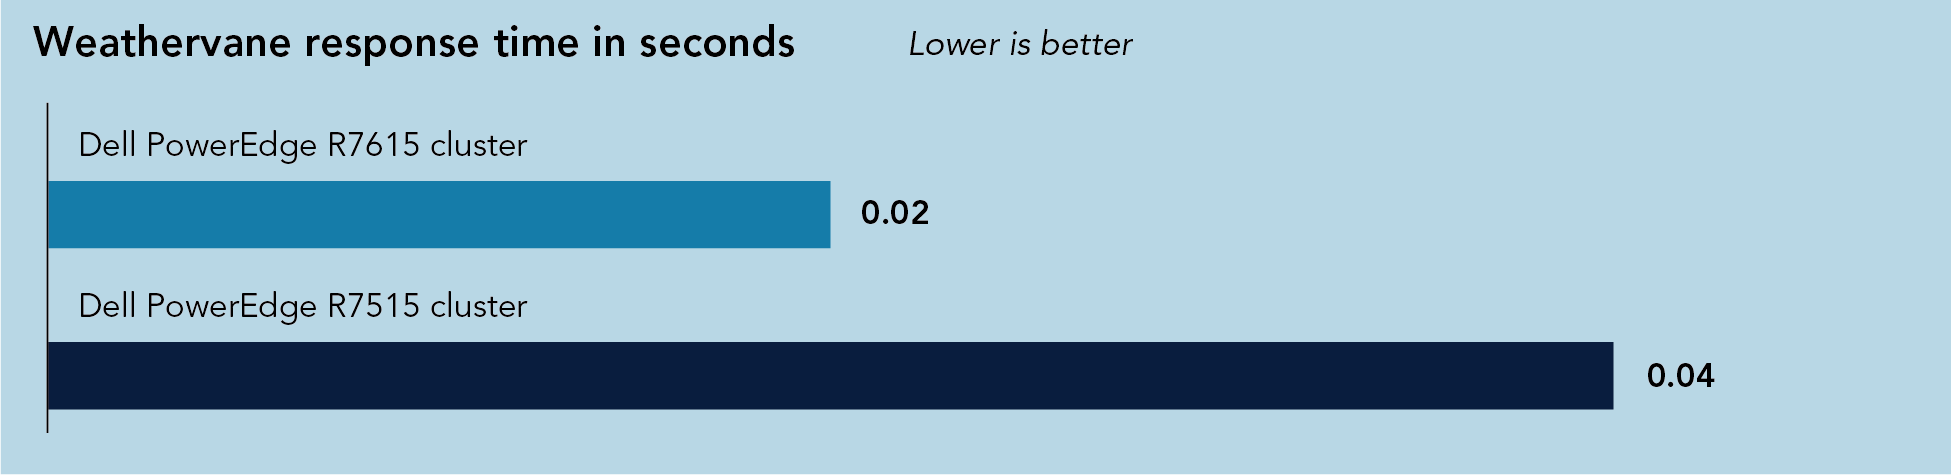
Figure 2: Weathervane response time on the highest-performing server in each cluster. Lower is better. Source: Principled Technologies.
WordPress/Siege
After we ran the Siege benchmark to measure WordPress performance, we added the transactions per second from the two VMs on the best-performing server in each cluster and present those sums here.
As Figure 3 shows, the highest-performing server in the cluster of new Dell PowerEdge R7615 servers achieved a rate of WordPress requests per second that was 27.4 percent higher than that of the highest-performing server in the previous-generation cluster. This performance advantage could translate to speedier load times, which would position your business much better in the competitive landscape where “88% of online users won’t return to a site after a bad experience.”[xxvi]

Figure 3: Total WordPress transactions per second on the highest-performing server in each cluster. Higher is better. Source: Principled Technologies.
SQL Server/DVD Store 3
After we ran the DVD Store 3 benchmark to measure SQL Server database performance, we added the orders per minute from the two VMs on the best-performing server in each cluster and present those sums here.
As Figure 4 shows, the highest-performing server in the cluster of new Dell PowerEdge R7615 servers achieved a rate of OPM that was 24.7 percent higher than that of the highest-performing server in the previous-generation cluster. This performance advantage could translate to speedier and more responsive behavior on the part of many business database applications, such as those we noted earlier—customer relationship management, inventory, and business data analysis.
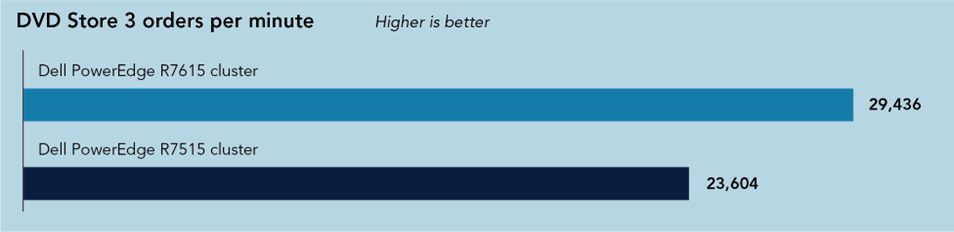
Figure 4: Total DVD Store 3 transactions per second on the highest-performing server in each cluster. Higher is better. Source: Principled Technologies.
Why was performance on the new Dell PowerEdge R7615 cluster better?
Any time you undertake a system upgrade such as the one in our test scenario, multiple factors work together to improve performance. In our testing, we saw clear advantages of the Dell PowerEdge R7615 with Dell PowerEdge RAID Controller 11 cluster on the mixed workload we tested. We can attribute a portion of this improvement to this solution’s use of latest 4th Gen AMD EPYC processors, which have a base CPU frequency of 3.25 GHz and support up to 4800 MT/s DDR5 RAM, a considerable improvement over the 2.80 GHz base CPU frequency and 3200 MT/s DDR4 RAM of the older AMD EPYC processors in the previous-generation servers. If we compare the SPEC®2017 test results for the Dell PowerEdge R7515 and Dell PowerEdge R7615 with the same processors our test servers used, we see increases ranging from 33 percent on Integer Base to 66 percent on Floating Point Base.[xxvii]
In addition to its more powerful processor, the Dell PowerEdge R7615 also has faster and more RAM with DDR5 and supports 24Gbps SAS storage. (Note that both solutions used the same SAS storage drives, which are rated for 24Gbps SAS data transfer speeds. However, the previous-generation PowerEdge R7515 supported only up 12Gbps SAS, while the PowerEdge R7615 could run at the full 24Gbps rate.)
Spotlight on licensing costs
While increased performance is a major decision in any server purchase, SMBs must also consider cost. The CAPEX of purchasing gear is unavoidable, but how does the choice of server model affect software licensing?
To answer this, we use pricing as of June 30, 2023. Let’s first look at the operating system software licensing. For Windows Server 2022 Datacenter edition, customers can purchase core-based licensing in 16-core packs for $6,155.28.[xxviii] In our testing, each previous- and current-generation server contained one 32-core processor. Therefore, if a customer were purchasing new OS licenses for either environment, they would need two of these license packs, for a total of $12,310 per server ($36,930 per cluster).
Next, let’s look at SQL Server 2022 Enterprise licensing costs. In a virtualized environment, customers have two choices: They can license all cores on a server or, if they are enrolled in the Software Assurance program, they can license by the number of vCPUs per SQL Server VM. Enrolling in the Software Assurance program offers several advantages, including software upgrades at no additional cost. Because our performance testing used only a fraction of the CPU threads for SQL Server, we are assuming enrollment in Software Assurance and using the vCPU-based pricing. Each test server had two SQL Server VMs with 10 vCPUs each, for a total of 20 vCPUs needing licenses, or 60 vCPUs per three-node cluster. SQL Server Enterprise comes in a two-core pack for $15,123.[xxix] Each cluster would need 30 of these licenses, for a total of $453,690.
As Table 4 shows, the total cost to license three servers is $613,275. Dividing this figure by three gives us $204,425, the total per-server licensing cost. After the first year, annual Software Assurance costs for a single server would be $40,885.
Table 4: Licensing and software assurance costs as of July 14, 2023.
Price of one package | Number of packages required per 32-core server with 20 vCPUs for SQL Server VMs | Licensing costs per server | Licensing costs per three-server cluster | |
Windows Server 2022 Datacenter (16-core package)[xxx] | $6,155 | 2 | $12,310 | $36,930 |
SQL Server 2022 Enterprise (2-core/vCPU package)[xxxi] | $15,123 | 10 | $151,230 | $453,690 |
Subtotal for software |
|
| $163,540 | $490,620 |
Software Assurance for 1 year (25% of software cost)[xxxii] |
|
| $40,885 | $122,655 |
Total with Software Assurance 1 year for three servers |
|
|
| $613,275 |
Total with Software Assurance 1 year for one server |
|
|
| $204,425 |
The remaining workloads used open-source software such as Ubuntu, WordPress, and Tanzu Community Edition, which are all free. While numerous support and security packages are available for these open-source solutions, we are excluding them from this analysis.
The costs above assume that customers are purchasing the license as a part of their CAPEX investment. However, customers can also choose to transfer licenses from existing servers and continue paying annual OPEX fees related to the software. As we mentioned earlier, we assume customers are enrolled in the Microsoft Software Assurance program, which provides the added benefit of fine-tuning the licensing costs related to SQL Server by licensing vCPUs instead of whole CPUs, as well as the benefit to upgrade to major software versions at no additional cost. A ComputerWorld article discusses the many additional benefits to the program.
In our cost analysis, we include Software Assurance for both Windows Server and SQL Server. The annual cost of Software Assurance for enterprise software is 25 percent of licensing costs.[xxxiii] In our comparison, the total licensing costs for each of our test clusters is $490,620, which would incur an annual fee of $122,655 if the company chose to maintain the licenses with Software Assurance. This annual fee, like all the licensing fees we have discussed, is identical for the previous-generation cluster and the current-generation cluster.
About the Broadcom Ethernet controllers in our test servers
Our testing used Broadcom Gigabit Ethernet BCM5720 and Broadcom 57414 Dual Port 10/25GbE SFP28 NICs.
The BCM5720 Dual-Port 1GBASE-T PCIe 2.1 Ethernet Controller is a 13th generation 10/100/1000BASE-T Ethernet LAN controller solution. According to Broadcom, the BCM5720 “provides a PCI Express® v2.0-compliant host interface, which can operate at 5 GT/s or at 2.5 GT/s at x2 link width.” It also has “I/O Virtualization (IOV) support for VMWare® NetQueue and Microsoft® VMQ” and also supports Energy Efficient Ethernet.[xxxiv]
Learn more at https://www.broadcom.com/ products/ethernet-connectivity/network-adapters/bcm5720-1gbase-t-ic.
The BCM 57414 Dual Port 10/25GbE SFP28 controller features two network interface ports that support both SFP28 for 25Gb/s speeds and SFP+ for 10Gb/s modules. According to Broadcom, these NICs are ideal for supporting both on-premises data centers and cloud computing backends. The BM57414 also supports advanced networking features such as SR-IOV, vSwitch acceleration, TruFlow™ flow processing, and RDMA over converged Ethernet (RoCE), the last of which we used for our Storage Spaces Direct backend.[xxxv]
For more information see : https://docs.broadcom.com/doc/957414A4142CC-DS.
How improved performance can lead to needing fewer servers, which in turn reduces licensing costs
Earlier, we discussed how the superior performance of the Dell PowerEdge R7615 on our mixed workload could improve business outcomes by delivering a speedier experience for end users, whether they are employees or current or potential customers. We then looked at licensing costs and saw that an equal number of previous-generation Dell PowerEdge R7515 servers and current-generation Dell PowerEdge R7615 servers would have the same per-server cost for Windows Server, SQL Server, and Software Assurance.
Another enormous potential benefit of choosing the current-generation Dell PowerEdge R7615 is the savings that result from a lower server count. Being able to perform a given amount of work with fewer servers can not only lead to savings on OPEX such as power and cooling and IT staffing resources, but it can reduce licensing costs as well.
Let’s take the performance results we saw on the SQL Server workload and use them as a rough proxy for the different performance levels of the two server models we tested and server counts a hypothetical company might require depending on which generation it chose. Based on the number of database orders per minute the highest-performing servers in each cluster achieved, we can set a performance level, such as approximately 90,000 OPM, that a company needs to achieve to meet service-level agreements or other criteria. Given this hypothetical requirement, a company could purchase only three 16G Dell PowerEdge R7615 servers rather than the four 15G Dell PowerEdge R7515 servers that would be necessary to perform the same level of work. Having one fewer server would save the company over $200,000 on the first year of licensing and Software Assurance costs and an additional $40,000 every subsequent year. This savings would be more than enough to offset the higher purchase price of the 16G Dell PowerEdge R7615 server. Additionally, the company would spend less on power and cooling and IT management time.
Table 5: Licensing and software assurance costs as of July 14, 2023.
15G Dell PowerEdge R7515 server | 16G Dell PowerEdge R7615 server | Difference | |
OPM achieved by highest-performing server in cluster | 23,604 | 29,436 | 5,832 |
Number of servers necessary to achieve approximately 90,000 OPM | 4 | 3 | 1 |
Licensing and Software Assurance costs for servers necessary to achieve approximately 90,000 OPM | $817,700 | $613,275 | $204,425 |
Conclusion
As you do your best to balance timing, budget, IT resources, and your current and anticipated server needs, consider how opting for newer servers could help your business. As our testing showed, there are clear benefits to choosing servers that support such workload requirements as keeping databases running at a quick pace and delivering speedy hosting for your business’s website. Plus, a solution that offers the capacity and software features to perform well while natively supporting Kubernetes containers could add value in terms of setup, flexibility, scalability, and cost-effectiveness. And you can achieve all of this and possibly reduce OPEX in the process.
In our testing with a mixed workload that reflects some of the needs common to small and medium businesses, a cluster of 16G Dell PowerEdge R7615 single-socket servers powered by 4th Gen AMD EPYC processors outperformed a cluster of previous-generation 15G Dell PowerEdge R7515 servers, with improvements of up to 27 percent and latency reduction of up to 50 percent. These results show that upgrading to the new Dell solution can be a smart step toward meeting the needs of your users now and in the years to come.
This project was commissioned by Dell Technologies.
August 2023
Principled Technologies is a registered trademark of Principled Technologies, Inc.
All other product names are the trademarks of their respective owners.
[i] Daily Mail, “Microsoft warns its cloud customers that their data may have been leaked: Flaw left system used by Coca Cola, Exxon-Mobil and other major firms exposed,” accessed June 15, 2023, https://www.dailymail.co.uk/news/article-9931351/Microsoft-warns-thousands-cloud-customers-exposed-databases.html.
[ii] Franklin Okeke, “Disadvantages of cloud computing,” accessed June 12, 2023, https://www.techrepublic.com/article/disadvantages-cloud-computing/.
[iii] Franklin Okeke, “Disadvantages of cloud computing.”
[iv] Franklin Okeke, “Disadvantages of cloud computing.”
[v] CNBC, “Google suffers widespread outage taking YouTube, Gmail and Drive apps offline,” accessed June 16, 2023, https://www.cnbc.com/2020/12/14/googles-youtube-gmail-and-drive-services-suffer-outage.html.
[vi] Tech Republic, “Disadvantages of cloud computing,” accessed June 12, 2023, https://www.techrepublic.com/article/disadvantages-cloud-computing/.
[vii] Sarah Wang and Martin Casado, “The Cost of Cloud, a Trillion Dollar Paradox,” accessed June 19, 2023, https://a16z.com/2021/05/27/cost-of-cloud-paradox-market-cap-cloud-lifecycle-scale-growth-repatriation-optimization/.
[viii] David Heinemeier Hansson, “Why we’re leaving the cloud,” accessed July 6, 2023, https://world.hey.com/dhh/why-we-re-leaving-the-cloud-654b47e0?utm_source=pocket_mylist.
[ix] WordPress, “Welcome to the world’s most popular website builder,” accessed May 22, 2023, https://wordpress.com.
[x] Kathy Haan, “Top Website Statistics For 2023,” accessed May 30, 2023, https://www.forbes.com/advisor/business/software/website-statistics/.
[xi] Chron, “Database Uses in Business,” accessed June 18, 2023, https://smallbusiness.chron.com/importance-inventory-databases-retail-40269.html.
[xii] Chron, “Database Uses in Business.”
[xiii] Chron, “Database Uses in Business.”
[xiv] Price of the AMD EPYC 9354 as of July 27, 2023 is $3,420 (source: https://www.amd.com/en/products/cpu/amdepyc-9354). Price of the AMD EPYC 9354P as of July 27, 2023 is $2,730 (source: https://www.amd.com/en/products/cpu/amd-epyc-9354P).
[xv] Dell, “PowerEdge R7615 Specification Sheet,” accessed June 12, 2023, https://www.delltechnologies.com/asset/en-us/products/servers/technical-support/poweredge-r7615-spec-sheet.pdf.
[xvi] Dell, “PowerEdge R7615 Specification Sheet.”
[xvii] Dell, “PowerEdge R7615 Specification Sheet.”
[xviii] GitHub, “DVD Store version 3,” accessed June 23, 2023, https://github.com/dvdstore/ds3.
[xix] AMD, “AMD EPYC™ 9354P,” accessed June 12, 2023, https://www.amd.com/en/products/cpu/amd-epyc-9354p.
[xx] GitHub, “VMware Weathervane,” accessed June 23, 2023, https://github.com/vmware/weathervane.
[xxi] GitHub, “VMware Weathervane.”
[xxii] GitHub, “JoeDog Siege,” accessed June 23, 2023, https://github.com/JoeDog/siege.
[xxiii] GitHub, “JoeDog Siege.”
[xxiv] Dell, “Dell PowerEdge RAID Controller 11 User’s Guide PERC H755, H750, H355, and H350 Controller Series— Features of PERC H755 adapter,” accessed June 28, 2023, https://www.dell.com/support/manuals/en-do/poweredge-r6525/perc11_ug/features-of-perc-h755-adapter?guid=guid-cffca2d6-0c40-4971-a8bd-720894a607da&lang=en-us.
[xxv] Dell, “Dell PowerEdge RAID Controller 11 User’s Guide PERC H755, H750, H355, and H350 Controller Series—Technical specifications of PERC 11 cards,” accessed June 28, 2023, https://www.dell.com/support/manuals/en-ae/poweredge-r7525/perc11_ug/technical-specifications-of-perc-11-cards?guid=guid-aaaf8b59-903f-49c1-8832-f3997d125edf.
[xxvi] Forbes Advisor, “Top Website Statistics For 2023,” accessed May 30, 2023,
https://www.forbes.com/advisor/business/software/website-statistics/.
[xxvii] SPEC, “SPEC/OSG Result Search Engine,” accessed July 6, 2023, https://www.spec.org/cgi-bin/osgresults.
[xxviii] Microsoft, “Pricing and licensing for Windows Server 2022,” accessed June 27, 2023,
[xxix] Microsoft, “SQL Server 2022 pricing and licensing,” accessed June 27, 2023, https://www.microsoft.com/en-us/sql-server/sql-server-2022-pricing#tabx9ffaf699af8e49b58e3f6945759435c4.
[xxx] Microsoft, “Pricing and licensing for Windows Server 2022,” accessed June 27, 2023,
[xxxi] Microsoft, “SQL Server 2022 pricing and licensing,” accessed June 27, 2023, https://www.microsoft.com/en-us/sql-server/sql-server-2022-pricing#tabx9ffaf699af8e49b58e3f6945759435c4.
[xxxii] Carol Sliwa, “Microsoft boosts benefits for Software Assurance agreement holders,” accessed June 27, 2023, https://www.computerworld.com/article/2570252/microsoft-boosts-benefits-for-software-assurance-agreement-holders.html.
[xxxiii] Carol Sliwa, “Microsoft boosts benefits for Software Assurance agreement holders.”
[xxxiv] Broadcom, “BCM5720 - Dual-Port 1GBASE-T.” accessed June 8, 2023,
https://www.broadcom.com/products/ethernet-connectivity/network-adapters/bcm5720-1gbase-t-ic.

Upgrade to the PowerEdge R7625 featuring PERC 12 and get better Oracle Database Performance
Mon, 13 Mar 2023 21:20:27 -0000
|Read Time: 0 minutes
Many factors can impact Oracle Database performance, and optimizing performance often requires a combination of strategies. Here are a few things that can help improve Oracle Database performance, but none more than the hardware:
- Hardware: Ensure your hardware meets the recommended requirements and expectations for running the database. This includes CPU, memory, disk space, and raid controllers. Other factors can also include:
- Indexing: Create indexes on frequently accessed columns to improve query performance.
- Tuning: Regularly tune the database parameters to ensure optimal performance. This includes adjusting the buffer cache, sorting area, and network packet size.
- Partitioning: Consider partitioning large tables to improve query performance.
- Compression: Consider using compression to reduce the size of the database and improve I/O performance.
- Clustering: Implement clustering to distribute the load across multiple servers.
- Query optimization: Optimize SQL queries to reduce the number of I/O operations required.
- Data archiving: Archive old or infrequently accessed data to improve query performance.
Note that the best approach for improving Oracle Database performance will depend on your specific environment and hardware to enhance the workload.
This study analyzes the benefit of migrating from legacy Dell™ PowerEdge™ R7525 servers running Oracle Database to the Dell PowerEdge R7625, including AMD Epyc 4th generation processors equipped with a PERC 12. We also analyzed the average CPU IOWait times.
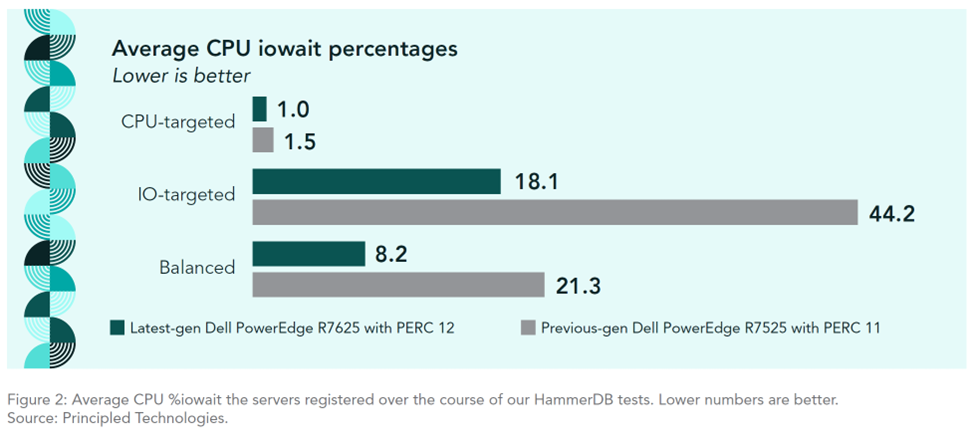
We found that the Dell PowerEdge R7625 will let you support more customers and realize better system efficiency, which could lead to savings related to server consolidation.
- CPU-targeted: Retailers with a small list of tiered options with high throughput (1.46 x the New Orders Per Minute)
- IO-targeted (storage): Online retailers with medium-to-large product selections (2.39 X the new orders per minute)
- Balanced CPU/IO: Retailers with smaller product inventory and medium throughput (1.71 X the new orders per minute)