
Third-party Analysis

Applying Digital Twin and AMR Technologies for Industrial Manufacturing
Mon, 29 Apr 2024 15:35:04 -0000
|Read Time: 0 minutes
Globally, there are millions of factories and industrial facilities running around the clock, often with highly complex processes in potentially dangerous environments. By leveraging Digital Twin and AMR technology, organizations can further optimize and monitor these processes, resulting in safer factory environments, less downtime, and greater quality control.
Traditionally, complete physical replicas of manufacturing facilities or mockups of industrial environments are created to test failure scenarios which are impossible to test in a production environment. These physically accurate and photoreal simulations of the actual environment are referred to as ‘Digital Twins.’
Digital Twin, AI, and Autonomous Mobile Robot(s), or AMR, technology has the potential to reduce cost by eliminating the need to create these ‘analog twins’ and instead model these environments in a digital space. Additional functionality, including detecting anomalous or hazardous conditions within factory and industrial environments, such as fires, spills, or broken machinery using AMRs, is possible. However, to detect hazardous conditions, defects, or safety events, a complete Digital Twin ecosystem that includes an array of hardware, software components, and models needs to be brought to bear.
The Proof of Concept detailed here serves as a specific use case that explores a theoretical practical deployment of these concepts and technologies as applied to an Oil and Gas Industrial Environment. Also provided is a github repo that allows for exploration and experimentation with the components and code developed for this PoC.
This challenge introduces an ideal use case for combining AI with Metaverse technology. By leveraging Digital Twin factory environments with the Omniverse, organizations can train on synthetic data for object or hazard detection and test equipment failures and hazardous events while maintaining accuracy in their specific environments. These trained and validated solutions can then be deployed in physical factory settings.
This PoC serves as a use case of a Dell Validated design, which has been created to clarify and provide clear context and a conceptual framework for understanding the building blocks of Digital Twins and their use cases. This DVD provides a rigorous technical explanation of each discreet technology behind a deployment of an Ominverse powered Digital Twin. This DVD is available on the Dell Design Hub here: https://infohub.delltechnologies.com/en-us/t/digital-twin-journey-computer-vision-ai-model-enhancement-with-dell-technologies-solutions-nvidia-omniverse/
The following PoC solution demonstrates one such strategy for a readily deployable AI-powered manufacturing solution developed using a digital twin Metaverse.
Solution Brief
Scalers AI, in collaboration with Dell and Broadcom, has showcased an AI-driven application designed for the manufacturing industry. The proof-of-concept developed by this partnership aims to identify risks in an industrial environment and offer predictive upkeep for factory machinery. The solution is particularly tailored to spot chemical leaks on the factory premises and detect bearing anomalies in industrial compressors. An overview of the PoC solution is as follows:
- An offshore Oil and Gas Rig digital twin is created with NVIDIATM Omniverse. Simulated chemical spills are distributed across this virtual offshore Oil and Gas environment.
- Virtual Autonomous Mobile Robots (AMRs) are strategically placed across the factory floor in the simulation. These robots stream video data to an AI-powered image detection system that has been trained to identify chemical spills.
- Data from sensors on virtual compressors, positioned in the Metaverse, is gathered periodically and shared via the OPC Unified Architecture (OPC UA). An analytics module, driven by machine learning, processes this data to identify any bearing defects.
- A visualization dashboard provides monitoring and alerting of both chemical spill detection and compressor failure. The dashboard includes direct views from AMR cameras, a map of the factory floor with live AMR locations, chemical spill incident logs, and a time series graph of compressor failures. Alerts of hazards are displayed on the dashboard and can additionally be sent as mobile notifications
A high-level overview of the PoC solution can be found in Figure 3.
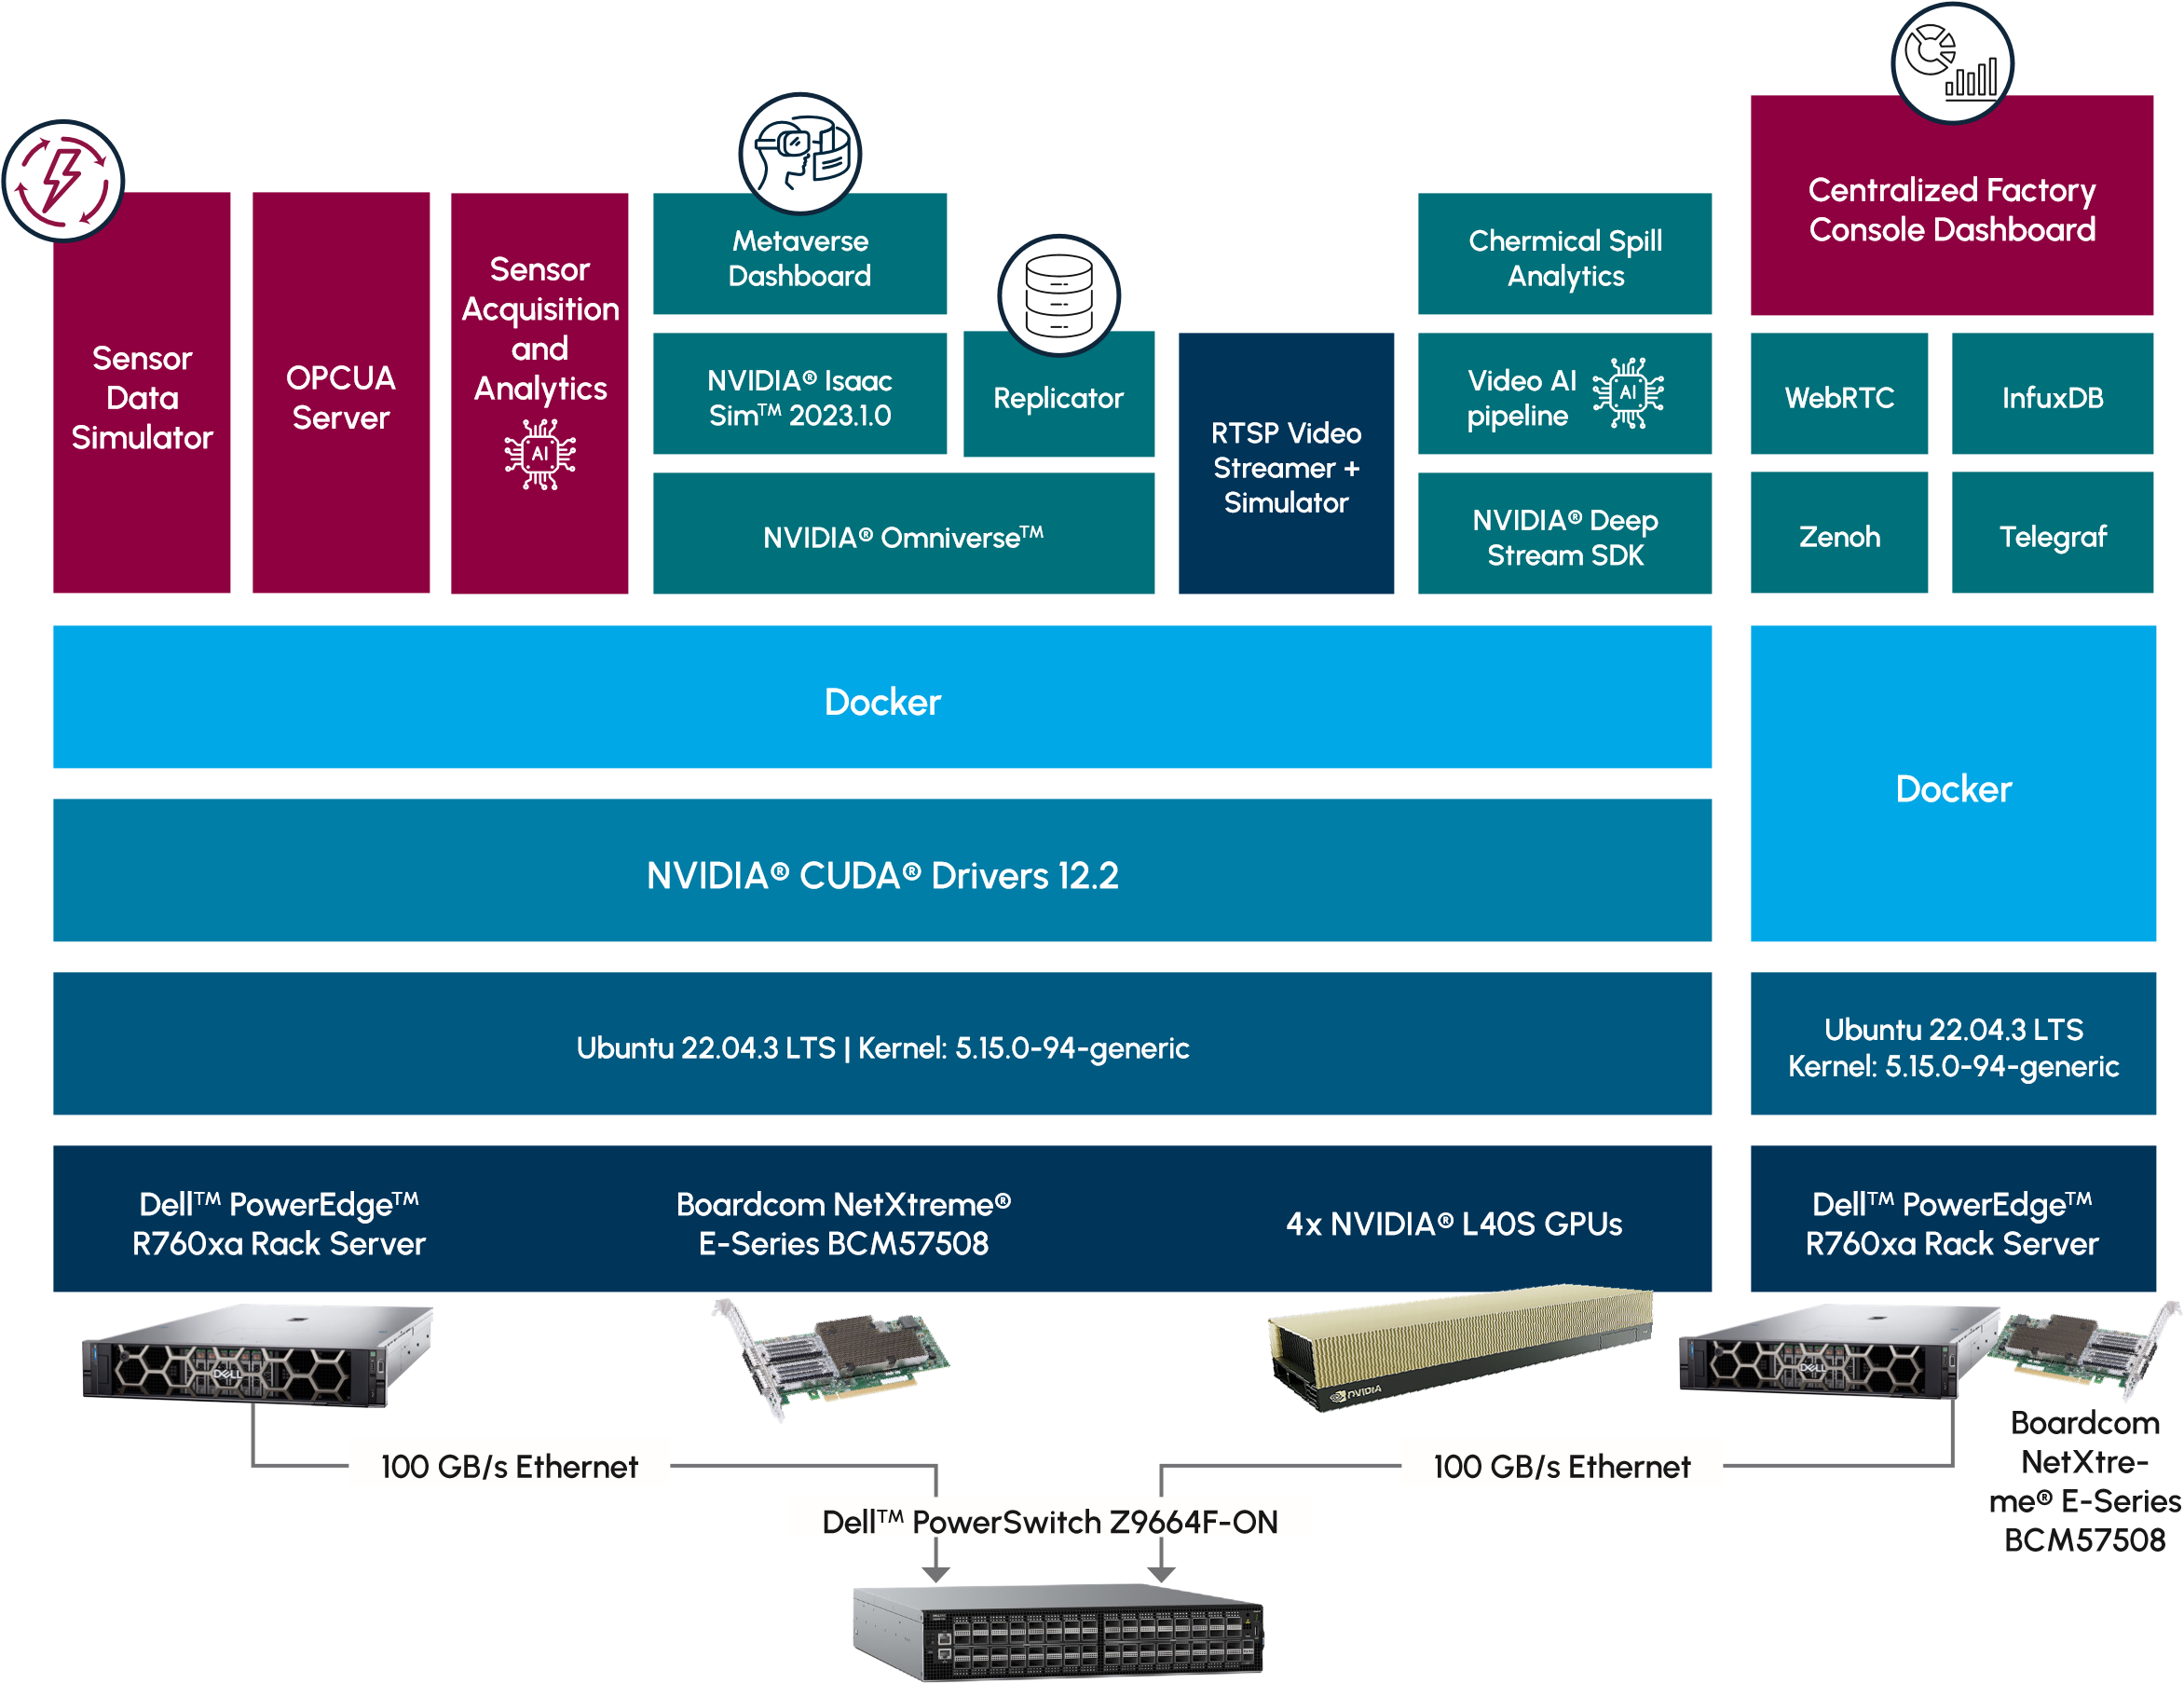
Figure 3: Solution Overview (Source: Scalers AI)
The key hardware components used in the solution included the following:
Key Takeaways
This PoC solution illustrates novel and valuable technologies for AI practitioners and IT operations and decision makers working in industrial and manufacturing environments. Notable highlights from the solution include:
- Showcasing a feasible AI solution for industrial settings, made possible by Dell PowerEdge and utilizing NVIDIA Omniverse for the generation of training data and testing of the implementation. The Metaverse solution can be adapted to a real-world factory scenario.
- The capabilities for detecting equipment failures and predictive maintenance, powered by AI, are facilitated using data from machine sensors and the OPC UA protocol, which is frequently used in industrial settings.
- The proof-of-concept takes advantage of the GPU-rich Dell R760xa servers equipped with NVIDIA L40S GPUs. These servers facilitate the simulation of the Metaverse, video processing, and AI inferencing. A modular architecture connects the AI pipeline and visualization dashboard over high-bandwidth Broadcom Ethernet for a highly scalable solution.
Conclusion
The application of AI technology in industrial settings offers substantial potential to streamline operations, improve safety measures, and minimize expensive operational interruptions. However, despite the promising benefits, manufacturing firms face numerous hurdles when implementing new AI solutions. These challenges span from comprehending the hardware prerequisites and integrating the solution with existing systems to feasibly creating and testing solutions without causing disruptions in active factory environments. This proof-of-concept illustrates how these obstacles can be overcome by harnessing the innovative Metaverse technology in conjunction with robust hardware from Dell, NVIDIA, and Broadcom.

How Dell and Broadcom can help you make the transition to IPv6
Thu, 14 Mar 2024 16:56:04 -0000
|Read Time: 0 minutes
IPv4 vs. IPv6: How we got here
As the internet grew and commercialized late last century, it became increasingly clear that Internet Protocol version 4 (IPv4) limitations would eventually present issues. Enter Internet Protocol version 6 (IPv6) in the 1990s. Despite the technology’s age, its adoption has been slow in the US. Until very recently, many companies and other entities still primarily used IPv4, as shown by IPv6 adoption trackers such as one from Google.[1] Recently, however, the transition to IPv6 has been ramping, as some of those IPv4 limitations—such as the dwindling pool of available IPv4 addresses—are quickly becoming reality. One effort to encourage this transition includes a 2020 mandate from the U.S. Office of Management and Budget (OMB) requiring federal government agency devices be at least 80 percent IPv6-only by 2025.[2]
Regardless of mandates or address pools, there are a host of other reasons to choose IPv6 over IPv4. IPv6 includes features such as support for larger packets and multicasting, simpler header formats, smaller routing tables, and the elimination of the network address translation (NAT) process—all of which can increase performance over IPv4 in certain use cases. IPv6 also has built-in end-to-end encryption and name resolution protocol enhancements that contribute to better base security than IPv4.
Despite the advantages of using IPv6, some companies have resisted transitioning because it’s not a small undertaking. In this paper, we explain why making the transition can be worth the investment and introduce a solution to help make the transition easier: Dell and Broadcom™ combine to have one of the first IPv6-only compliant end- to-end solutions. We also present the results of our testing, including performance advantages for IPv6 over IPv4 on read workloads and larger performance increases for IPv4 and IPv6 available by enabling the Offload feature in the Broadcom network interface cards (NIC).

Why organizations are shifting to IPv6
The transition to IPv6 has been a long, slow process that is complicated by the fact that IPv4 and IPv6 are not compatible, requiring companies to either choose just one or manage two networks via dual stack. For many companies, however, fully abandoning IPv4 is not an option. Doubling the number of networks you deploy means doubling the security concerns and hardware expenses. Additionally, applications built on IPv4 may need rebuilding or updating to work with IPv6. Despite these factors, we believe these complications to be worth the benefits you gain from taking advantage of the IPv6 landscape. Not only could organizations use the features we mention above, but as more companies and users move to IPv6, it will also be easier for others to follow. Thus, IPv6 will grow more valuable over time. In time, we hope this can lead to companies being able to shed their IPv4 network, leaving the single, more efficient IPv6 network in place.
Below, we detail some of the reasons to transition to IPv6 including current issues with IPv4, specific industries or government agencies with particular IPv6 requirements, and the benefits of IPv6.
The shortage of IPv4 addresses
One of the most important reasons for the push to transition to IPv6 is the limited number of possible IPv4 addresses. The IPv4 address space is a 32-bit field, meaning there are a total of 232, or roughly 4.3 billion, possible IPv4 addresses. As of November 2019, this address space was officially depleted, meaning there are no new IPv4 addresses to obtain.[3] This has created a premium on IPv4 addresses, allowing companies to sell or lease their addresses, increasing the costs of buying an IPv4 address. Amazon Web Services (AWS), for example, is adding a charge to every IPv4 address on its platform, citing a 300 percent cost increase of IPv4 addresses over the past 5 years.[4] Several workarounds for this problem exist, such as NAT, which allows organizations to map several private addresses within a local network to a single public address before transferring information to the internet. However, NAT comes with its own share of problems that can affect the performance and reliability of network applications. By adding an extra layer of translation and processing, NAT can introduce latency, errors, or packet loss.[5]
IPv6, by utilizing a 128-bit address field, increases available IP addresses to roughly 2128, or ~3.4*1028, essentially solving the address limitation for the foreseeable future. Companies that work with the Internet of Things (IoT), virtual reality (VR), self-driving vehicles, telecom, and other technologies requiring many IP addresses could avoid the IPv4 address market and limited address availability by moving to IPv6.
The federal government gets involved
US federal government agencies also find themselves impacted by the Office of Management and Budget (OMB) mandate, which claims that “full transition to IPv6 is the only viable option to ensure future growth and innovation in Internet technology and services.”[6] The latest version of the mandate states that running dual stack IPv4 and IPv6 networks, as previous versions of the mandate dictated, is too complex and no longer necessary. Instead, this new mandate requires IPv6-only networking, outlining four actions agencies must take:
- Create an IPv6 project team.
- Create and publish an agency-wide policy that states their intentions to phase out all IPv4 use and make all federal IT systems IPv6 enabled by the end of 2023.
- Identify and test at least one IPv6 pilot by the end of 2021.
- Develop a plan by 2021 for implementing IPv6-only networking, with milestones including at least 50 percent of IP-enabled assets, transitioned to IPv6-only by the end of 2023, and 80 percent on IPv6-only networks by the end of 2025.[7]
This means that by the end of the first quarter of 2024, federal agencies should already have half of their systems converted to IPv6-only, and the rest fully transitioned in just two more years.
Telecom and ISP industries are leading the way
With the development of the 5G cellular network and its need for high speeds and low latencies, much of the telecom industry has already converted to IPv6. As more and more devices connect over cellular networks with 5G, the increased address pool of IPv6 provides another benefit for internet service providers (ISPs) and cellular network companies. Additionally, the built-in quality of service (QoS) field in the IPv6 header allows ISPs to prioritize voice traffic over other traffic less vulnerable to latency such as http, SSH, and more. According to Akamai, a content delivery network and cloud computing company, ISPs and telecoms such as Comcast Cable, Verizon Business, AT&T, and T-Mobile have all reached IPv6 adoption above 70 percent—T-Mobile has as much as 92.7 percent IPv6 adoption.[8]
As these network providers continue to expand the IPv6 backbone, and mobile app developers continue to embrace IPv6 advantages, the rest of the world’s industries will lag behind if they continue to rely on IPv4.
How IPv6 helps your business
Even if you don’t need a wide range of IP addresses or aren’t part of the government mandate or the telecom industry, there are still benefits you can see from transitioning from IPv4 to IPv6. First, IPv6 could increase performance in several ways, mostly by increasing network efficiency. Second, IPv6 can offer some additional security benefits over IPv4. While IPv4 has had more security upgrades and patches to existing networks—simply by virtue of existing longer—the features that come with IPv6 offer stronger baseline security, which we examine in the following pages. Increased use and investment in IPv6 security enhancements should quickly close any existing gap between it and current IPv4 network security.
IPv6 can also improve network performance over IPv4 by using a more simplified header that takes less time and fewer resources to process. All IP packets include headers that contain the necessary information for proper route allocation and delivery. Much like the parts of a physical address tell postal workers the house, street, city, and country the letter originated from and is destined for, the IP header includes such information as the IP addresses of the source and destination devices, the version indicator, the total length of the packet, and other important information. Instead of requiring routers to perform a header checksum to ensure data integrity of every packet, IPv6 relies on Transmission Control Protocol (TCP), User Datagram Protocol (UDP), and other existing protocol checksums. Additionally, this header allocates optional and non-essential header fields to header extensions, leaving only the most vital information in the header for processing. This practice increases the efficiency of processing data packets across the network by getting the metaphorical “letter” to the right “building” quickly and letting the extension headers then direct it more specifically, to the equivalent of the correct suite, floor, or person.
IPv6 also eliminates the need for NATs as each device on an IPv6 network can have its own unique IP address. If devices aren’t having to share IP addresses, then the routers do not need to translate the network addresses to send the packet to the correct device, thus eliminating a step in the data transmission process. Finally, while the Maximum Transmission Unit (MTU) technology limits packet sizes in many networks to 1,500 bytes, IPv6 networks are capable of much larger packet sizes, up to 4 GB. IPv4 packets, on the other hand, are limited to much smaller theoretical maximums of 64K bytes.[9]
Another way that IPv6 increases network efficiency is with its ability to multicast instead of broadcast. On IPv4, data transmission is broadcast: When a packet leaves a source device, the information is sent to every host connected to the network. Every single host, in turn, checks the packet to see if the data is meant for it. IPv4 is like a kid yelling out, “Mom!” at a crowded playground, causing every mother in the vicinity to stop and check if their child is the one in need. IPv6, on the other hand, uses multicast, which is the ability to transmit a packet only to the device or devices for which it is intended. Now, instead of a child yelling, “Mom!” into a crowd, IPv6 taps their parent on the shoulder and talks directly to them, allowing the other moms to focus on their own children.
IPv4 routing tables, the list of networks and other links a router consults to determine where a packet should go, are quite large—and they continue to grow. The larger the table, the longer it takes to search and find the relevant data. While IPv4 addresses and networks can be difficult to aggregate or simplify, the structure of the IPv6 address allows for just that. The IPv6 address contains three parts: the network or site prefix, the subnet ID, and the host or interface ID.[10] Routers use a site prefix to route the packet through the internet. Network creators and ISPs can also use site prefixes to create packet groups that aggregate packets going in the same general direction. Aggregating the IPs like this allows the internet and routers to act similarly to public transportation. A person boards the train at a specific stop, rides it to another stop, then leaves the train and follows the maps to the exit nearest the actual destination they have in mind. With IPv6, packets behave similarly, where several packets with completely different final destinations can all “exit” the internet at the same stop and travel more granularly from there. This behavior allows for smaller, more efficient routing tables, speeding up the routing process and lowering the overhead on router hardware.
As we mentioned above, comparing IPv4 and IPv6 security isn’t completely straightforward, as professionals have invested more time and effort into the older IPv4 network. However, IPv6 has the potential to be more secure than IPv4 due to at least two built-in advantages. First, IPv6 has end-to-end encryption and authentication built in via default Internet Protocol Security (IPsec) inclusion. While enabling IPsec on IPv6 networks may not be mandatory in some places, implementing it provides better security.[11] The second way IPv6 enhances security is simply by being much larger. With its more numerous IP addresses, IPv6 networks are nearly impossible to brute-force scan.[12]
One more benefit of IPv6 is the ability for users to implement stateful or stateless configurations. While IPv4 network devices rely heavily on dynamic host configuration protocol (DHCP) devices to assign IP addresses, IPv6 networks can use the stateless address auto configuration (SLAAC) technology to let devices generate their own IPs without manual application or the use of a third-party device such as DHCP. If users prefer to use a stateful network, IPv6’s version of DHCP is available.
The NIST and transitioning to IPv6
According to the National Institute of Standards and Technology (NIST), “the IPv6 protocol
suite offers a vastly greater address space than IPv4 and supports significant new capabilities necessary to enable modern network environments.”[13] To facilitate this transition, the NIST National Cyber-security Center of Excellence (NCCoE) “is planning a project to provide guidance and reference architecture that address operational, security, and privacy issues associated with the evolution to IPv6-only network infrastructures.”[14]
The project aims to provide enterprise organizations attempting to transition to IPv6 with guidance and tools that will “ensure that evolving enterprise IT environments to be IPv6-only can be accomplished in a secure and robust manner.”[15]
Regardless of the size of your network, the NIST Cybersecurity Practice Guide will provide best-practices and documentation to ensure that your transition to IPv6 is secure. For more information about the transition resources available from the NIST, visit https://www.nccoe.nist.gov/projects/IPv6-transition.
How Dell servers and Broadcom NICs can help on your journey to IPv6
The National Institute of Standards and Technology (NIST) is part of the U.S. Department of Commerce and serves to support and promote technology and science innovation and investment.[16] In addition to mandating that government agencies switch to IPv6-only networks, the OMB has mandated the NIST to create a set of standards and tools to support the transition. The resulting U.S. Government IPv6 (USGv6) Program develops, tests, and maintains IPv6 standards to help companies and government agencies ensure successful IPv6 transitions and deployments. Vendors can use the IPv6 tests and certifications that NIST developed to certify that their products meet the requirements and standards defined by NIST’s program.[17] In response to the 2020 OMB mandate for all government agencies, NIST revised their USGv6 program to include several objectives including updating specifications to add new and remove old technologies and streamlining their testing program based on previous experience.[18] With a set of agreed upon standards, definitions, and requirements, NIST and the USGv6-r1 provide OEMs a way to ensure their customers that their products are ready for IPv6 implementation.
Dell Technologies™ is the first company to offer a full USGv6-r1 certified server and storage stack for IPv6-only networking.[19] Dell’s certifications include:
- Dell™ PowerEdge™ servers – first in the industry to be fully IPv6 Ready Logo 5.1.2 compliant with RedHat 8.4 and Windows 2019 and 2022.
- Dell PowerEdge iDRAC9 with FW version 5.10.0.00 – first baseboard management controller (BMC) validated by USGv6-r1 as IPv6-only compliant.
- Unity-XT storage array – first storage product validated by USGv6-r1 as IPV6-only compliant meeting the requirements in the IPv6-Only Functional v1.1 (36277) profile.[20]
- Additionally, PowerStore, PowerEdge with VMware 8.0.1, and PowerEdge with SUSE SLES15 SP4 are on the USGv6-r1 registry.
Additionally, Dell servers and storage leverage Broadcom NICs and Adapters to ensure network performance and security for IPv6 customers. Broadcom NICs such as the Broadcom BCM957508-P2200G dual-port 100GbE NIC include several IPv6 offloads that can boost network performance.[21] These offloads allow the NIC to directly handle some of the computational needs of the network rather than use the OS stack, which can provide lower latencies and lower CPU utilization dedicated to network traffic.[22] Broadcom BCM957508-P2200G dual-port 100GbE NICs also offer features such as NVME over Fabrics (NVMe-oF) capabilities that allow NVMe storage traffic to travel through network instead of directly through PCIe channels. NVMe-oF allows users to connect storage via Ethernet (TCP), Fibre, and RDMA.[23] This rerouting of storage network allows for extremely low latency to get the most out of NVMe-based storage.
To show how Dell and Broadcom can provide one great hardware stack option for your IPv6 needs, we conducted some testing to highlight the performance you can expect with IPv6-connected Dell PowerEdge R660 servers to a PowerStore 1200T storage array using 100GbE Broadcom 57508 NICs.
Broadcom NICs
Broadcom NICs can serve most networking needs because they offer speeds ranging from 1G to 200G. According to Broadcom, their network cards feature:
- “Low power adapters and controllers with outstanding thermal performance
- Low latency and high throughput RoCEv2 [for] ground-breaking performance
for machine learning, HPC and
storage applications - Broadsafe™ embedded security [for] Silicon Root of Trust and attestation delivering industry’s most secure Ethernet controller
- Modern architecture [that] delivers industry’s lowest latency and lowest CPU utilization for real-world network conditions
- TruFlow™ engine [to accelerate] virtual switch processing, reduces server CPU usage
- TruManage™ [for] end-user manageability needs to allow fine-tuning of networks for maximum performance
- On-chip tunneling protocol processing for Geneve, VXLAN, and NVGRE [that] provides up to a 5x throughput increase
- Acceleration engines for SDN and NFV [to] enable leading-edge service provider solutions”[24]
Measuring performance
The goal of our performance testing was to show the benefits of the USGv6-r1 IPv6-only certified Dell PowerEdge server and Broadcom NIC solution. This included investigating the performance differences between IPv4 and IPv6 in a real-world environment. Most North American users continue to rely on IPv4, which typically requires NAT or packet fragmentation support from a network router.[25] In a typical scenario, a routing device need only read an IPv4 packet to determine its destination and send it on its way. In the case of IPv4 using NAT or requiring packet fragmentation, the routing device must modify the packet before it can send it along, which requires overhead. We wanted to quantify the impact of this overhead on network performance.
Other than the Layer 3 protocol, every aspect of the test scenario was the same. We used Linux standard tools and NVMe/TCP and/or NFS transport protocols for this test. We did not attempt to enable the best speed of each of these protocols; rather, we used those protocols to drive the tests to compare any differences in speed based on the journey of that data provided by Layer 3 (IP).
We configured two Dell PowerEdge servers as SUSE Linux Enterprise Server 15 SP4 hosts, sending data of diverse sizes to a Dell PowerStore storage array using the transport protocols we identified earlier. The data traversed multiple switches we configured to provide Border Gateway Protocol (BGP) routing and packet fragmentation within a heterogeneous multi-hop network.
We configured the host networks using an MTU of 9,000, with a 1,500 MTU on the switches emulating the core network (which forced packet fragmentation). The edge switches used BGP routing to communicate with the core network.
Comparing IPv6 and IPv4 performance without the Broadcom Offload feature
First, we tested the relative performance of IPv6 and IPv4 on a write workload with the Broadcom Offload feature off. Table 1 presents the results. In terms of both performance (IOPS and throughput in MB per second) and CPU utilization, we observed approximate parity between the two IP versions at both block sizes we tested.
Table 1. IPv6 vs. IPv4 performance on a write workload with Offload off. Higher IOPS and MB/sec and lower CPU utilization are better. Source: Principled Technologies.
Write workload, Offload off |
|
|
| |
IP version | Block size | IOPS | MB/sec | Percentage CPU utilization |
IPv4 | 256K | 8,696.1 | 2,174.01 | 4.9 |
IPv6 | 256K | 8,752.1 | 2,188.02 | 4.9 |
IPv6 % improvement | 0.64% | 0.64% | 0.00% | |
IPv4 | 64K | 34,862.7 | 2,178.92 | 6.6 |
IPv6 | 64K | 34,972.1 | 2,185.76 | 6.5 |
IPv6 % improvement | 0.31% | 0.31% | 1.51% | |
Next, we ran the same test using a read workload. As Table 2 shows, in contrast to the comparable performance we observed on the write workload, IPv6 had a performance advantage over IPv4 on the read workload. At the larger block size of 256K, IPv6 delivered 13.83 percent greater performance. At the smaller block size of 64 K, IPv6 delivered 9.83 percent greater performance. These results indicate that users in a real-world setting would enjoy better performance by using IPv6. We also observed a CPU utilization improvement for IPv6.
Table 2. IPv6 vs. IPv4 performance on a read workload with Offload off. Higher IOPS and MB/sec and lower CPU utilization are better. Source: Principled Technologies.
Read workload, Offload off |
|
|
| |
IP version | Block size | IOPS | MB/sec | Percentage CPU utilization |
IPv4 | 256K | 19,987.8 | 4,996.95 | 14.1 |
IPv6 | 256K | 22,752.4 | 5,688.09 | 13.6 |
IPv6 % improvement | 13.83% | 13.83% | 3.54% | |
IPv4 | 64K | 73,194.1 | 4,574.63 | 13.9 |
IPv6 | 64K | 80,392.4 | 5,024.53 | 12.5 |
IPv6 % improvement | 9.83% | 9.83% | 10.07% | |
Measuring the impact of the Broadcom Offload feature on IPv6 performance
A secondary component of our testing was investigating the capabilities of the Broadcom IP Offload feature. IP Offloading is a feature Broadcom has implemented in its NIC (Layer 2) to process IP (Layer 3) data to offload the processing of this data from the OS/CPU, leaving those clock cycles to process user data rather than managing the flow control of the protocol. We refer to this feature as Offload.
Table 3 presents IPv6 performance on a write workload with Offload off and with Offload on. While performance was comparable under both conditions, CPU utilization was lower with Offload on.
Table 3. IPv6 performance on a write workload with Offload off and Offload on. Higher IOPS and MB/sec and lower CPU utilization are better. Source: Principled Technologies.
Write workload, IPv6 |
|
|
| |
Block size | IOPS | MB/sec | Percentage CPU utilization | |
Offload off | 256K | 8,752.1 | 2,188.02 | 4.9 |
Offload on | 256K | 8,615.5 | 2,153.88 | 2 |
Offload on % improvement | -1.56% | -1.56% | 59.18% | |
Offload off | 64K | 34,972.1 | 2,185.76 | 6.5 |
Offload on | 64K | 34,895.6 | 2,180.97 | 3.4 |
Offload on % improvement | -0.21% | -0.21% | 47.69% | |
Table 4 presents IPv6 performance on a read workload with Offload off and with Offload on. In contrast to the approximate parity we saw on the write workload, performance improved greatly with the use of Offload, particularly at the larger block size, where IPv6 delivered 58.15 percent greater performance than with Offload off. At the 64K block size, enabling Offload improved performance by 25.43 percent. Figure 1 illustrates these advantages. As we saw with the write workload, CPU utilization was lower with Offload on.
Table 4. IPv6 performance on a read workload with Offload off and Offload on. Higher IOPS and MB/sec and lower CPU utilization are better. Source: Principled Technologies.
Read workload, IPv6 |
|
|
| |
Block size | IOPS | MB/sec | Percentage CPU utilization | |
Offload off | 256K | 22,752.4 | 5,688.09 | 13.6% |
Offload on | 256K | 35,983.4 | 8,995.86 | 8.3% |
Offload on % improvement | 58.15% | 58.15% | 38.97% | |
Offload off | 64K | 80,392.4 | 5,024.53 | 12.5% |
Offload on | 64K | 100,840.9 | 6,302.55 | 7.3% |
Offload on % improvement | 25.43% | 25.43% | 41.60% | |
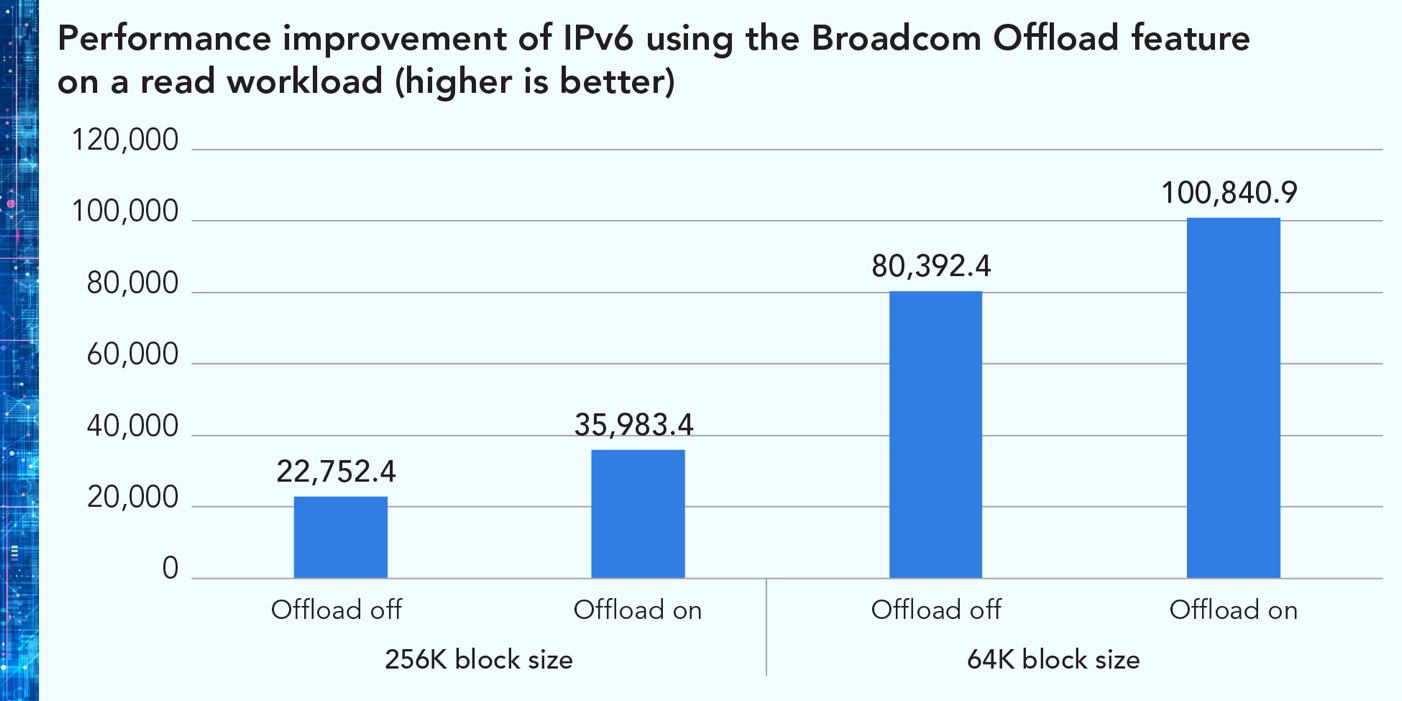
Figure 1. Performance improvement of IPv6 using Offload feature on a read workload. Higher is better. Source: Principled Technologies.
Measuring the impact of the Broadcom Offload feature on IPv4 performance
Table 5 presents IPv4 performance on a write workload with Offload off and with Offload on. As we saw with IPv6, performance was comparable under both conditions and CPU utilization improved with Offload on.
Table 5. IPv4 performance on a write workload with Offload off and Offload on. Higher IOPS and MB/sec and lower CPU utilization are better. Source: Principled Technologies.
Write workload, IPv4 |
|
|
| |
Block size | IOPS | MB/sec | Percentage CPU utilization | |
Offload off | 256K | 8,696.1 | 2,174.01 | 4.9 |
Offload on | 256K | 8,596.0 | 2,148.99 | 2.0 |
Offload on % improvement | -1.15% | -1.15% | 59.18% | |
Offload off | 64K | 34,862.7 | 2,178.92 | 6.6 |
Offload on | 64K | 34,727.8 | 2,170.49 | 3.6 |
Offload on % improvement | -0.38% | -0.38% | 45.45% | |
As Table 6 shows, the impact of enabling Offload on IPv4 read performance followed the same pattern we saw with IPv6. Using Offload dramatically improved read performance, by 77.90 percent at the larger block size and by 38.73 percent at the 64K block size. Figure 2 highlights these performance improvements. Once again, using Offload improved CPU utilization.
Table 6. IPv4 performance on a read workload with Offload off and Offload on. Higher IOPS and MB/sec and lower CPU utilization are better. Source: Principled Technologies.
Read workload, IPv4 |
|
|
| |
Block size | IOPS | MB/sec | Percentage CPU utilization | |
Offload off | 256K | 19,987.8 | 4,996.95 | 14.1 |
Offload on | 256K | 35,559.3 | 8,889.81 | 8.1 |
Offload on % improvement | 77.90% | 77.90% | 42.55% | |
Offload off | 64K | 73,194.1 | 4,574.63 | 13.9 |
Offload on | 64K | 101,545.6 | 6,346.60 | 7.4 |
Offload on % improvement | 38.73% | 38.73% | 46.76% | |
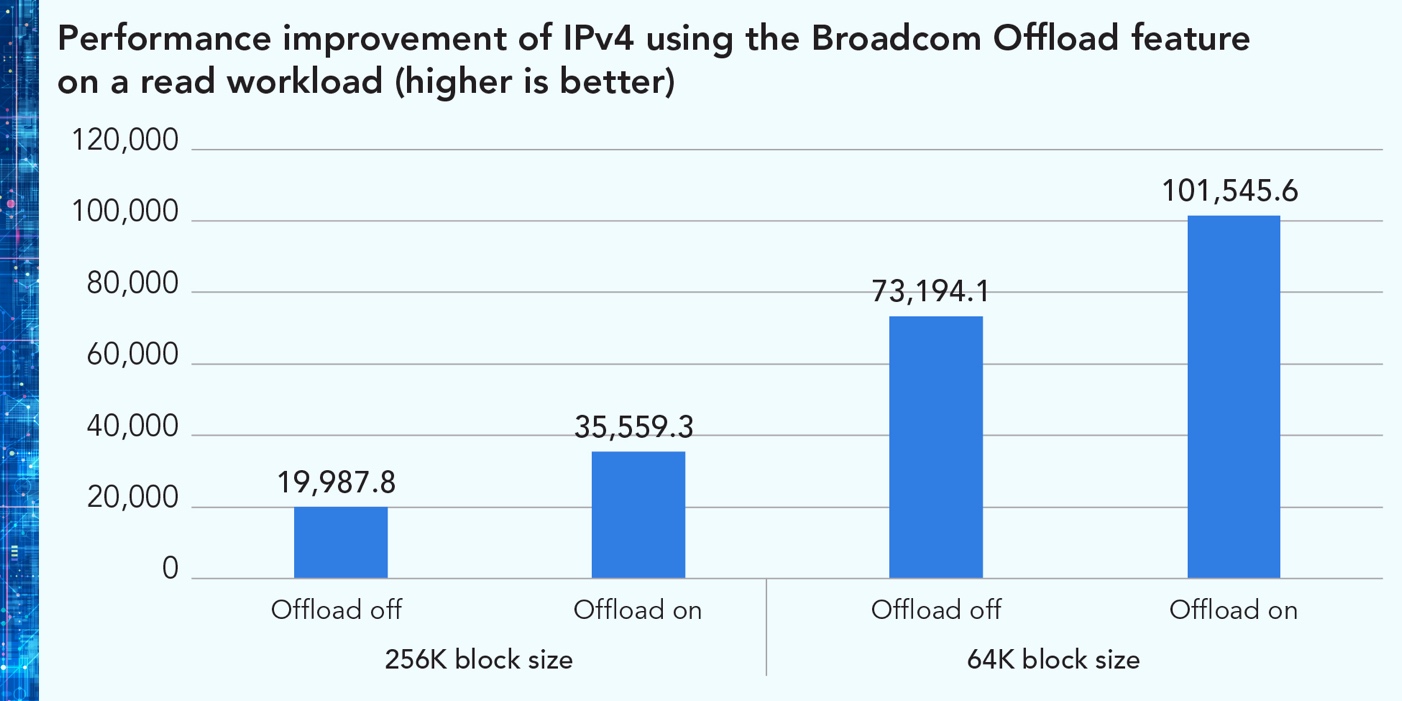
Figure 2. Performance improvement of IPv4 using the Broadcom Offload feature on a read workload. Higher is better. Source: Principled Technologies.
While we have discussed many advantages to making the shift to IPv6, our test results demonstrate that companies who opt not to do so immediately could reap performance benefits on read workloads—and CPU utilization benefits on both read and write workloads—by using the Dell-Broadcom solution we tested and enabling the Broadcom NIC Offload feature.
Conclusion
With IPv4 address pools rapidly disappearing and a federal mandate for government agency devices to begin shifting to IPv6-only and telecom 5G with IoT and edge devices, it’s clear that IPv6 is the future. Transitioning from IPv4 to IPv6 can be a challenge, so organizations may be interested to learn that switching to IPv6 has the potential to improve performance. In our testing without the Broadcom Offload feature, IPv6 delivered comparable performance to IPv4 on write workloads and better performance on read workloads while also reducing CPU utilization. When we enabled the Broadcom Offload feature on both IPv6 and IPv4, read workload performance increased dramatically and CPU utilization on both read and write workloads improved. Whether your organization is transitioning to IPv6 right away or choosing to delay the shift, this feature can boost performance on read workloads, which can improve the experience for users, reduce backup windows, and allow databases to load more quickly.
This project was commissioned by Dell Technologies.
January 2024
Principled Technologies is a registered trademark of Principled Technologies, Inc.
All other product names are the trademarks of their respective owners.
[1] Google, “IPv6,” accessed December 21, 2023, https://www.google.com/intl/en/ipv6/statistics.html.
[2] Russell T. Vought, “MEMORANDUM FOR HEADS OF EXECUTIVE DEPARTMENTS AND AGENCIES,” accessed December 21, 2023, https://www.whitehouse.gov/wp-content/uploads/2020/11/M-21-07.pdf.
[3] RipeNCC, “What is IPv4 Run Out?” accessed December 21, 2023,
[4] Jeff Barr, “New – AWS Public IPv4 Address Charge + Public IP Insights,” accessed December 21, 2023,
https://aws.amazon.com/blogs/aws/new-aws-public-ipv4-address-charge-public-ip-insights/.
[5] Linkedin, “How can NAT affect the performance and reliability of network applications?” accessed December 21,
2023, https://www.linkedin.com/advice/0/how-can-nat-affect-performance-reliability-network.
[6] Russell T. Vought, “MEMORANDUM FOR HEADS OF EXECUTIVE DEPARTMENTS AND AGENCIES,” accessed December 21, 2023, https://www.whitehouse.gov/wp-content/uploads/2020/11/M-21-07.pdf.
[7] Russell T. Vought, “MEMORANDUM FOR HEADS OF EXECUTIVE DEPARTMENTS AND AGENCIES.”
[8] Akamai, “IPv6 Adoption Visualization,” accessed December 21, 2023,
[9] Network Academy, “IPv4 vs IPv6 - Understanding the differences,” accessed December 21, 2023,
[10] Diego Asturias, “Migration to IPv6: Benefits and Techniques,” accessed December 21, 2023,
[11] Diego Asturias, “Migration to IPv6: Benefits and Techniques.”
[12] Diego Asturias, “Migration to IPv6: Benefits and Techniques.”
[13] “IPv6 Transition,” accessed December 21, 2023, https://www.nccoe.nist.gov/projects/IPv6-transition.
[14] “IPv6 Transition.”
[15] “IPv6 Transition.”
[16] NIST, “About NIST,” accessed December 21, 2023, https://www.nist.gov/about-nist.
[17] NIST, “USGv6,” accessed December 21, 2023, https://www.nist.gov/programs-projects/usgv6-program/usgv6.
[18] NIST, “USGv6 Revision 1,” accessed December 21, 2023,
https://www.nist.gov/programs-projects/usgv6-program/usgv6-revision-1.
[19] George Dilger, “Industry First IPv6-only Support on Servers and Storage,” accessed December 21, 2023,
https://www.dell.com/en-us/blog/industry-first-ipv6-only-support-on-servers-and-storage/.
[20] George Dilger, “Industry First IPv6-only Support on Servers and Storage.”
[21] Broadcom, “Broadcom Ethernet NICs PCIe NIC Ethernet Adapters Specification Sheet,” accessed December 21,
2023, https://docs.broadcom.com/doc/PCIe-NIC-Ethernet-Adapters-Specification-Sheet.
[22] Eden Kim and Fred Zhang, “Optimizing NVMe® over Fabrics (NVMe-oFTM),” accessed December 21, 2023,
https://www.snia.org/sites/default/files/education/snia-optimizing-nvme-over-fabrics-nvme-of.pdf.
[23] Juan Mulford, “What is NVMe-oF?,” accessed December 21, 2023, https://www.storagereview.com/review/nvme-nvme-of-background-overview.
[24] “Ethernet Network Adapters,” accessed December 21, 2023,
https://www.broadcom.com/products/ethernet-connectivity/network-adapters.
[25] Google, “IPv6,” accessed December 21, 2023, https://www.google.com/intl/en/ipv6/statistics.html.

Dell PowerEdge R760 Performance with Broadcom Emulex LPe36002
Thu, 14 Mar 2024 16:56:04 -0000
|Read Time: 0 minutes
Executive Summary:
New-generation technology continually enhances performance, yet there are instances when the convergence of multiple technological advancements yields a disproportionately advantageous outcome. This scenario is vividly exemplified when the Dell PowerEdge R760 Rack Server is synergistically paired with the Broadcom Emulex LPe36002 64G Fibre Channel Host Bus Adapter (HBA).
Dell entrusted Tolly to perform four distinct benchmark tests evaluating the analytics workload performance facilitated by the Broadcom Emulex LPe36002 64G Fibre Channel dual-port host bus adapter (HBA) within the framework of the Dell PowerEdge R760 Rack Server.
These four benchmark tests encompassed:
1. CPU power and PCIe 5.0 bus work with the Broadcom 64GFC dual - port Adapter vs previous generation products
Key findings:
- 4x the Database Analytics Throughput
- 42% greater ad hoc query processing time
2. 64G Fibre Channel Oracle Database/Microsoft SQL Performance - NVMe/FC vs. SCSI/FC
Key findings:
- Improved database transactions by up to 53%
- Reduced database stored procedure latency by up to 58%
- Improved server CPU efficiency by up to 106%
3. 64G Fibre Channel up to 4:1 Server Virtualization Consolidation
Key findings:
- 1x R760 with 64GFC HBA can achieve the same VM “Boot Storm” throughput as 4x R740-class servers with 16GFC HBAs
- 1x R760 with 64GFC HBA can achieve the same VM storage migration throughput as 4x R740-class servers with 16GFC HBAs
4. 64G Fibre Channel Enables up to 4:1 Application Server Consolidation
Key findings:
- 1x R760 with 64GFC HBA can achieve the same TPROC-H query throughput compared to 4x R740-class servers with 16GFC HBA
- Consolidating Oracle DSS workloads from 4 R740 servers with 16GFC HBA to a single R760 with 64GFC can significantly reduce I/O bound TPROC-H query time.
Broadcom Emulex LPe36002
The Broadcom Emulex LPe36000-series Gen 7 Fibre Channel HBAs are designed for demanding mission-critical workloads and emerging applications. The family of adapters features Silicon root of Trust security, designed to thwart firmware attacks aimed at enterprises and governments. Gen 7 64G provides seamless backward compatibility to 32G and 16G networks. Dell sells the LPe36002 64G HBA for the same price as the 32G model.

16th Generation Dell PowerEdge R760 server with Broadcom NICs: Save money, do more work, and use less energy
Mon, 15 Apr 2024 20:10:10 -0000
|Read Time: 0 minutes
Principled Technologies testing showed that a 16th Generation Dell PowerEdge R760 server featuring a Broadcom BCM57508-P2100G NIC delivered all three vs. previous-generation PowerEdge servers
The last 20 years have seen a dramatic increase in the amount of data businesses generate, analyze, and store. During this period of data proliferation, businesses gained access to a wealth of new sources of data from the rise of the internet, the widespread adoption of smart phones, and the growth of the internet of things (IoT). More powerful processors have made it possible for businesses to analyze this data in new ways using tools such as machine learning (ML) and artificial intelligence (AI). These developments mean many organizations need to add servers to their data centers to keep up with the growth in demand for compute capacity and storage, but it can be difficult to balance the need for higher performance and the challenge of reducing costs. Additionally, energy conservation has become increasingly important as energy costs have risen and businesses have made goals to reduce their carbon footprint to fight climate change.
We tested the performance and power efficiency of three generations of Dell PowerEdge servers to help businesses understand which of these servers to choose to meet the demands of data proliferation, reducing costs, and energy conservation. This report outlines our test methodologies and findings in the context of an increasingly cost-sensitive and conservation-conscious business landscape. We measured the Ops/s and the performance per watt ratio using the Memtier benchmark utility. We ran write and read commands against the popular open-source, in-memory data structure store Redis. Common use cases of Redis include message broker software[1] and real-time streaming analytics [2], among others.
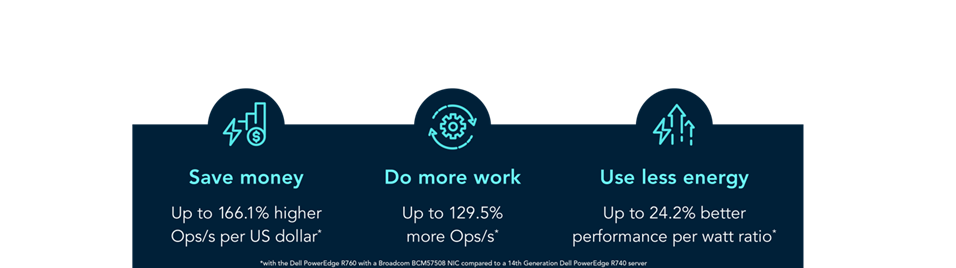
Our testing showed that by choosing the 16th Generation Dell PowerEdge R760 featuring a Broadcom BCM57508-P2100G NIC, organizations can save more money, do more work, and use less energy.
Spend less to do the same amount of work with Dell PowerEdge R760 servers with Broadcom NICs

Figure 1: The Ops/s that the servers processed, the price of the servers in US dollars, and the Ops/s per US dollar of the servers. Higher Ops/s per US dollar is better. Source: Principled Technologies.

Figure 2: The Ops/s that the servers processed, the price of the servers in US dollars, and the Ops/s per US dollar of the servers. Higher Ops/s per US dollar is better. Source: Principled Technologies.
When looking at adding capacity, using the latest servers can boost performance, but as with any business decision, organizations should weigh the costs as well as the benefits associated with purchasing the latest equipment. Perhaps an organization has reasons they may consider equipment that is one or two generations back, say, to match existing equipment. However, this decision can be critical to both purchase and ongoing costs. To understand how much you can reduce costs by using the latest more powerful and more energy efficient servers, we obtained list pricing for the configurations we tested.[3] We configured the servers in these price comparisons as closely as possible to those we tested, but some minor differences were unavoidable because of product availability.
The PowerEdge R760 with a Broadcom NIC processed 2.29 times as many Ops/s as the PowerEdge R740 at a cost that is 13.7 percent lower. As Figure 1 shows, the PowerEdge R760 processed 166.1 percent more Ops/s per Dollar as the PowerEdge R740. In addition to the lower purchase price, the PowerEdge R760 was 24.2 percent more energy efficient in our tests, which could further reduce costs by requiring less energy for operation and cooling.
The PowerEdge R760 with a Broadcom NIC processed 30.6 percent more Ops/s than the PowerEdge R750 at a cost that is only 3.9 percent higher. The cost difference between the PowerEdge R750 and the PowerEdge R760 is relatively small compared to the difference in performance, and as Figure 2 shows, the PowerEdge R760 server offered 25.4 percent more Ops/s per US dollar than the PowerEdge R750.
The impact of these cost, energy efficiency, and performance numbers will vary depending on the needs of a given data center. Let’s examine what the performance and value of these servers would look like in several scenarios.
If an organization needed the additional database processing power of 10 PowerEdge R760 servers, they could meet those needs with any of the servers we tested, but they would spend the least ($318,236.20) if they bought 10 PowerEdge R760 servers. To meet those needs with the PowerEdge R750 servers, they’d spend $399,181.54, and with the PowerEdge R740 servers, they’d pay $847,046.62.
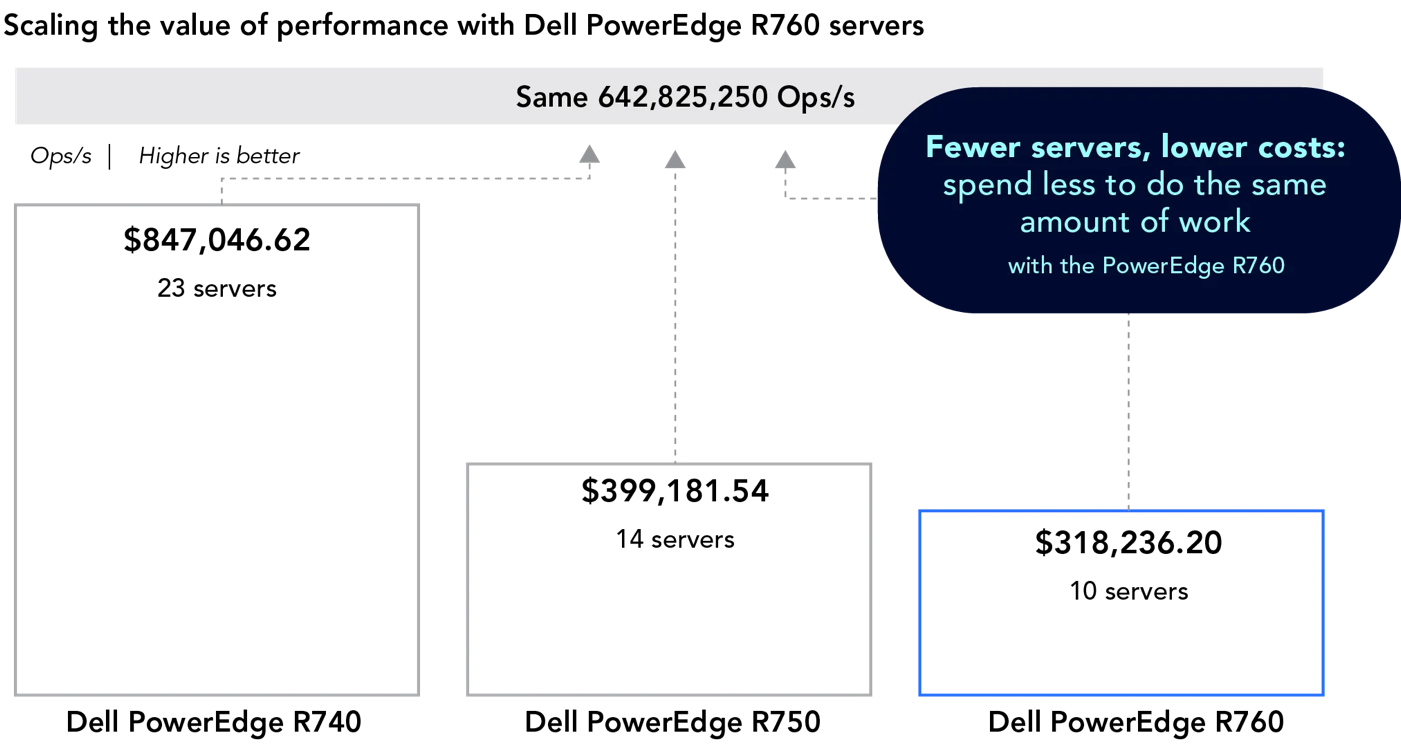
Figure 3: A comparison of how many servers it would take to do the same work as 10 Dell PowerEdge R760 servers and the cost in USD. Source: Principled Technologies.
The savings scale with the size of an organization’s database processing needs: 500 PowerEdge R760 servers would cost $15,911,810.00 and process 32,141,262,500 Ops/s. To do the same amount of work, the organization would need to purchase approximately 653 PowerEdge R750 servers, which would cost $19,956,907.00: over $4 million US dollars more than choosing the PowerEdge R760. Using this same hypothetical, an organization would need to purchase approximately 1,147 PowerEdge R740 servers to do the work of 500 PowerEdge R760 servers, at a cost of $42,319,539.95: over $26 million US dollars more than choosing the PowerEdge R760.
When you consider the higher performance, the savings discussed above, and the lower energy costs of the more efficient PowerEdge R760 with a Broadcom NIC, it becomes clear that organizations will save the most money by choosing the latest-generation Dell PowerEdge R760 server.
Better performance with the Dell PowerEdge R760 server
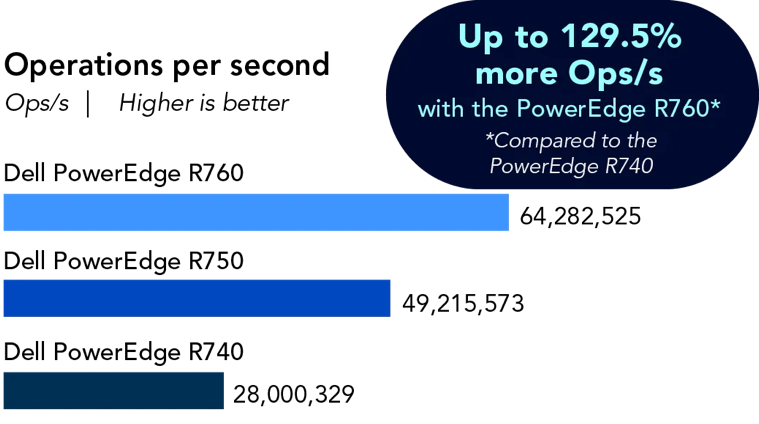
Figure 4: The Ops/s the servers processed. Higher is better. Source: Principled Technologies.
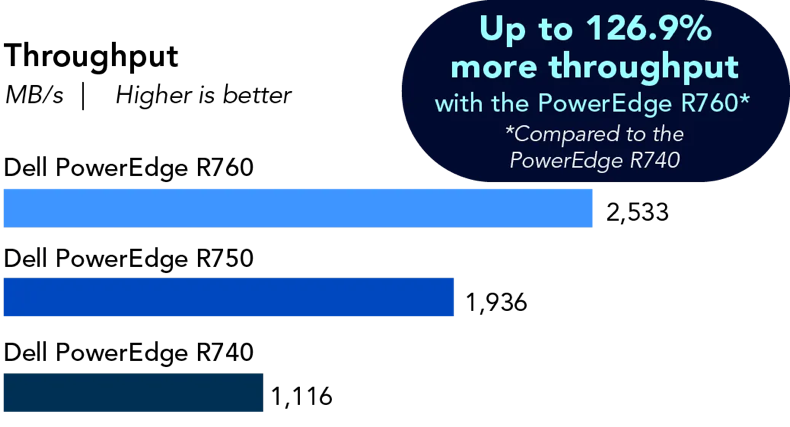
Figure 5: The throughput of the servers in MB/s. Higher is better. Source: Principled Technologies.

Figure 5: The performance per watt of the servers in Ops/s per watt. Higher is better. Source: Principled Technologies.
Bytes per second and operations per second (Ops/s) are both measures of throughput, or rates. Bytes per second are a system level statistic that typically come from either disk or network. We often refer to this metric in terms of a multiplier, such as megabytes per second (MB/s) or gigabytes per second (GB/s). In the case of our testing, we measured MB/s that passed through the ethernet controller. Ops/s typically refers to an application measure, in this case the operations per second that Redis processed during our memtier tests. Both measures of throughput are important to consider depending on what you are trying to measure. An increase in either number shows improvement in the amount of data (MB/s) or operations (Ops/s) that the server or application processed in a fixed amount of time.
When we compared the throughput of the three Dell PowerEdge servers, we found that the PowerEdge R760 server offered up to 126.9 percent more MB/s throughput and processed up to 129.5 percent more Ops/s than the PowerEdge R740 server. The PowerEdge R760 offered up to 30.8 percent more MB/s throughput and processed up to 30.6 percent more Ops/s than the previous-generation PowerEdge R750 server. Organizations that want the highest performing server should consider the PowerEdge R760, based on these findings.
Save money by getting more performance per watt with the PowerEdge R760 server featuring a Broadcom NIC
To understand the power efficiency of the servers, we measured the work a server did (Ops/s), and divided it by the power the server used (watts). We found that the PowerEdge R760 with a Broadcom NIC offered up to 24.2 percent better operations per second per watt than the 14th Generation Dell PowerEdge R740 server, and up to 9.2 percent better operations per second per watt than the 15th Generation Dell PowerEdge R750 server. Organizations that select these new servers with Broadcom ethernet controllers can reduce the amount of power necessary to process a given unit of work, which will help reduce their energy costs and carbon footprint.
Our hands-on testing of the Dell PowerEdge R760
To help organizations understand which PowerEdge server best meets their needs, we ran a series of tests comparing the performance and power efficiency of three servers that Dell is currently selling:
- 16th Generation Dell PowerEdge R760
- 15th Generation Dell PowerEdge R750
- 14th Generation Dell PowerEdge R740
These results might also be helpful for organizations considering upgrading their older servers to the latest-generation PowerEdge R760.
For testing, we used the database Redis, a widely-used, in-memory, open-source key-value store—a type of NoSQL database that uses pairs of keys and associated values to quickly access information. Companies including Twitter, GitHub, Snapchat, Craigslist, and StackOverflow rely on Redis for their operations.[4]
In the case of traditional relational databases, the architecture is such that the designers of the database must model, or structure, the data in a certain way. When applications request data and the data is not in memory, the database must retrieve the data from disk, causing a small delay. This architecture works well for some applications, but not all. In many types of applications, a developer may need to store data with less structure—perhaps strings, hashes, lists, or arrays. Redis works well for this, as its architecture is based on a key and a value. A key can have multiple values, resulting in databases that are comprised of a long list of keys and their associated values, with the potential for fewer complexities and slowdowns of relational databases. This data design makes Redis useful for web application user session data (such as cookies) and other small elements of data that web server applications need frequently. Caching that data in Redis allows web applications to return data very quickly.
Memtier, the benchmark utility we used, is a utility that runs set (write) and get (read) commands against a Redis database. Those commands simulate different request patterns. According to Redis, the memtier_benchmark is “a high-throughput benchmarking tool” that can “generate various traffic patterns against both Memcached and Redis instances.”[5] Various parameters that the operator can use, such as data size and key-pattern, can alter the traffic pattern that memtier returns. By operating the memtier utility on a client server and targeting a Redis server, we utilized the Redis server’s processor and ethernet controller subsystems heavily.
We configured all three of the servers we tested with Red Hat Enterprise Linux 8.7 and the most recent firmware as of March 14th, 2023 for the PowerEdge R740 and PowerEdge R750, and April 6th, 2023 for the PowerEdge R760. We recorded the operations per second (Ops/s) and throughput (MB/s) during the test and used those readings for our results. We used an external power meter to measure the power draw by the power supply units (PSUs) while the servers were under load and recorded the average power draw for the entire duration of the test. Then, we calculated the power efficiency (Ops/s/watt) of the devices using the results of our testing. We wanted to utilize close to 100 percent of the database server’s CPU capacity to see how the systems performed under stress. We used the memtier_benchmark to create a roughly 100GB database and ran a constant size, 32 byte (default/small), 100 percent read workload to create enough load to reach nearly 100 percent CPU usage. Read-only operations constitute the majority of the workload in applications such as content streaming and data analysis. Additionally, testing with read-only operations provides comparable performance metrics without the additional complexity of write operations.
Dell PowerEdge R760 servers with Broadcom BCM57508-P2100G NICs
The Dell PowerEdge R760 server is a 2U, two-socket server that features a Broadcom BCM57508-P2100G Dual-Port 100GbE PCl Ethernet Controller. Dell designed the PowerEdge R760 to handle “demanding workloads including artificial intelligence, database analytics, and high-density virtualization.”[6] A wide range of businesses can use the PowerEdge R760 for workloads that demand high performance, such as:
- Artificial intelligence
- Virtualized workloads
- Machine learning
- Database analysis
According to Dell, users of the PowerEdge R760 server can:
- “Add up to two 4th generation Intel® Xeon® scalable processors with up to 56 cores for fast and accurate performance
- Accelerate in-memory workloads with up to 32 DDR5 RDIMMS up to 4800 MT/s(1DPC)
- Maximize performance with up to 2x double-wide or 6x single-wide GPUs for finishing workloads faster
- [Use the] new Smart Flow chassis to air-cool some of the highest core count CPUs within current IT infrastructure”[7]
The PowerEdge R760 server includes built-in security features such as secured component verification, signed firmware and drift detection, dynamic system lockdown, and BIOS recovery.[8] The PowerEdge R760 also features intelligent automation features such as OpenManage Enterprise, CloudIQ solutions, and PowerEdge iDRAC. The OpenManage systems management portfolio enables administrators to deploy, configure, monitor, and manage PowerEdge servers, including easily obtaining power data and capping power as necessary. For more information about the Dell PowerEdge R760 server, visit: https://www.dell.com/en-us/shop/productdetailstxn/poweredge-r760.
About the Broadcom BCM57508-P2100G Dual-Port 100GbE PCle 4.0 ethernet controller

A network interface controller (NIC) is a hardware component in a server that connects the server to a network. The NIC translates outgoing data from the server into a format that the network can read and translates incoming data from the network into a format that the server can read. A higher performing NIC can reduce latency, increase throughput, and allow the server to transmit and receive a great volume of data.
The Dell PowerEdge R760 features the Broadcom BCM57508-P2100G Dual-Port 100GbE PCle 4.0 ethernet controller, which supports speeds of up to 200 Gigabits per second. Broadcom designed the BCM57508-P2100G “to build highly-scalable, feature-rich networking solutions in servers for enterprise and cloud-scale networking and storage applications, including high-performance computing, telco, machine learning, storage disaggregation, and data analytics.”[9]
The BCM57508-P2100G features TruFlow™, which Broadcom asserts can “increase VM density up to 50 percent.”[10] The BCM57508-P2100G also features BroadSAFE® technology, “to provide unparalleled platform security” and a “unique set of highly-optimized hardware acceleration engines to enhance network performance and improve server efficiency.”[11]
Efficiency and expansion: Unraveling the challenges of the growing data center market
We’ve shown that the PowerEdge R760 is more energy-efficient and offers better performance than previous-generation PowerEdge servers, but why does that matter? Organizations realize the value of their data and the insights they provide. Despite economic uncertainty, spending on servers has remained consistent with previous years, and many experts expect it to increase.[12] According to one industry analyst, “despite the general tightening of spending by governments and corporations..., organizations are still spending on infrastructure even if they are, in some cases, cutting back on personnel.”[13] Increasingly, to deal with the ever growing importance of their data, businesses are aware that adopting new technologies such as ML and AI is “both a necessity and a race.”[14]
While the new 16th Generation server we tested uses more power, it does so more efficiently—in this example resulting in an approximately 20 percent lower annual cost, based on the following calculations. In our example if we factor in power usage, our tested 16th Generation server used approximately 831W (.831kW), while the 14th Generation server used approximately 450W (.450kW). In an earlier section we established that an organization would need 1,147 PowerEdge R740 servers to do the work of 500 PowerEdge R760 servers. Thus we can calculate the data center power cost per year as follows:
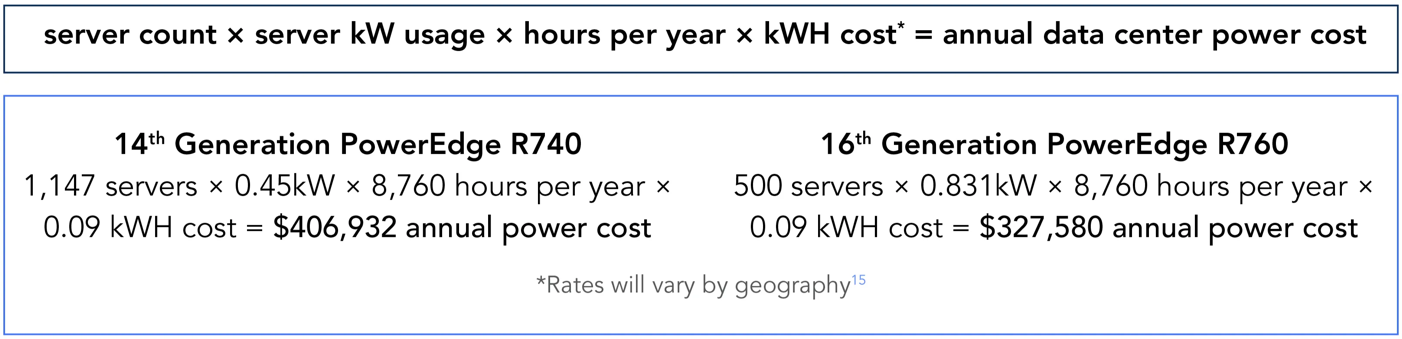
Figure 7: Calculations showing the annual power cost of the servers in US dollars. Lower is better. Source: Principled Technologies.[15]
Sustainability challenges
As new technologies and data proliferation have increased the demands on data center performance and capacity, sustainability concerns have begun to put pressure on companies to increase the efficiency and reduce the carbon footprint of their data centers. By some estimates, the carbon footprint of data centers worldwide equals that of the airline industry.[16] According to S&P Global Market Intelligence, “the data center industry faces pressure from multiple sources— including government, financial markets, and corporate clients—to improve sustainability and reduce carbon emissions.”[17] Over the last few years, businesses have contended with volatile energy prices that have trended higher.[18] For many companies, the energy consumption of their servers is a significant expense.[19]
The sustainability challenges related to data centers are not limited to carbon emissions. Many data centers use large amounts of water to cool their servers. According to the U.S. Department of Energy, an average data center that uses evaporative cooling can consume 3 to 5 million gallons of water per day— similar to the daily capacity of a city of 30,000-50,000 people.[20] Roughly 20 percent of data centers in the U.S. rely on watersheds that are under stress from drought.[21] Choosing more efficient servers can help organizations meet internal and external climate goals and reduce their water usage and carbon footprints.
Managing costs over time
So far in this report we have explained why choosing the PowerEdge R760 to meet new capacity needs can save money and provide better performance, but what about organizations considering upgrading to newer, more efficient servers? In addition to the savings associated with reducing cooling costs, businesses that upgrade older servers may also save money by avoiding some of the other costs associated with delaying their server replacements. Older servers become more expensive to operate as they age. According to analysis by IDC, businesses reported an average annual operating cost of $7,541 per server during the first three years of use; during years 4 to 6, those servers reached a high of an average of $22,511 per server, a 199 percent increase.[22] Upgrading aging servers can reduce the amount of time IT spends on compliance, maintenance, and security, as newer servers often include the most recent manageability and security features. Aging servers may also contribute to slower response times and a diminished customer experience. Research by Deloitte found that “with a 0.1s improvement in site speed…consumers spent almost 10 percent more” on retail sites.[23] Upgrading to the latest-generation server technology can provide a better user experience.
Historically, server manufacturers have improved the performance of their systems in parallel with the growing demand for data processing, but the ever increasing reliance on data processing plus the rapid growth of resource-hungry technologies such as ML and AI have combined to make data center processing and power consumption challenges even more urgent. ML and AI workloads require a large amount of processing power, and therefore can lead to data centers running at higher power densities, which creates more demand on cooling systems. Some analysts estimate the use of ML will grow at a compound annual growth rate of 35.6 percent until 2030.[24] Data centers will need more powerful, more energy-efficient systems to keep up with this growing demand.
According to the International Monetary Fund (IMF), “energy prices surged to near historic highs in recent years amid the pandemic and the war in Ukraine.”[25] In their latest World Economic Outlook forecast, the IMF predicted “that growth will slow from 3.4 percent last year to 2.8 percent this year.”[26] Faced with volatile energy prices and growing economic uncertainty, many organizations are looking for ways to lower computing costs without sacrificing performance. Organizations can potentially gain performance and reduce cooling costs by upgrading their servers to more powerful models that consume less energy under load. Upgrading to more efficient servers can also help businesses meet their climate change goals.
Server power consumption
In the last two decades, server capabilities have increased dramatically, becoming more powerful and more efficient. While businesses have benefited from the advanced analytics and data processing capabilities of these new servers, they have come at a cost due to the energy required to run them. The design of a server and its components determine how much power it will consume during operation.
Thermal design power
Thermal design power (TDP) refers to the maximum theoretical amount of power, measured in watts, a computer chip (typically a processor or peripheral component) uses.
TDP can be a helpful starting point in considering what the total power draw of a server could be or what power supplies the server should be equipped with. Using these wattage approximations and other server energy usage information, data center designers can calculate the approximate British Thermal Units (BTUs) a data center will need for cooling. Because of advancements in technology and performance such as increased core count, the TDP of many processors has doubled in the last few years, making power considerations even more significant.[27]
Key factors in server design that affect power consumption
Multiple factors in server design affect power consumption. In many servers, the central processor uses more power than other components. Based on some models, the processor can consume as much as 32 percent of the server’s power.[28] A study by the Swedish Energy Agency examined data center and server energy consumption and found, “the central processing unit (CPU) is the largest contributor to the total server power consumption, followed by peripheral slots (including network card slot and input and output devices (I/O) devices), conduction losses, memory, motherboard, disk/storage, and cooling fan.”[29]
CPUs are, of course, not the only components that require power. Every component in a server consumes power, from disks to graphics processing units (GPUs) to power supply units (PSUs), and can therefore impact the server’s power efficiency. Adding more disks or GPUs might increase the server’s power consumption, while using fewer disks or no GPUs might decrease it. Similarly, using a higher efficiency power supply can reduce a server’s power consumption—according to one source, by 3 to 4 percent.[30]
The NIC also has an impact on the power consumption of a server. Based on the specifications Broadcom lists for the NICs in the servers we tested, the 100Gb Broadcom BCM957508-P2100G NIC in the PowerEdge R760 typically draws 16.0W and the 25Gb BCM957414-P225p NIC in the PowerEdge R740 typically draws 10.9W with Passive DAC at 55°C ambient temperature.[31] This means that choosing the PowerEdge R760 instead of the PowerEdge R750 would provide a NIC with four times the raw capacity that draws less than 50 percent more power. Based on the specifications Broadcom lists for a 10Gb BCM57712 NIC with the same configuration as the one in the PowerEdge R740 we tested, we estimate that selecting the PowerEdge R760 over the PowerEdge R740 would provide a NIC with ten times the raw capacity that draws less than 80 percent more power.[32]
Data center cooling
Cooling is critical to a data center’s operation because poorly managed heat can lead to “downtime, damage to critical components, and a shorter lifespan for equipment.”[33] A data center’s cooling generally falls into two categories: direct cooling of the servers and cooling the data center floor. Inside the servers, cooling technologies focus on moving the heat that the server generates away from the devices. On the data center floor, cooling technologies focus on maintaining a comfortable—if warm—ambient room temperature.[34]
The most common cooling system data centers use is a computer room air conditioner (CRAC). A CRAC works the same way as a residential air conditioner, but is inside of a server room. The CRAC method is energy inefficient but one of the most affordable methods of data center cooling.[35] A more energy-efficient method of cooling a data center is evaporative cooling. However, this requires a large amount of water, so it is not always the most environmentally friendly option depending on the watershed in the location of the data center.
Dell incorporated several cooling technologies into 16th Generation PowerEdge servers to help organizations meet the demands of reducing energy costs and environmental impact. These include high-performing fans and redesigned heatsinks to improve airflow and thermal management.[36] According to Dell, high airflow “is achieved using new impedance airflow paths, new storage backplane ingredients, and optimized mechanical structures all tuned to provide up to a 15% higher airflow compared to traditional designs.”[37] Software solutions such as OME Power Manager will automatically adjust power usage based on policies that admins can customize. To learn more about the power management benefits of OME, visit https://www.principledtechnologies.com/Dell/OpenManage-Power-Manager-1122.pdf.
Conclusion
Organizations don’t have to choose between saving money, doing more work, and using less energy; the new 16th Generation Dell PowerEdge R760 servers with Broadcom NICs do all three. In our hands-on testing, the new 16th Generation Dell PowerEdge R760 server featuring a Broadcom NIC offered 166.1 percent more Ops/s per US dollar, 129.5 percent more Ops/s, and 24.2 percent better performance per watt than the 14th Generation Dell PowerEdge R740 server. This means the PowerEdge R760 with a Broadcom NIC did over twice as much work at a lower cost with nearly 25 percent better power efficiency than the PowerEdge R740. When compared to the 15th Generation Dell PowerEdge R750, the PowerEdge R760 processed 29.8 percent more Ops/s at a lower cost in terms of Ops/s per US dollar and offered 3.8 percent better performance per watt.
In addition to lowering cooling costs and carbon emissions, choosing the latest-generation servers can help businesses lower other operating costs, such as maintenance and security compliance. Because the latest-generation Dell PowerEdge R760 servers offer more compute capacity, fewer servers can do more work, potentially reducing licensing costs and the physical footprint of a data center. Newer servers often feature the most recent manageability and security features, which can make it easier for businesses to manage their servers and protect their data. By choosing servers with better performance, businesses can reduce the response time of their systems and provide a better user experience.
Increasingly, businesses are under pressure to reduce the energy consumption and cost of their data centers while maintaining or increasing performance. Key web technologies such as Redis can offer businesses a competitive edge, but they also require a large amount of data processing. Businesses can meet these challenges with Dell PowerEdge R760 servers with Broadcom NICs that offer better cost-efficiency, performance, and power-efficiency.
This project was commissioned by Dell Technologies.
September 2023
Principled Technologies is a registered trademark of Principled Technologies, Inc.
All other product names are the trademarks of their respective owners.
[1] Redis, “Low-latency message queue & broker software,” accessed June 20, 2023, https://redis.com/solutions/use-cases/messaging/.
[2] Redis, “What is Redis?,” accessed June 20, 2023, https://aws.amazon.com/redis/.
[3] Prices obtained from Dell Marketing, US only. We used list pricing because it was the only pricing readily available for all three servers and because discounts vary.
[4] Redis, “Low-latency message queue & broker software.”
[5] Redis, “memtier_benchmark: A High-Throughput Benchmarking Tool for Redis and Memcached,” accessed June 15, 2023, https://redis.com/blog/memtier_benchmark-a-high-throughput-benchmarking-tool-for-redis-memcached/.
[6] Dell, “PowerEdge R760 Rack Server,” accessed June 7, 2023, https://www.dell.com/en-us/shop/productdetailstxn/poweredge-r760.
[7] Dell, “PowerEdge R760 Rack Server.”
[8] Dell.
[9] Broadcom, “BCM57508 – 200GbE,” accessed June 5, 2023, https://www.broadcom.com/products/ethernet-connectivity/network-adapters/bcm57508-200g-ic.
[10] Broadcom, “BCM57508 – 200GbE.”
[11] Broadcom.
[12] Timothy Prickett Morgan, “The Interesting Years Ahead for Servers,” accessed June 11, 2023, https://www.nextplatform.com/2023/01/04/the-interesting-years-ahead-for-servers/.
[13] Timothy Prickett Morgan, “The Interesting Years Ahead for Servers.”
[14] OliverWyman, “Machine Learning: Competitive Advantage and Strategic Imperative,” accessed June 11, 2023, https://www.oliverwyman.com/our-expertise/insights/2016/nov/Machine-Learning-Competitive-Advantage-and-Strategic-Imperative.html.
[15] Mary Zhang, “United States Data Centers: Top 10 Locations,” accessed July 27, 2023, https://dgtlinfra.com/united-states-data-centers/.
[16] S&P Global Market Intelligence, “Sustainability is no longer a ‘nice to have’ goal for the data center industry,” accessed June 14, 2023, https://www.spglobal.com/marketintelligence/en/news-insights/research/sustainability-is-no-longer-a-nice-to-have-goal-for-the-data-center-industry.
[17] S&P Global Market Intelligence, “Sustainability is no longer a ‘nice to have’ goal for the data center industry.”
[18] Lori Aniti, “Wholesale U.S. electricity prices were volatile in 2022,” accessed June 14, 2023, https://www.eia.gov/todayinenergy/detail.php?id=55139.
[19] InfoQ, “The Problem of Power Consumption in Servers,” accessed June 14, 2023, https://www.infoq.com/articles/power-consumption-servers/.
[20] Marcus Law, “Energy efficiency predictions for data centres in 2023,” accessed June 14, 2023, https://datacentremagazine.com/articles/efficiency-to-loom-large-for-data-centre-industry-in-2023.
[21] Michael Copley, “Data centers, backbone of the digital economy, face water scarcity and climate risk,” accessed June 14, 2023, https://www.npr.org/2022/08/30/1119938708/data-centers-backbone-of-the-digital-economy-face-water-scarcity-and-climate-ris.
[22] IDC, “Optimizing Performance with Frequent Server Replacements for Enterprise,” accessed June 12, 2023, https://www.delltechnologies.com/asset/en-us/products/servers/industry-market/server-infrastructure-resiliency-enterprise-whitepaper.pdf.
[23] Deloitte, “Milliseconds make Millions,” accessed June 12, 2023, https://www2.deloitte.com/content/dam/Deloitte/ie/Documents/Consulting/Milliseconds_Make_Millions_report.pdf.
[24] GVR, “Machine Learning Industry Data Book,” accessed June 14, 2023, https://www.grandviewresearch.com/sector-report/machine-learning-industry-data-book.
[25] Adil Mohommad, Mehdi Raissi, Kyuho Lee, Chapheng Fizzarotti, “IMF Blog: Volatile Commodity Prices Reduce Growth and Amplify Swings in Inflation,” accessed May 17, 2023, https://www.imf.org/en/Blogs/Articles/2023/03/28/volatile-commodity-prices-reduce-growth-and-amplify-swings-in-inflation.
[26] Mehdi Benatiya Andaloussi, Chiara Maggi, “IMF Blog: World Economic Outlook Shows Economies Facing High Uncertainty,” accessed June 21, 2023, https://www.imf.org/en/Blogs/Articles/2023/04/19/world-economic-outlook-shows-economies-facing-high-uncertainty.
[27] Robert Curtis et al, The Future of Server Cooling,” accessed June 8, 2023, https://infohub.delltechnologies.com/p/the-future-of-server-cooling-part-2-new-it-hardware-features-and-power-trends-1/.
[28] Kazi Main Uddin Ahmed, Manuel Alvarez, Math Bollen, “A Review of Data Centers Energy Consumption And Reliability Modeling,” accessed June 14, 2023, https://www.researchgate.net/publication/355862079_A_Review_of_Data_Centers_Energy_Consumption_And_Reliability_Modeling#pf8.
[29] Kazi Main Uddin Ahmed, Manuel Alvarez, Math Bollen, “A Review of Data Centers Energy Consumption And Reliability Modeling.”
[30] Patrick Kennedy, “Deep Dive into Lowering Server Power Consumption,” accessed June 8, 2023, https://www.servethehome.com/deep-dive-into-lowering-server-power-consumption-intel-inspur-hpe-dell-emc/.
[31] Broadcom, “Broadcom Eternet NICs,” accessed July 25, 2023, https://docs.broadcom.com/doc/PCIe-NIC-Ethernet-Adapters-Specification-Sheet.
[32] Allied Telesis, “Broadcom NetXtreme II® Network Adapter User Guide,” accessed July 25, 2023, https://www.alliedtelesis.com/sites/default/files/documents/installation-guides/brcm_nx2_server_t7-10.pdf.
[33] Datacenters.com, “Data Center Cooling: Future of Cooling Systems, Methods and Technologies,” accessed June 6, 2023, https://www.datacenters.com/news/data-center-cooling-future-of-cooling-systems-methods-and-technologies.
[34] Brien Posey, “Data center temperature and humidity guidelines,” accessed June 20, 2023, https://www.techtarget.com/searchdatacenter/tip/Data-center-temperature-and-humidity-guidelines.
[35] LDP Associates, “What are the Different Types of Data Center Cooling?,” accessed June 21, 2023, https://www.ldpassociates.com/what-are-the-different-types-of-data-center-cooling/.
[36] Matt Ogle and Hasnain Shabbir, “Multi Vector Cooling 2.0 for Next-Generation PowerEdge Servers,” accessed September 8, 2023, https://infohub.delltechnologies.com/p/multi-vector-cooling-2-0-for-next-generation-poweredge-servers/.
[37] Dell, “The Future of Server Cooling - Part 2: New IT hardware Features and Power Trends,” accessed July 25, 2023, https://infohub.delltechnologies.com/p/the-future-of-server-cooling-part-2-new-it-hardware-features-and-power-trends-1/.
Author: Principled Technologies

Improving Oracle Database performance: Moving to Dell PowerEdge R960 servers with Intel processors
Thu, 14 Mar 2024 16:56:05 -0000
|Read Time: 0 minutes
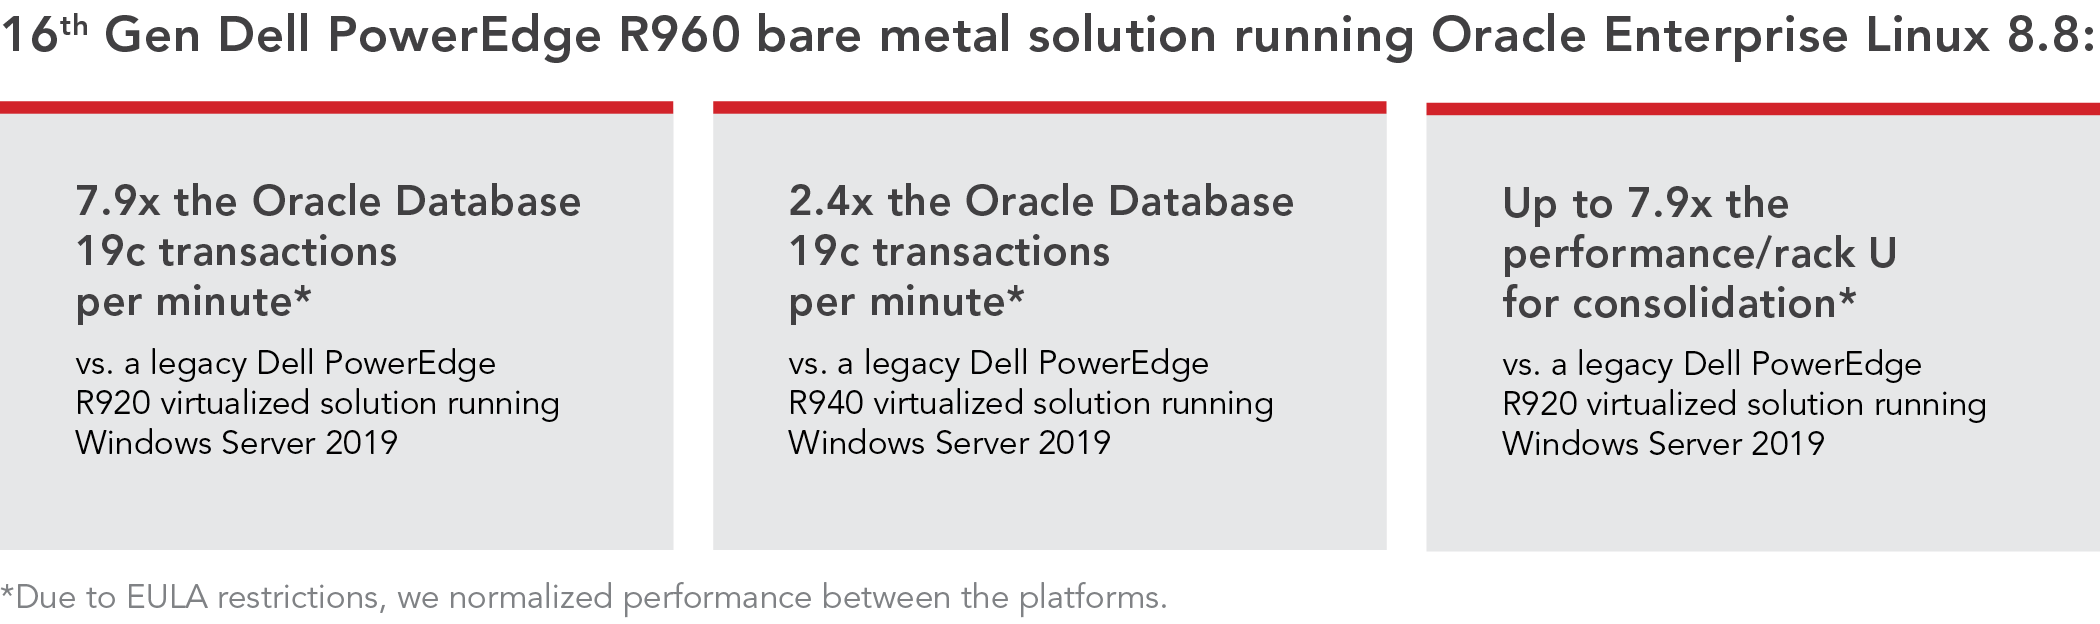
Bare metal Dell PowerEdge R960 servers running Oracle Enterprise Linux 8.8 handled more Oracle Database 19c transactions than legacy PowerEdge R940, and R920 virtualized solutions running Windows Server 2019
Overview
Aging servers can become progressively costlier to maintain and can negatively impact business productivity, due to a higher demand for IT staff time and the increased risk of unplanned downtime. Older servers hosting virtualized Oracle® Database applications may begin to struggle to meet growing usage demands, leading to slower operations that, for example, could deter customers from searching a website for products and making online purchases. Aging hardware also faces an increased risk of data loss or corruption and could introduce security issues and higher maintenance and repair costs.
Moving Oracle Database workloads from older servers onto new ones, such as the 16th Generation Dell™ PowerEdge™ R960 with 4th Gen Intel® Xeon® Scalable processors, could address those concerns. Upgrading to the latest-generation PowerEdge R960 could also help pave the way for additional IT improvements and help achieve business goals, such as improved customer responsiveness and accelerated time to market. Additionally, moving workloads from virtualized to bare metal solutions could increase transactional database performance, especially for those databases that come with high-performance service-level agreements (SLAs).
To see how upgrading to 16th Generation Dell PowerEdge R960 servers can boost Oracle Database 19c workloads specifically, we compared the performance of a bare metal solution running Oracle Enterprise Linux® 8.8 against the performance of two older generations—the PowerEdge R940 and PowerEdge R920—running Windows Server 2019. We found that the latest-gen solution delivered significantly better performance, demonstrating a sizable transactional database performance divide between a new solution and aging legacy solutions. The results, as seen in Figure 1 on page 7, show that your organization might wish to consider upgrading to the Dell PowerEdge R960.
Oracle Database in today’s businesses
Of the numerous relational database management systems (RDBMS) available, Oracle Database continues to stand as a market leader across enterprises of various sizes in many industries. Recent estimates position Oracle with approximately 30.2 percent of the RDBMS market share,[i] reigning as one of the database systems of choice for large enterprises and organizations including Netflix®, LinkedIn®, eBay®, intuit®, Massachusetts Institute of Technology, and more.[ii]
Oracle Database offers the following features that organizations might find appealing for their critical data:
- A single database application to handle a wide variety of data types: Oracle offers a “converged, multi-model database management system.”[iii]
- Scalability: Oracle Database handles databases of many sizes and offers the Oracle Multitenant feature that “allows you to consolidate small databases under a single Container Database for improved scalability and reduced system overhead. Multitenant also reduces CPU use, memory, and I/O compared to databases running individually.”[iv]
- Built-in security: Oracle Database includes security features such as granular access controls, activity monitoring, flexible data masking, and encryption and key management to help guard against data breaches.[v]
- Multitenancy: Oracle databases can function in a multitenant architecture, which enables organizations to consolidate data and code without altering existing schemas or applications while keeping individual databases separate.[vi]
The benefits of moving Oracle databases back to bare metal
While virtualized servers can maximize scalability and cost-effectiveness depending on your desired workload(s), hosting bare metal servers can be a solid option for many organizations—especially those with workloads for which maximum performance is paramount.
Performance improvements on bare metal servers stem from the removal of the virtualization layer that typically separates the host from the applications and libraries. This allows the server to use all its resources for the database application, without using processing power and memory for the hypervisor.[vii]
Bare metal servers offer additional advantages, too, including reliable processing power and consistent input/output operations per second (IOPS). Such characteristics enable them to handle demanding tasks without sharing resources. Lastly, bare metal servers can provide organizations with better control over both the server’s hardware and software stack and help applications avoid resource contention from competing software on different VMs.
How each server component plays a role in Oracle Database performance levels
Optimizing database performance requires tuning the database to your needs and efficiently using available server resources, from CPU power to memory allocation and even the database traffic of users accessing stored data. Troubleshooting performance issues can often involve solving a problem in one area and creating another in a different area, meaning that organizations must take a complex, comprehensive approach to mitigating dips in performance. The Oracle Database platform itself provides functional solutions that can help you optimize resource utilization, but even with this software-level aid, hardware improvements via the latest technology still offer significant performance enhancements and help optimize database performance.[viii]
Processors
Because Oracle Database workloads rely heavily on the processor and tend to favor single-threaded operations, organizations running those workloads on aging servers with older processor technology could see degradation in performance. When older servers are underperforming, the impulse may be to expand and simply add new servers to the environment to cover user demands. This approach has drawbacks, including potentially excessive data center expansion and increases in power and cooling costs. Instead, replacing the underperforming servers with the latest technology can drive Oracle Database performance to levels that can handle peak demands while avoiding data center expansion challenges.
Networking
Network optimization can also play a key role in database performance, ensuring that connecting users can swiftly access the application servers. Updated servers leverage newer networking hardware, which can improve bandwidth.
Storage
Another aging server component that can hamstring Oracle Database performance is storage. Improving disk input/output (I/O) efficiency can dramatically enhance transactional database performance. Because organizations typically place busy files and tablespaces, such as log files, rollback segments, and certain indexes, on the fastest accessible disks for this purpose, newer and better internal drives and updated controllers that support those drives can improve Oracle Database performance.[ix]
Memory
Maximizing physical memory utilization is also an important concern and can help you avoid swapping. Because moving memory to disk is slow, it may be more efficient to invest in additional memory if the system’s requirements exceed its current capacity. Physical memory plays a crucial role in the functioning of the System Global Area (SGA) and has a direct impact on its performance. It is important to ensure that the SGA does not exceed the available physical memory, as swapping it to disk can significantly impair Oracle Database performance.
Allocating memory properly for sort operations also ensures stronger database performance. Oracle assigns memory for data sorting through the SORT_AREA_SIZE parameter. If the sorting process cannot complete within the allocated memory, Oracle resorts to using temporary segments in the database, which leads to slower performance. Larger sizes can improve performance by reducing I/O operations but could also consume more memory, potentially causing paging issues.
Comparing old versus new: The servers we tested
To show the benefits of moving Oracle Databases 19c to bare metal 16th Generation Dell PowerEdge servers from older virtualized Dell PowerEdge R940 and PowerEdge R920 servers, we compared the transactional performance of the systems. Table 1 shows key configuration details of the servers.
For this study, we tested the latest-generation PowerEdge R960, and our comparison points are results from a previous study for the PowerEdge R940 and PowerEdge R920 servers. You can read the report for that study and see the results at https://facts.pt/fhvcwjm.
Figure 1: Key server specifications. Source: Principled Technologies.
Server model | Dell PowerEdge R960 | Dell PowerEdge R940 | Dell PowerEdge R920 |
Processor | 4x Intel Xeon Gold 6418H (24 cores/2.10 GHz) | 4x Intel Xeon Gold 6240 (18 cores/2.60 GHz) | 4x Intel Xeon E7-4890 v2 (15 cores/2.80 GHz) |
Total memory in system (GB) | 2,048 | 768 | 512 |
Memory speed (MHz) | 4,800 | 2,933 | 1,333 |
Storage | 8x Dell Ent NVMe™ P5600 MU U.2 1.6TB | 12x Intel SSDSC2KB019T8R 1.92TB 6Gbps SATA SSD
12x Dell Express Flash NVMe P4610 1.6TB PCIe NVMe SSD | 8x Seagate® ST9300653SS 300GB 15K SAS HDD
4x Seagate ST9900805SS 900GB 15K SAS HDD
12x Intel SSDSA2CW60 600GB 3Gbps SATA SSD |
Network adapter | Broadcom® NetXtreme E-Series | Intel 2P XXV710 | Intel 2P XXV710 |
Solution | Bare metal | Virtualized | Virtualized |
How we tested the Dell PowerEdge R960
We set up a single Dell PowerEdge R960 in a bare metal configuration using Oracle Enterprise Linux 8.8 for the operating system. We then installed Oracle Database 19c and used Oracle ASM to manage the storage for our data and redo logs. See the section Oracle parameters – spfile in the science behind this report for the Oracle parameters we used to configure our Oracle Database environment.
To compare the performance of the Oracle Database solutions, we used the HammerDB TPROC-C workload. HammerDB TRPOC-C reports a transactions-per-minute (TPM) rate of performance, with a higher rate meaning better performance. For our Dell PowerEdge R960 testing, we used the same 400 warehouse TPROC-C database configuration for the target dataset from our previous virtualized PowerEdge R940 and PowerEdge R920 testing. In the testing of those now legacy solutions, we used multiple small Oracle databases each running in its own VM. Similarly, we used multiple small Oracle Pluggable Databases (PDBs) for our latest-gen PowerEdge R960 testing. We scaled the same 400-warehouse database, which we ran in VMs in our PowerEdge R940 and PowerEdge R920 environments, to multiple databases using four Oracle PDBs. Using multiple datasets in each testing scenario resulted in a large aggregate TPM performance.
On a separate infrastructure host, we deployed HammerDB client VMs to drive the TPROC-C workload. We deployed them in a one-to-one relationship to the number of PDBs with each client targeting a single PDB. We ran each test for 20 mins with a 10-min warmup and targeted each PDB with 128 virtual users. We ran each test three times to ensure repeatability, and we report the median run.
Given that we were comparing between virtualized and bare metal environments, there are inevitably some differences in how we tuned each environment. We made the best decisions possible at the time of testing for each server, with a goal of coaxing the most possible performance out of each. This meant more virtualized databases and HammerDB clients in that earlier testing. For our bare metal testing, we were able to tune for higher TPM performance with only four PDBs and HammerDB clients with higher virtual user counts.
What is Oracle ASM?
Oracle Automatic Storage Management (ASM) serves as a dual-purpose file system and volume manager explicitly crafted for Oracle database files. ASM appears to operate on the premise that the database itself should manage database storage, in the hopes of eradicating the need for administrators to oversee numerous Oracle database files.[x]
At the heart of ASM are disk groups. These are clusters of disks that ASM manages collectively. Inside these disk groups, ASM offers a file system interface for Oracle database files and tries to distribute file contents evenly across all disks within a disk group.[xi]
A major potential advantage of ASM is that it allows the addition or removal of disks from a disk group while the database remains accessible. This ability comes with an automatic file content redistribution feature that can help during content reorganization.[xii]
In summary, ASM strives to simplify disk management, enhance redundancy within a disk group, provide strong I/O balancing with no manual tuning, and enable database object management without the need to specify mount points and filenames.[xiii]
What are Oracle pluggable databases?
The Oracle database, operating as a multitenant container database (CDB), can potentially incorporate multiple PDBs. In essence, these PDBs serve as movable assemblies of schemas, schema objects, and non-schema objects that appear as an Oracle Database. PDBs function akin to a standard database for applications.[xiv]
The multitenant feature of PDBs allows database admins to assign a PDB to one PDB-using group. Then they can configure access and security to the PDB so that no other PDB-using group can access it, or the database admins can configure the PDB so that another group can see only subsets of data and actions.
Multiple benefits can arise from using CDBs and PDBs, including potentially a more efficient use of resources. Compared to VMs, which duplicate the operating system, or separate databases that don’t share processes, PDBs and CDBs may help you manage resources more effectively. Furthermore, these databases can facilitate an easier transfer of data and code. If admins need to move a PDB from one CDB to another, the process should be straightforward.[xv]
Other notable potential advantages include the simplified separation of data and code, ease of performance tuning, support for Oracle Database Resource Manager, quicker and easier cloning, and more straightforward database upgrades.[xvi]
Our results: Achieve better Oracle Database performance and consolidate your data center
In our testing with the HammerDB TPROC-C benchmarking tool, the 16th Generation Dell PowerEdge R960 with 4th Generation Intel Xeon Scalable processors running Oracle Enterprise Linux 8.8 handled more Oracle Database 19c transactions than both the Dell PowerEdge R940 and the legacy Dell PowerEdge R920 servers running Windows Server 2019—up to 7.9 times the TPM. Please note that the Oracle Database EULA does not permit us to publish specific results, so we have normalized performance between the platforms. Figure 1 shows the normalized performance for each solution.
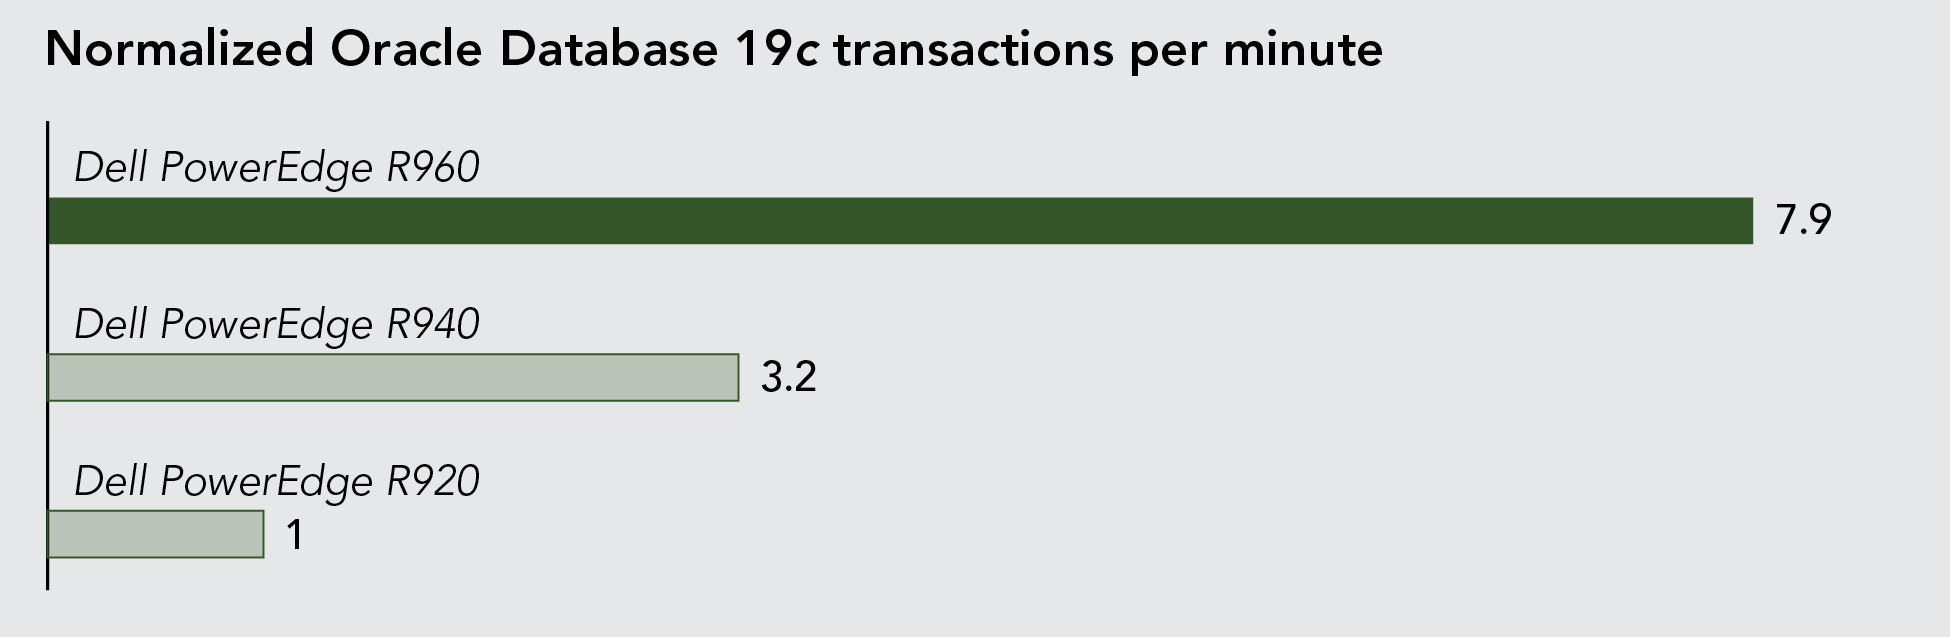
- Normalized Oracle Database 19c results for the three Dell PowerEdge solutions we tested. Source: Principled Technologies
Based on this data, your organization could handle 7.9 times the transactions by replacing a Dell PowerEdge R920 with a 16th Generation Dell PowerEdge R960. Additionally, you could handle 2.4 times the transactions of a PowerEdge R940 with a PowerEdge R960. This also means you could reduce your server inventory if you upgraded to the 16th Generation Dell PowerEdge R960 server for Oracle Database 19c workloads. A single PowerEdge R960 could replace seven PowerEdge R920 servers or two PowerEdge R940 servers and still have additional head room. Using fewer servers could reduce your operating expenses, including costs associated with power and cooling, management, and more.
In addition, consolidating systems could significantly lower database and OS licensing costs for products that use a per-core pricing model. Oracle Database and Microsoft Windows Server both license products based on core count, so fewer cores could translate to lower licensing costs if you downsized your data center. We calculated the performance per rack unit (U) of each solution and found that the 4U PowerEdge R960 delivered 7.9 times the TPM per rack unit than the 4U PowerEdge R920 and 1.8 times the TPM per rack unit than the 3U PowerEdge R940. These numbers, which we calculated by taking each solution’s TPM and dividing them by the server’s U count, could help you assess rack space in your data center occupied by the legacy servers. Based on this performance-per-rack unit ratio, you potentially could consolidate the workloads of seven legacy 4U PowerEdge R920 servers or two 3U PowerEdge R940 servers to just one 4U Dell PowerEdge R960.
These performance and consolidation advantages do not factor in the impact of aging legacy hardware. When legacy solutions begin to fail, they can require more time and effort from your admins to keep critical workloads running. New hardware restarts the aging clock and incorporates the latest management and storage technologies, which could save admin time and drive performance even higher.
About the workload we used: HammerDB 4.6
HammerDB is an open-source benchmarking tool that lets you test the performance of many leading databases. The benchmark tool includes two built-in workloads derived from industry standards: a transactional (TPROC-C) workload and an analytics (TPROC-H) workload. We chose the TPROC-C (TPC-C-like) workload to demonstrate the online transaction processing performance capabilities of each server; those workloads benefit from high core counts, fast memory, and fast drives. TPROC-C runs a transaction processing workload that simulates an ecommerce business with five types of transactions: receiving a customer order, recording a payment, delivering an order, checking an order’s status, and checking stock in inventory.[xvii] Note that our test results do not represent official TPC results and are not comparable to official TPC-audited results. To learn more about HammerDB, visit https://www.hammerdb.com/.
The benefits of upgrading to new servers for enterprise
The quality of experiences for users making purchases or otherwise accessing Oracle Database data relies on the efficiency of the underlying Oracle Database application. Using newer hardware to increase responsiveness of Oracle databases can foster user engagement and retention. Reducing latency, or the wait times between data access, speeds time to data and can thus help anyone trying to make purchases, for example. Organizations historically have believed that servers are more likely to experience issues as they age, including more frequent breakdowns,[xviii] which could lead to downtime in turn. There is a common link between downtime and revenue loss, with older estimates suggesting losses at a rate of $5,600 to $9K per minute.[xix] Although organizations likely incorporate high availability into their data center architecture, upgrading servers could help reduce the potential for downtime.
Additionally, failing databases have implications for SLAs. SLAs are contracts with clients regarding the standard of service those clients can expect. Failure to adhere to those standards, such as one resulting from a database outage, may result in SLA violations that can cause fines or other severe repercussions for a business.
Client satisfaction—the cornerstone of many organizations—can also suffer significantly in the event of a database outage. If customers cannot quickly access data, make purchases, or confirm reservations, they might simply move on to a competitor.
Which leads to our final potential negative outcome from aging servers: Your brand’s reputation may be at stake. Database outages can considerably mar a brand’s standing in the market. Customers expect reliability and uptime from the services they pay for, and any shortcomings in delivering on these assurances can adversely affect the perception of the brand and potentially send customers to competitors.
About the Dell PowerEdge R960 rack server
The Dell PowerEdge R960 is a 4U, four-socket server powered by 4th Generation Intel Xeon Scalable processors with up to 60 cores per processor. It features 64 DDR5 RDIMM slots, up to 16 TB of storage, and up to 24 NVMe SSDs. According to Dell, the PowerEdge R960 “boosts business-critical operations with unprecedented scale-up capabilities in a 4U air-cooled form factor with four (4) Intel Xeon® Scalable Processors to empower business and drive data-driven initiatives.”[xx] To learn more about the Dell PowerEdge R960, visit https://www.dell.com/en-us/shop/dell-poweredge-servers/new-poweredge-r960-rack-server/spd/poweredge-r960/pe_r960_16718_vi_vp.
About 4th Generation Intel Xeon Scalable processors
According to Intel, its strategy for 4th Gen Intel Xeon Scalable processors “aligns CPU cores with built-in accelerators optimized for specific workloads and delivers increased performance at higher efficiency for optimal total cost of ownership.”[xxi] Intel claims the processors deliver “a range of features for managing power and performance, making the best use of CPU resources to achieve key sustainability goals. In addition, the Xeon CPU Max and the Max Series GPU add high-bandwidth memory and maximum compute density to solve the world’s most challenging problems faster.”[xxii]
Conclusion
Upgrading to latest-gen servers could be a performance boon for your business-critical applications. In addition to the better transactional database performance that newer servers typically deliver, switching from virtualization to bare metal for Oracle Database could increase that performance gain. We found that the latest-gen Dell PowerEdge R960 powered by 4th Gen Intel Xeon Scalable processors processed up to 7.9 times the Oracle Database 19c transactions per minute that the legacy PowerEdge R920 server handled and up to 2.4 times the TPM the PowerEdge 940 produced. With those levels of improvement, organizations using Oracle Database for ecommerce or inventory workloads could grow their user base, generate more revenue, or improve inventory control.
In addition, data center architects and others could appreciate the space saving that comes from consolidating workloads from the new server upgrade. Our results show that the bare metal PowerEdge R960 server delivered 7.9 times the TPM per rack unit than the legacy PowerEdge R920 virtualized solution and 1.8 times the TPM per rack unit than the legacy PowerEdge R940 virtualized solution. Based on this performance-per-rack unit ratio, organizations potentially could consolidate the work of seven PowerEdge R920 servers or two legacy PowerEdge R940 servers to just one Dell PowerEdge R960.
This project was commissioned by Dell Technologies.
August 2023
Principled Technologies is a registered trademark of Principled Technologies, Inc.
All other product names are the trademarks of their respective owners.
[i] DB-Engines.com, “DB Engines Ranking,” accessed June 28, 2023, https://db-engines.com/en/ranking.
[ii] Stackshare, “Oracle,” accessed July 25, 2023, https://stackshare.io/oracle.
[iii] Oracle, “Why Choose Oracle Database for all your data needs?,” accessed June 28, 2023,
https://www.oracle.com/a/ocom/docs/database/why-choose-oracle-database-infographic.pdf.
[iv] CherryRoad Technologies, “What are the Top 8 Reasons to Use an Oracle Database?” accessed June 29, 2023, https://www.cherryroad.com/2021/10/22/oracle-database-cloud/.
[v] Oracle, “Database security,” accessed June 30, 2023, https://www.oracle.com/security/database-security/.
[vi] Miro Consulting, “Oracle Pluggable Databases; aka Multitenant,” accessed June 28, 2023, https://miroconsulting.com/blog/oracle-pluggable-databases-aka-multitenant/.
[vii] IBM, “What is a bare metal server?” accessed June 28, 2023, https://www.ibm.com/topics/bare-metal-dedicated-servers.
[viii] Oracle, “Database 2 Day + Data Warehousing Guide: Using Resources Optimally,” accessed
June 28, 2023, https://docs.oracle.com/cd/E11882_01/server.112/e25555/tdpdw_perform.
htm#TDPDW0083.
[ix] Oracle, “Database Performance Tuning Guide,” accessed June 28, 2023, https://docs.oracle.com/en/database/oracle/oracle-database/21/tgdba/designing-and-developing-for-performance.html.
[x] Oracle-Base, “Automatic Storage Management (ASM) in Oracle Database 10g,” accessed June 28, 2023, https://oracle-base.com/articles/10g/automatic-storage-management-10g.
[xi] Oracle, “Automatic Storage Management Administrator’s Guide,” accessed July 26, 2023,
https://docs.oracle.com/cd/E11882_01/server.112/e18951/asmcon.htm#OSTMG03620.
[xii] Oracle, “What is Automatic Storage Management?,” accessed June 28, 2023, https://docs.oracle.com/cd/B16351_01/doc/server.102/b14196/asm001.htm.
[xiii] Oracle, “Automatic Storage Management Administrator’s Guide.”
[xiv] DatabaseStar, “A Guide to Oracle PDB (Pluggable Database) and CDB (Container Database),” accessed June 28, 2023, https://www.databasestar.com/oracle-pdb/#What_is_a_Container_Database_and_Pluggable_Database.
[xv] Oracle, “Installation Guide for Microsoft Windows,” accessed June 28, 2023, https://docs.oracle.com/en/database/oracle/oracle-database/19/riwin/about-pluggable-databases-in-oracle-rac.html#GUID-40E8BF53-D4D8-402C-B211-D4BA88E18BD4.
[xvi] Oracle, “Pluggables, Clones and Containers: Oracle Multitenant Fundamentals›Introduction,” accessed June 28, 2023, https://oracle.github.io/learning-library/data-management-library/database/multitenant-new/workshops/livelabs/.
[xvii] HammerDB, “Understanding the TPROC-C workload derived from TPC-C,” accessed June 28, 2023, https://www.hammerdb.com/docs/ch03s05.html.
[xviii] Statista, “Frequency of server failure based on the age of the server,” accessed July 26, 2023, https://www.statista.com/statistics/430769/annual-failure-rates-of-servers/.
[xix][xix] Atlassian, “Calculating the cost of downtime,” accessed July 26, 2023, https://www.atlassian.com/incident-management/kpis/cost-of-downtime.
[xx] Dell, “PowerEdge R960,” accessed July 20, 2023, https://www.delltechnologies.com/asset/en-us/products/servers/technical-support/poweredge-r960-spec-sheet.pdf.
[xxi] Intel, “4th Gen Intel Xeon Scalable Processors,” accessed May 2, 2023, https://www.intel.com/content/www/us/en/newsroom/resources/press-kit-4th-gen-intel-xeon-scalable-processors.html.

Dell PowerEdge R660xs: Maximize VDI density
Thu, 14 Mar 2024 16:56:05 -0000
|Read Time: 0 minutes
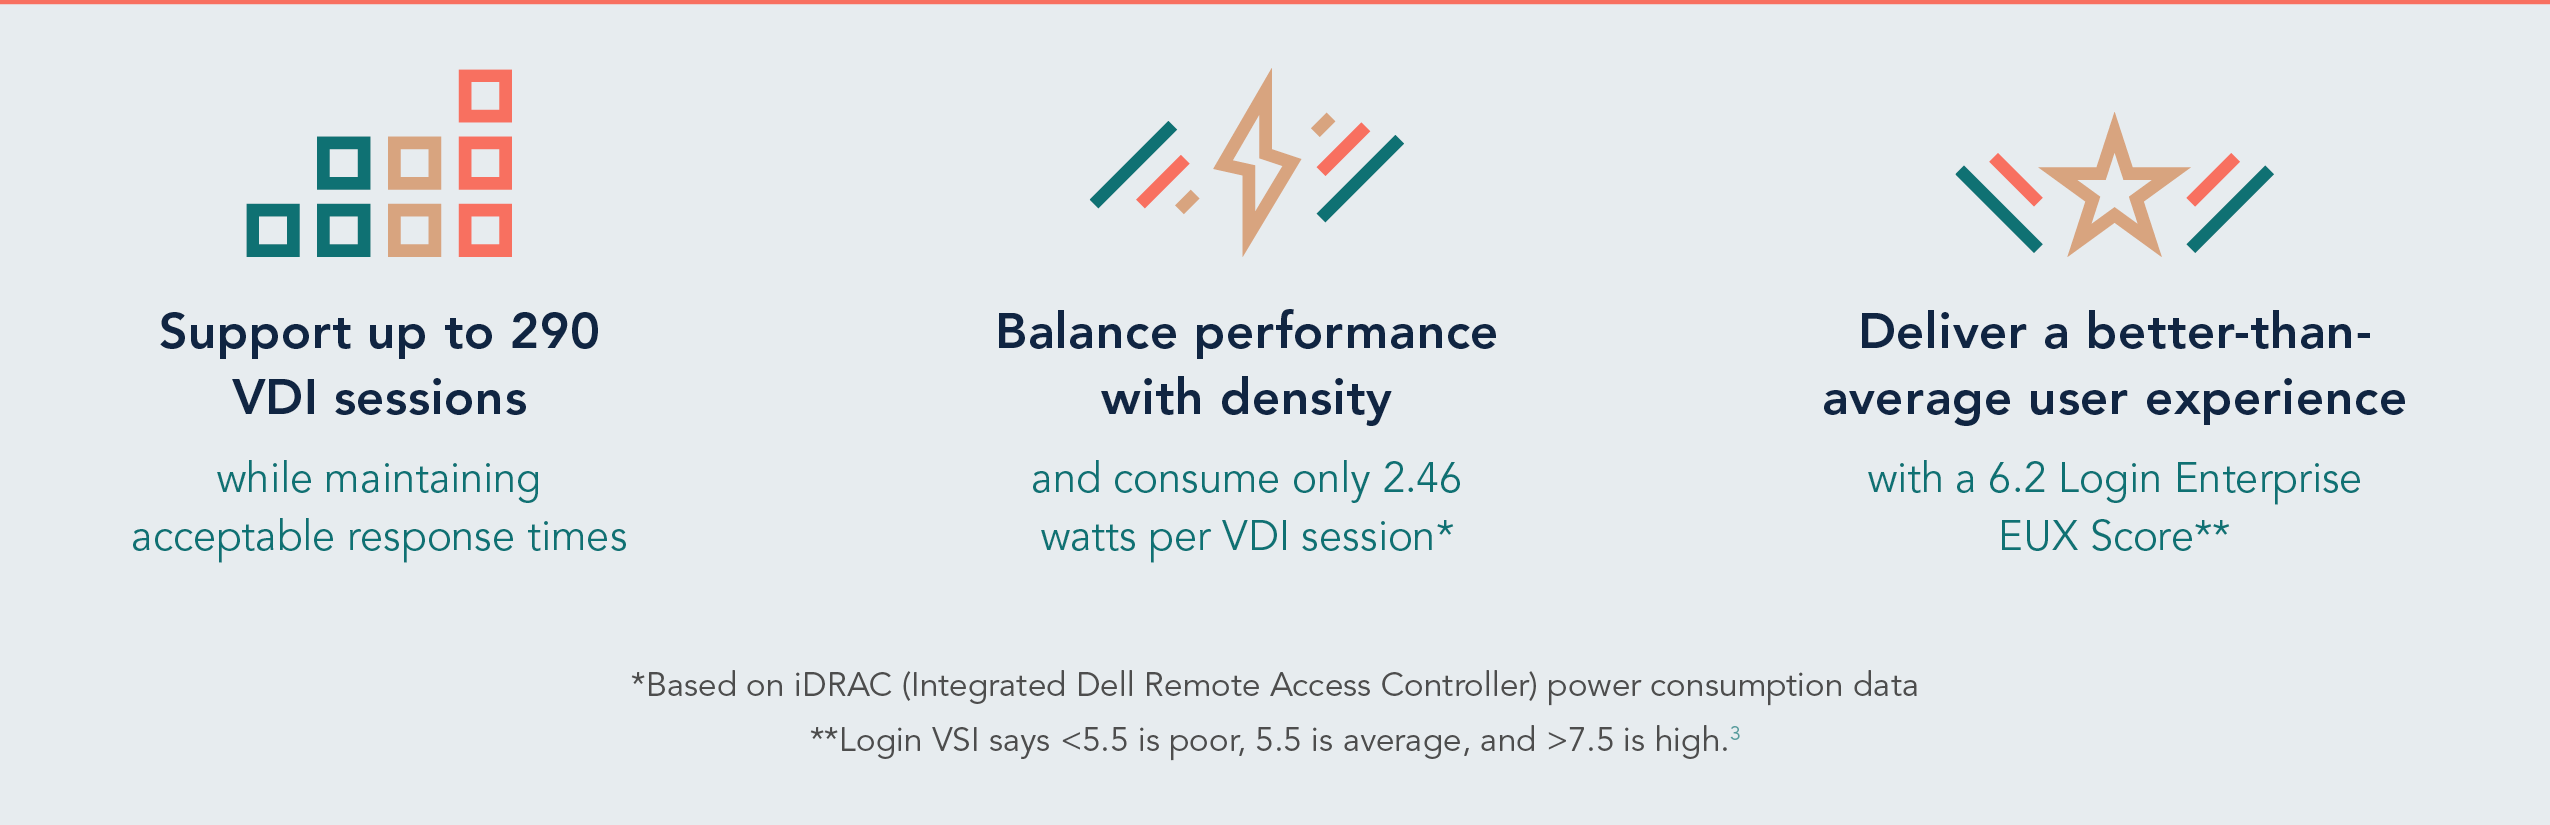 Virtual desktop infrastructure (VDI) administrators endeavor to deliver the best remote-user experience while getting the most from data center resources. Dell™ PowerEdge™ xs servers have an open vent pattern for optimal airflow and are, according to Dell, specifically tuned for virtualization workloads. These models also have fewer DIMM slots than standard PowerEdge servers, which reduces power draw. This, in turn, reduces cooling needs. These features in a 1U form factor enable admins to reduce data center carbon footprints by consolidating server racks and simplifying power and cooling needs.
We used the Login Enterprise benchmark to determine the number of remote desktop sessions a Dell PowerEdge R660xs server powered by two Intel® Xeon® Gold 6448Y processors could deliver within acceptable end-user latency parameters. This industry-standard benchmark helps IT teams “achieve the optimal balance between user experience and cost.” We found that the Dell PowerEdge R660xs server configuration we tested supported 290 VDI sessions, consumed only 2.46 watts per VDI session, and delivered a better-than-average end-user experience (EUX).
 Figure1. Dell PowerEdge R660xs server
How we tested
To measure VDI user density on the Dell PowerEdge R660xs server powered by two Intel Xeon Gold 6448Y processors, we set up a VMware Horizon® 8 VDI environment with Windows 10 images using two vCPUs, 3 GB of RAM, and running Microsoft Office 2019. We evaluated this PowerEdge R660xs configuration in multiple ways:
- Determining the total VDI sessions: To measure VDI user density, we used the Login Enterprise 2022 Knowledge Worker workload.[i] The Login Enterprise VSIMax represents the total number of VDI sessions this Dell PowerEdge R660xs server configuration handled within acceptable latency parameters on this workload. In addition to EUX performance input metrics, Login VSI, the company behind the Login Enterprise benchmark, “carefully chose and tuned the timers to also reflect the load that a virtualization system experiences when increasing the number of sessions that run on that system.”[ii]
- Calculating VDI density: We gauged power efficiency by determining the watts per VDI session the server consumed while running at maximum VDI user density. In our tests, the Dell PowerEdge R660xs powered by two Intel Xeon Gold 6448Y processors supported 290 VDI sessions and consumed an average of 714 watts at peak usage.
- Evaluating the VDI user experience: The Knowledge Worker workload keeps up to five Office 365 apps, plus Microsoft Edge, open simultaneously. The Login Enterprise EUX Score decreases as the number of users increases—just as performance decreases as systems get busier and process more load. The Login Enterprise EUX Score reflects real-world virtual desktop user operations.”[iii]
The Login Enterprise benchmark and power efficiency results we report reflect the specific server configuration and VDI environment we tested. Any difference in the configuration, as well as network traffic, browser changes, or software additions, can affect these outcomes. For more information on our testbed, testing parameters, and reporting procedures, see the science behind the report.
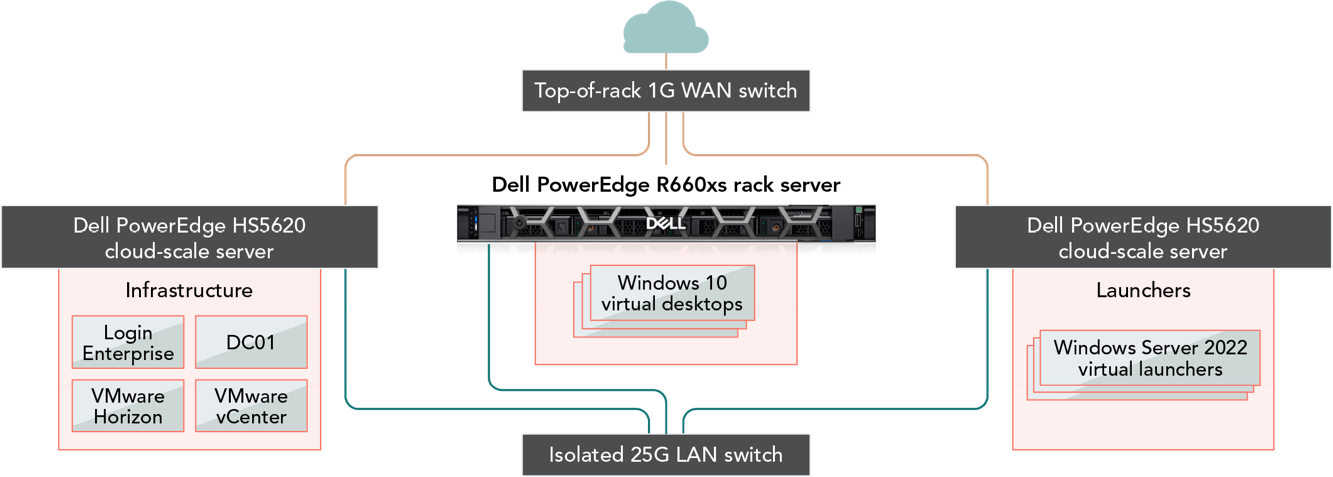 Figure 2. Our testbed setup. Image of the Dell PowerEdge R660xs provided by Dell. Source: Principled Technologies.
Support hundreds of remote desktop sessions
The Login Enterprise VSIMax reflects how many desktop sessions a server can support until the moment the end-user experience dips below an acceptable wait threshold. The benchmark determines the acceptable wait threshold based on a median of application response times. Once it has that, Login Enterprise assigns a rating at the point the EUX score falls below the predetermined threshold for 3 consecutive minutes.
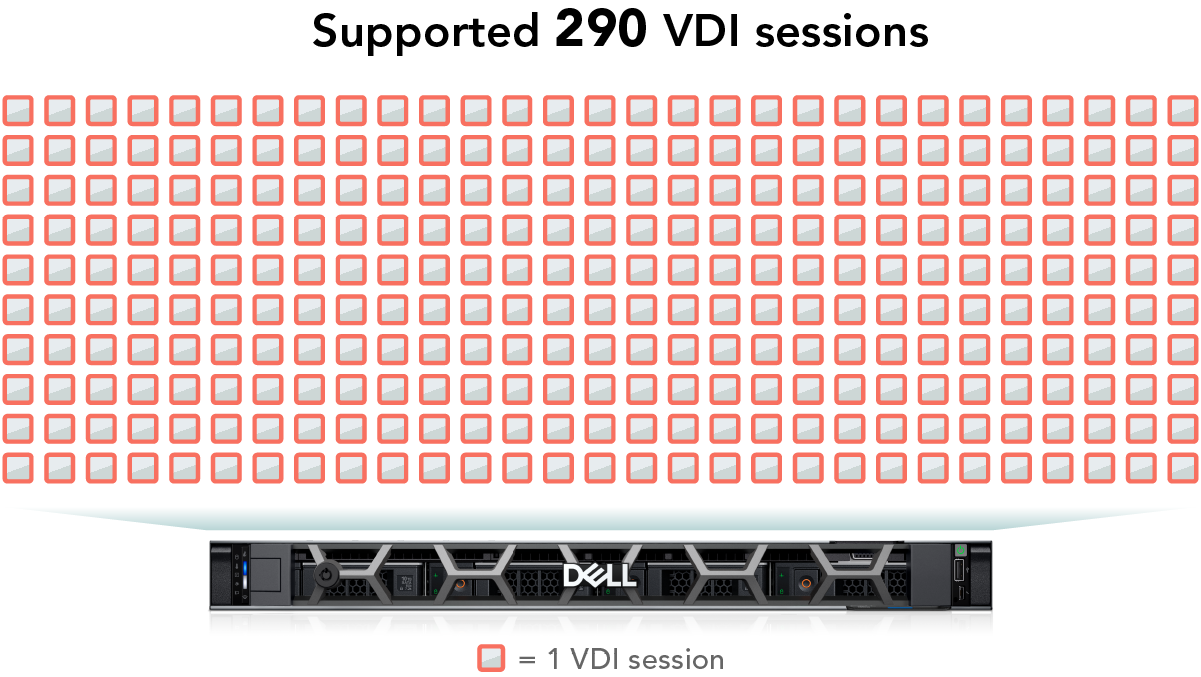 Figure 3. Login Enterprise 2022 Total Knowledge Worker VSIMax results. Image of the Dell PowerEdge R660xs provided by Dell. Source: Principled Technologies.
About the new Dell PowerEdge R660xs rack server
According to Dell, the air-cooled PowerEdge R660xs is built to balance performance and density and is capable of running the most popular applications and workloads. It is a highly configurable 1U server that fits in existing data center environments. This Zero Trust-capable server can also integrate with OpenManage Enterprise and CloudIQ solutions to optimize server management and operations.
Fast performance
Up to two 4th generation Intel Xeon Scalable processors with up to 32 cores per socket
Fast memory
Up to 16 DDR5 RDIMMS (up to 4,800 MT/sec)
PCle® Gen 5 speed
High-bandwidth networking and storage throughput[iv]
Learn more about the PowerEdge R660xs at https://www.delltechnologies.com/asset/en-us/products/servers/technical-support/poweredge-r660xs-spec-sheet.pdfOpens in a new window.
Balance performance with density
Dell designed the PowerEdge R660xs server to “minimize the carbon footprint of your data center by better matching the system power consumption with anticipated workload requirements.”[v] Our results show a Dell PowerEdge R660xs server powered by two Intel Xeon Gold 6448Y processors was capable of supporting 290 VDI sessions while consuming, on average, 714 watts under full load according to iDRAC power consumption data. That comes out to just 2.46 watts per VDI session.
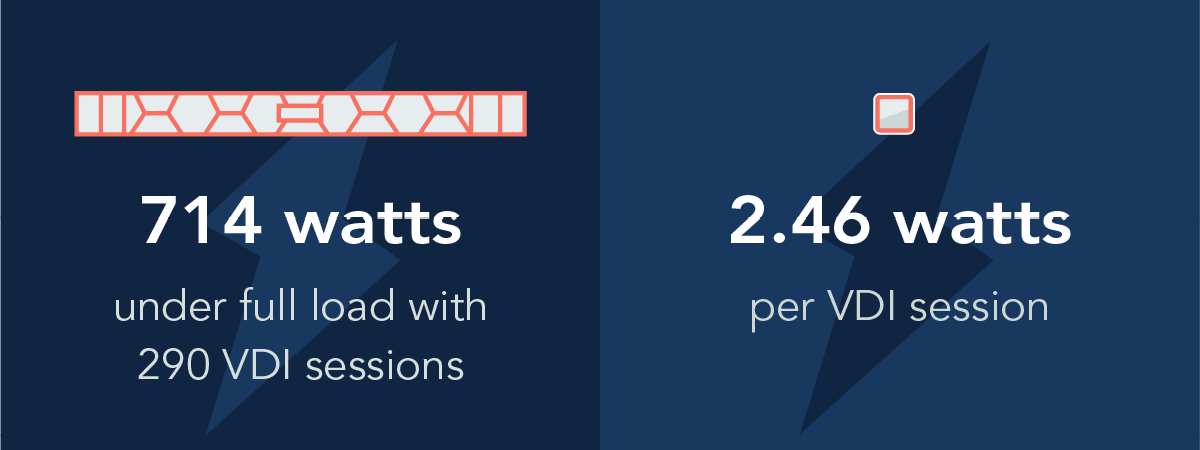
Figure 4. iDRAC power consumption results. Source: Principled Technologies.
About iDRAC
Dell Technologies amplifies visibility into PowerEdge server hardware resources with the iDRAC embedded in every Dell PowerEdge server.[vi]
Dell designed the iDRAC “for secure local and remote server management that helps IT administrators deploy, update and monitor PowerEdge servers anywhere, anytime.”[vii]
iDRAC features:
- iDRAC9 Telemetry Streaming
- Secured Component Verification
- iDRAC RESTFul API with Redfish support
- Agent-free embedded server management[viii]
Deliver a better-than-average user experience
The Login Enterprise EUX Score is derived from several actions that represent day-to-day activities and could affect end-user satisfaction.[ix] These are the operations the EUX score reflects:
- Launch a complete application with UI until it is ready for user input
- Keyboard input processing
- CPU-heavy actions
- Actions that mix CPU and disk I/O[x]
The Login Enterprise EUX application response times are a median of the slowest application response times, which better reflect how long users might find themselves waiting.[xi]
Table 1. Login Enterprise Knowledge Worker EUX metrics for the Dell PowerEdge R660xs.
Login Enterprise Knowledge Worker EUX metrics | Result |
EUX Score | 6.2 |
Average of all app response time medians (seconds) | 1.50 |
Median PowerPoint launch time (seconds) | 1.39 |
Median Edge browser page load time (seconds) | 2.63 |
About Login Enterprise
The Login Enterprise benchmark mimics real user activity to determine the user experience and application response times in virtual desktop environments.[xii] According to Login VSI, Login Enterprise’s 360° approach “delivers insights into the performance, cost, and capacity of your virtual desktops and applications – from production to delivery and across locations, settings, and infrastructure.”[xiii]
About the Intel Xeon Gold 6448Y processor
Part of the 4th Generation Intel Xeon Scalable Processor family, the Intel Xeon Gold 6448Y processor has 32 cores, 64 threads, a maximum turbo frequency of 4.10 GHz, a processor base frequency of 2.10 GHz, and a 60MB cache.[xiv] According to Intel, Intel Xeon Gold 6400 processors “are optimized for demanding mainstream data center, multicloud compute, and network and storage workloads.”[xv]
Conclusion
Choosing the right VDI solution can empower your employees to be more productive with a responsive desktop experience and set your company up for growth. In our Login Enterprise benchmark tests, a Dell PowerEdge R660xs powered by 4th Generation Intel Xeon Scalable processors supported 290 VDI sessions while consuming an average of only 2.46 watts per VDI session and maintaining acceptable virtual desktop response times. Maximizing virtual desktop density, as this Dell PowerEdge R660xs configuration did, opens the door to other benefits, including server rack consolidation and simplified power and cooling needs.
This project was commissioned by Dell Technologies.
June 2023
Principled Technologies is a registered trademark of Principled Technologies, Inc.
All other product names are the trademarks of their respective owners.
[i] Login VSI, “Introducing the New Login Enterprise 2022 Knowledge Worker Workload,” accessed June 2, 2023, https://www.loginvsi.com/resources/blog/login-enterprise-2022-knowledge-worker-workload/.
[ii] Login VSI, “Login Enterprise EUX Score,” accessed June 5, 2023, https://support.loginvsi.com/hc/en-us/articles/4408717958162-Login-Enterprise-EUX-Score.
[iii] Login VSI, “Login Enterprise EUX Score.”
[iv] Dell Technologies, “New PowerEdge R660xs Rack Server,” accessed June 1, 2023, https://www.dell.com/en-us/shop/dell-poweredge-servers/new-poweredge-r660xs-rack-server/spd/poweredge-r660xs/.
[v] Dell Technologies, “PowerEdge R660xs Specification Sheet,” accessed June 1, 2023,https://www.delltechnologies.com/asset/en-us/products/servers/technical-support/poweredge-r660xs-spec-sheet.pdf.
[vi] Dell Technologies, “Server Power Consumption Reporting and Management,” accessed June 1, 2023, https://infohub.delltechnologies.com/p/server-power-consumption-reporting-and-management/.
[vii] Dell Technologies, “Integrated Dell Remote Access Controller (iDRAC),” accessed June 1, 2023, https://www.dell.com/en-us/dt/solutions/openmanage/idrac.htm.
[viii] Dell Technologies, “Integrated Dell Remote Access Controller (iDRAC).”
[ix] Login VSI, “Login Enterprise EUX Score,” accessed June 5, 2023, https://support.loginvsi.com/hc/en-us/articles/4408717958162-Login-Enterprise-EUX-Score.
[x] Login VSI, “Login Enterprise EUX Score.”
[xi] Login VSI, “Login Enterprise EUX Score.”
[xii] Login VSI, “Login Enterprise Platform Overview,” accessed June 5, 2023, https://www.loginvsi.com/wp-content/uploads/2023/04/login-enterprise-overview-datasheet.pdf.
[xiii] Login VSI, “Login Enterprise Platform Overview.”
[xiv] Intel, “Intel® Xeon® Gold 6448Y Processor,” accessed June 1, 2023, https://www.intel.com/content/www/us/en/products/sku/232384/intel-xeon-gold-6448y-processor-60m-cache-2-10-ghz/specifications.html.
[xv] Intel, “4th Gen Intel® Xeon® Scalable Processors,” accessed June 1, 2023, https://www.intel.com/content/www/us/en/products/details/processors/xeon/scalable/gold.html.
Author: Principled Technologies

AI-related Performance Testing of PowerEdge MX760c vs. PowerEdge MX750c

Thu, 14 Mar 2024 16:56:05 -0000
|Read Time: 0 minutes
Trust the numbers: Dell PowerEdge MX760c using 4th generation Intel® Xeon® Scalable Processors performs better machine learning.
Grid Dynamics set out to review whether taking a CPU-only (non-GPU) approach is effective in training and inference tasks for small and medium-sized machine learning models (up to ten million parameters), and whether it is a good solution for running larger models (with hundreds of millions of parameters) effectively in inference mode. They also wanted to review improvement in server performance, generation to generation.
To understand how the MX760c model series handles significant artificial intelligence/machine learning workloads as compared to the MX750c model series, Grid Dynamics developed four use cases that simulate the computational needs of retail, industrial, and IT infrastructure:
1. A recommendation system for analyzing user preferences and creating personalized recommendations.
2. A sales forecasting and inventory decision support tool for store managers for keeping the inventory optimized against actual and forecasted demand, and for planning for stock replenishment.
3. Anomaly detection for industrial timeseries for analyzing anomalies in telemetry data and detecting failure probability in industrial hardware.
4. Popular machine learning for evaluating server performance through a series of standardized tests.
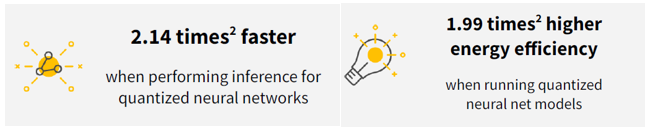
(2) Based on testing performed by Grid Dynamics, February 2023.
The tests team concluded that Dell PowerEdge MX760c – leveraging Intel® Xeon® Gold 6430 (2.10 / 32 core) CPUs – performs better in machine learning than MX750c leveraging Intel® Xeon® Platinum 8368 (2.40 GHz /38 core) CPUs. The MX760C used Intel® Xeon® Gold 6430 that supports the Advanced Matrix Extensions accelerator that improves the performance of deep-learning training and inference. The Gold 6430 also supports faster DDR5 memory.
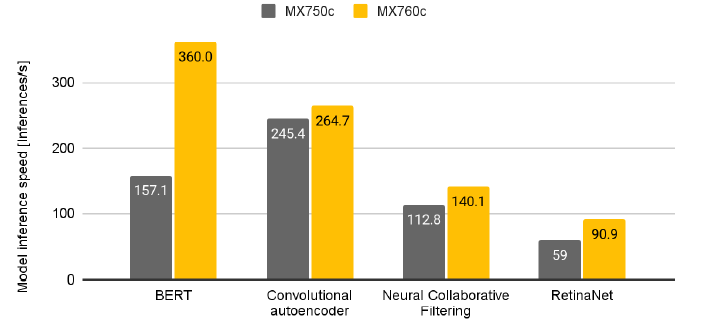
Figure 1. Inference speed (neural ML models – Inferences per Second (higher is better)
Advanced Matrix Extensions (AMX) technology implemented in “Sapphire Rapids” 4th generation of Intel® Xeon® Scalable Processors CPUs allows these servers to perform matrix operations for quantized (Int8 and Bf16) ML models much faster.
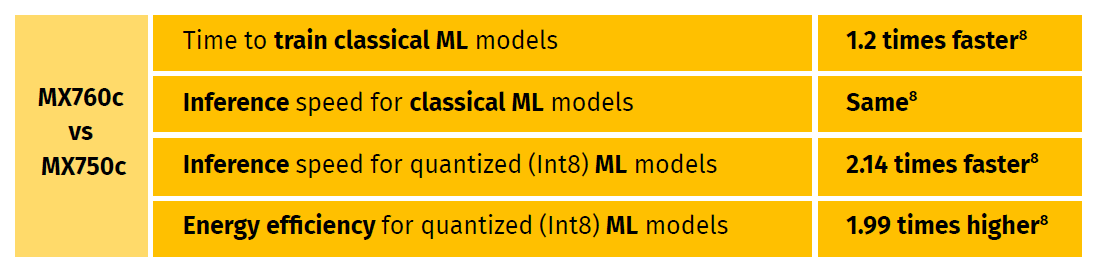
(8) Based on testing performed by Grid Dynamics, February 2023.
To summarize, Dell PowerEdge MX760c has proven itself to be a faster and a more capable solution than the previous generation MX750c server for the studied use cases. For more details, see the benchmark and testing results in these documents:
Executive Summary - Performance Comparison of Dell PowerEdge MX760c and MX750c Server Models
Technical Paper - Performance Comparison of Dell PowerEdge MX760c and MX750c Server Models

Upgrade transactional database performance with Dell PowerEdge R660 servers running VMware vSphere 8.0
Thu, 14 Mar 2024 16:56:05 -0000
|Read Time: 0 minutes
In a VMware vSAN cluster, the latest‑generation servers powered by 4th Generation Intel Xeon Scalable processors completed more orders per minute (OPM) than clusters of older servers
Online transactional processing (OLTP) performance can affect your ability to generate revenue, offer services, and support users. Replacing aging servers with a VMware vSAN™ cluster of latest-generation Dell™ PowerEdge™ R660 servers powered by 4th Generation Intel® Xeon® Scalable processors, or just adding the new servers to your data center, could boost OLTP workload performance to meet current or future needs.
We found that latest-generation Dell PowerEdge R660 servers processed more transactions for Microsoft SQL Server OLTP workloads running in a vSAN cluster. Compared to the performance of older Dell PowerEdge R650 or R640 servers in vSAN clusters at the time of their releases, the performance of the latest-generation servers could help your organization generate more revenue, offer more services, or expand your user base.
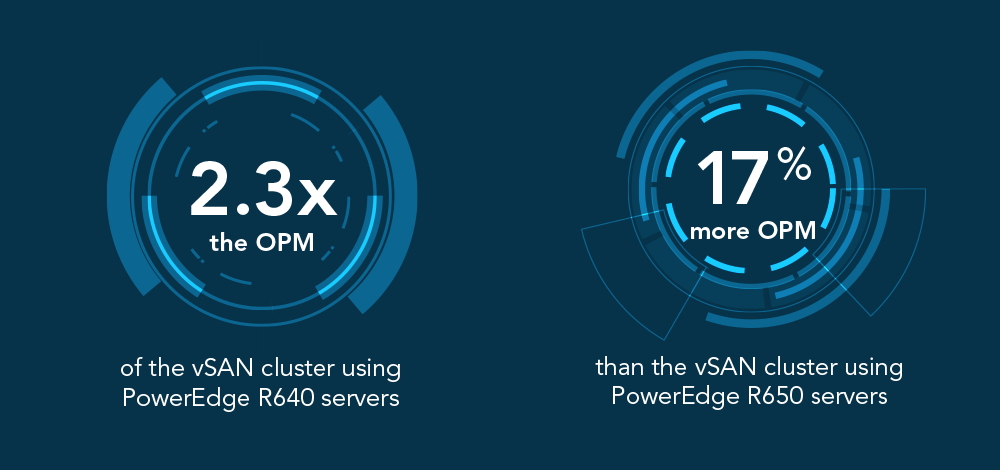
Our results
The testing results for the PowerEdge R650 and R640 servers come from our previous work. We’ve continued that work in this study with the latest-generation Dell PowerEdge R660 server, comparing its OLTP results to those we found in the previous study. Thanks in part to its 4th Generation Intel Xeon Scalable Gold 6430 processors, the latest-generation PowerEdge R660 servers show strong performance improvements compared to PowerEdge R650 and R640 models.
Generate more revenue with greater application delivery capacity
The PowerEdge R660 cluster hosted 42 Microsoft SQL Server 2022 VMs (14 VMs per host), against which we ran iterations of an OLTP workload that we created with the benchmarking tool DVD Store 2 (DS2). The latest-generation servers delivered 17 percent more OPM than the previous-generation PowerEdge R650 solution and 2.3 times the OPM of the older PowerEdge R640 solution (see Figure 1).
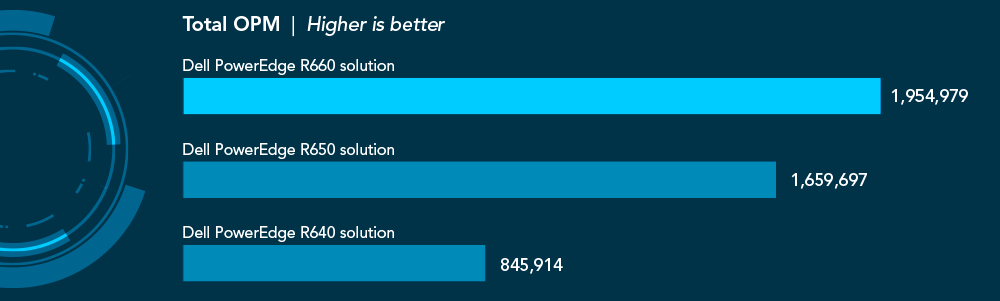 Figure 1:Total OPM each solution achieved while running the OLTP workloads against SQL Server 2022 VMs. Higher is better. Source: Principled Technologies.
Based on these outputs, a vSAN cluster of latest-generation PowerEdge R660 servers with 4th Generation Intel Xeon Scalable processors could help organizations handle more e-commerce orders now and in the future.
Conclusion
If the performance of your Microsoft SQL Server workloads has diminished over time or just cannot keep up with the growing demands of your organization, new servers could help you rectify those problems. In our transactional database testing, a VMware vSAN cluster of latest-generation Dell PowerEdge R660 servers with 4th Generation Intel Xeon Scalable processors outperformed clusters of the servers’ two most recent predecessors. The latest-generation solution handled 17 percent more OPM than the PowerEdge R650 server cluster and 2.3 times the OPM of the PowerEdge R640 cluster.

Run more data analysis more quickly using Dell PowerEdge R760 servers
Thu, 14 Mar 2024 16:56:05 -0000
|Read Time: 0 minutes
The latest-generation Dell PowerEdge R760 server, powered by 4th Generation Intel Xeon Scalable processors, performed more data analysis in less time than either older server we tested
Insight from data analytics can translate into timely decision-making and a better understanding of operations. By adding latest-generation Dell™ PowerEdge™ R760 servers to your data center, or replacing aging servers with them, you could run data analysis workloads faster to gain insights sooner.
At Principled Technologies, we assessed the data warehouse capabilities of three Dell PowerEdge server models: a latest-generation PowerEdge R760 powered by 4th Generation Intel® Xeon® Scalable processors, a previous-generation PowerEdge R750, and a PowerEdge R740xd. The PowerEdge R760 analyzed more data than either older server and needed less time to do so, which can help you get key business metrics sooner while maintaining a competitive edge.
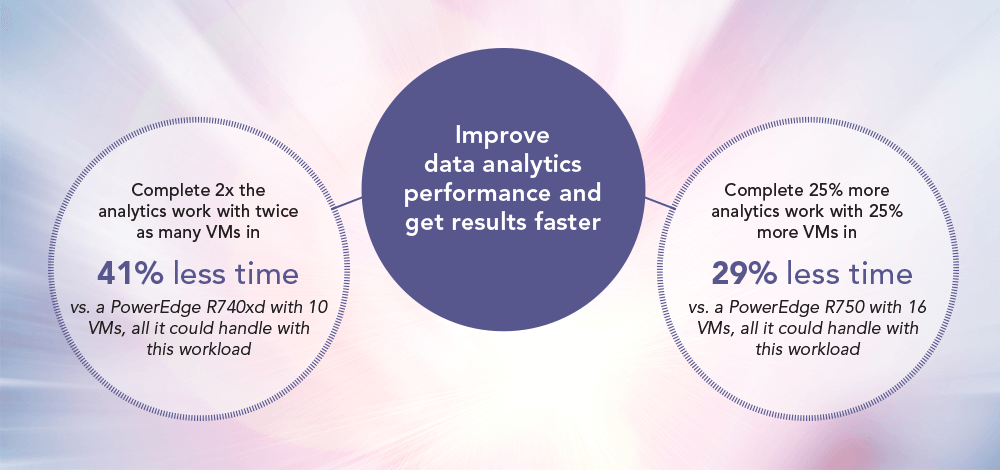
Our results
The testing results for the PowerEdge R750 and R740xd servers come from our previous work. We’ve continued that work in this study with the latest-generation Dell PowerEdge R760 server, comparing its analytics performance results to those we found in the previous study. Thanks in part to its 4th Generation Intel Xeon Scalable Platinum 8452Y processors, the latest-generation PowerEdge R760 servers show strong performance improvements compared to PowerEdge R750 and R740xd models.
Run more data warehouse workloads
We ran the HammerDB TPROC-H workload on as many VMs as each server could handle. Thus, the servers that supported more VMs also could handle more workloads. Figure 1 shows the VM count each solution supported while running our query workload.
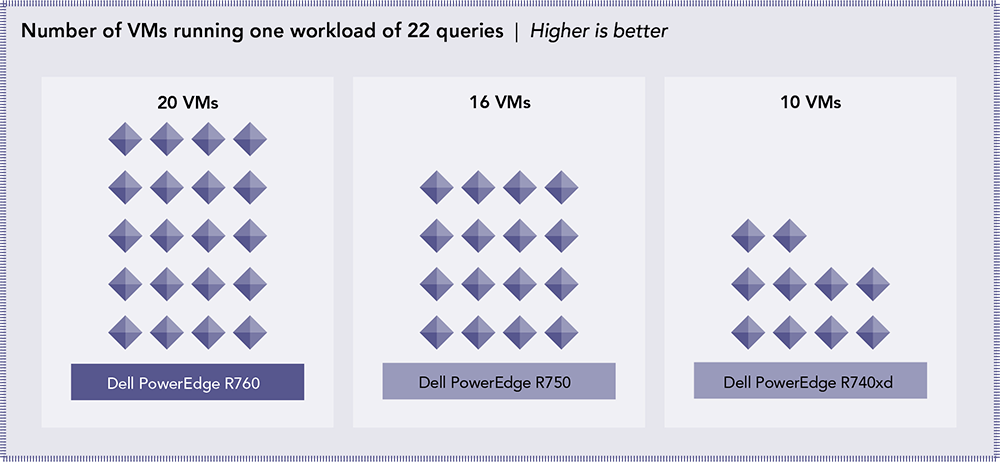 Figure 1: VM count for each solution. Higher is better. Source: Principled Technologies.
Compared to the seven-year-old PowerEdge R740xd, which supported just 10 VMs, the PowerEdge R760 running 20 VMs completed twice as much work.
The PowerEdge R750 server from our previous study was more capable than the PowerEdge R740xd, supporting 16 VMs before it showed signs of saturation. Compared to the PowerEdge R750, the latest-generation PowerEdge R760 ran 25 percent more work, handling 20 VMs.
See results from data analytics workloads sooner
Having data center resources that allow users to do more work is helpful—it allows IT decision makers to consider consolidating workloads onto fewer servers or increasing a data center’s virtual density without increasing its physical footprint. Figure 2 shows the average time to complete the set of queries for each server solution.
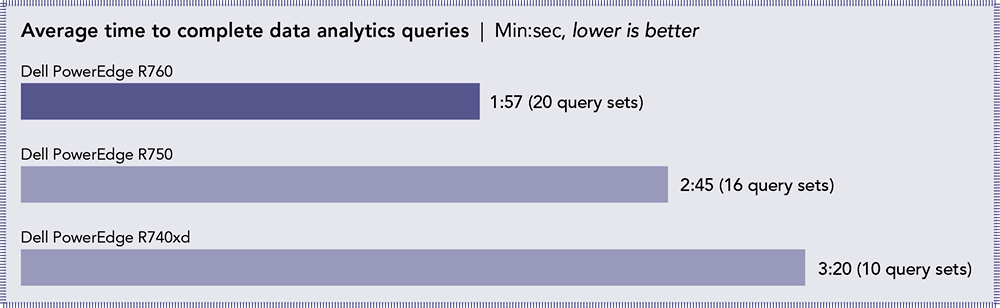 Figure 2: Time to complete data analytics queries in minutes and seconds. Lower times are better. Source: Principled Technologies.
The latest-generation PowerEdge R760 needed 29 percent less time on average than the PowerEdge R740xd and 41 percent less time on average than the PowerEdge R750.
Conclusion
Data analytics can play a critical role in understanding your organization. With timely data analysis, decision‑makers can respond to trends or activity quickly and with the support of data-driven insight. New Dell PowerEdge R760 servers, either in addition to or in place of aging servers, can boost data warehouse workload performance to deliver insights sooner. In our testing, a latest-generation Dell PowerEdge R760 server powered by 4th Generation Intel Xeon Scalable processors completed 20 data analytics workloads in up to 41 percent less time than older Dell PowerEdge R750 and PowerEdge R740xd servers.
This project was commissioned by Dell Technologies.
February 2023
Principled Technologies is a registered trademark of Principled Technologies, Inc.
All other product names are the trademarks of their respective owners.