XR4000: Don’t be Afraid of the Edge!
Tue, 06 Dec 2022 23:18:48 -0000
|Read Time: 0 minutes
Halloween is just around the corner, and we have been seeing all sorts of innovative decorations around our neighborhood. The malls and shops are filled with cool gadgets to get the best scare out of you. Well, everything is getting an upgrade with technology, so why not Halloween? Are you trying to set up the haunted house you always wanted? AR apps are a must-try for that! Need a dancing skeleton, friendly ghost Casper, or maybe just the fanciest costume for your dog? Everything is possible with the help of an edge computing solution. Bringing the processing and computing of a data center to the edge and reducing latency to a minimum enables myriad use cases for retail and manufacturing.
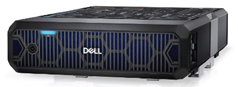
Dell Technologies’ latest PowerEdge server, Dell PowerEdge XR4000, powered by Intel Xeon-D HCC 2700 SoC, comes in a unique sled and chassis form factor. One of the best values of this server is the short depth of just 355 mm (with bezel) (see PowerEdge XR4000—Small But Mighty), which enables you to put this server in a shoebox or mount it on a closet wall and forget about it. The sled comes in 1U and 2U form factors, which enables various deployment options depending on the edge workload. It is purpose-built for rugged conditions and can operate in a temperature range of –5°C to 55°C. So whether you are in Texas or California, XR4000 will continue to perform reliably. No need to worry about dust storms, tornadoes, or hail because this edge server has industry-standard certification for NEBS and MIL-STD.
PowerEdge XR4000 is powered by Intel Xeon D (Ice Lake D), making it Dell’s first Xeon D-based server. This ”made-for-the-edge” CPU comes with up to 20 cores with support of extended temperatures. It is up to 2.97x faster than its previous generation Skylake-D. The AI inferencing (CPU) gains have been improved by up to 7.4x. Ethernet connectivity is up by 400%, by providing networking up to 100 GbE and a variety of port options, with up to eight ports at 25, 10, or 1 Gbps with RDMA (iWARP and RoCEv2). Ethernet processing throughput is up by 150%, with 50 Gbps and 100 Gbps throughput options.
Support for NVIDIA A2 and A30 GPUs also enables smooth operation for AI/ML workloads. We ran industry-standard MLPerf 2.0 for ssd-resnet34 (object detection, large) workload testing on XR4000 with 1 x A2 GPU and concluded that it has 11% lower latency (in milliseconds) than a 1 x A2 GPU configuration of Supermicro SYS-220HE for multi-stream scenario.[1a] This means that XR4000 can analyze frames from multiple cameras simultaneously 11% faster than Supermicro.[1b] So, Halloween need not be limited to just the scary gadgets; we can also ensure the security in our neighborhood by real-time tracking of our streets and live video streams, making sure that no suspicious activity is taking place around the block. XR4000 also has 12% more throughput (in samples/second) than Supermicro SYS-220HE in ssd-resnet34 (object detection, small) offline scenario [2a] (one of the most used real-life scenarios). This means if you don’t have a constant flow of data, and instead have it all in the memory, XR4000 can identify the people and locations in a photo album much faster.[2b] The offline scenario represents batch-processing applications where all data is immediately available and latency is unconstrained.
One of my favorite Halloween characters is Hermione, so how can we leave a Harry Potter-themed party out of the picture? The “Sorting Hat” is the magical AI that can recognize and assign the Hogwarts house, but with the XR4000 using BERT NLP, we can truly offer real-life AI that delivers better outcomes and lower latency. If you want to test your knowledge of Harry Potter trivia, use AI’s help to get the right answers immediately. The secret sauce here would be using a natural language processing (NLP) tool called BERT (Bidirectional Encoder Representations from Transformers). Before BERT, NLP was unidirectional, which means the algorithm could only understand text read in one direction. BERT understands text in both directions, so it’s easy for it to get full context with just a word. We ran a similar workload on XR4000 using MLPerf 2.0 called bert-99 (Lang Processing) with an A2 GPU. It resulted in 11% lower latency than the Supermicro SYS-220HE (lower is better). [3a,b]
So far, Halloween is looking great with XR4000, but that’s not it. We can add more features pertaining to the safety of the kids. For example, parents can choose to witness their children during trick or treating without getting in the way of the fun—in the same way XR4000 with its optional Nano server sled can provide an in-chassis witness node for a vSAN cluster. Replacing the need for a virtual witness node, the Nano server can function as an in-chassis witness node, allowing for a native, self-contained 2-node vSAN cluster in even the 14” x 12” stackable server chassis. This allows for VM deployments where the option was previously out of the question due to latency or bandwidth constraints, and, ultimately, we can just come up with a virtual trick-or-treat app! A single-socket Dell PowerEdge XR4000 server equipped with the Intel Xeon D-2776NT has a VMmark Power Performance score of 3.64 @ 4 Tiles.[4] This is representative of different virtualization workloads that can run optimally maintaining the constraints of latency important for the edge with a strong level of performance while keeping power measurement in check, making it an excellent choice for edge customers who want to take advantage of the benefits that virtualization has to offer.
All these use cases are in the category of edge computing. Compute and storage resources are placed closer to where data is collected, processed, and consumed, eliminating the backhaul latency that occurs when sending/receiving data from a traditional data center. On top of all this, system management provides options so you don’t need to worry about maintenance issues or missing a data point or trends because at the heart of PowerEdge XR4000 is the integrated Dell Remote Access Controller 9 (iDRAC9). It is embedded in the server to streamline the process of deployment, update, service, and troubleshooting—all remotely or from your cellphone app.
It’s safe to say that the edge does not scare us anymore! PowerEdge XR4000 is a unique short-depth edge server that helps with low power and low footprint, and ultimately lowers TCO.
To learn more about the PowerEdge XR4000, see PowerEdge XR Rugged Servers.
Reference
[1a] Unverified MLPerf v2.0 Inference ssd-resnet34 (object detection, large), multistream. Result not verified by MLCommons Association. MLPerf name and logo are trademarks of MLCommons Association in the United States and other countries. All rights reserved. Unauthorized use strictly prohibited. See www.mlcommons.org for more information.
[1b] Based on testing conducted in Dell Cloud and Emerging Technology lab. For a multistream video, XR4000 has 11% less latency than Supermicro SYS-220HE for object detection (large workload).
[2a] Unverified MLPerf v2.0 Inference ssd-resnet34 (object detection, small), offline. Result not verified by MLCommons Association. MLPerf name and logo are trademarks of MLCommons Association in the United States and other countries. All rights reserved. Unauthorized use strictly prohibited. See www.mlcommons.org for more information.
[2b] Based on testing conducted in Dell Cloud and Emerging Technology lab, For an offline scenario, XR4000 has 12% more throughput than Supermicro SYS-220HE for object detection (small workload).
[3a] Unverified MLPerf v2.0 Inference bert-99 (Lang Processing). Result not verified by MLCommons Association. MLPerf name and logo are trademarks of MLCommons Association in the United States and other countries. All rights reserved. Unauthorized use strictly prohibited. See www.mlcommons.org for more information.
[3b] Based on testing conducted in Dell Cloud and Emerging Technology lab, For a single-stream video, XR4000 has 11% lower latency than Supermicro SYS-220HE for language processing task.
[4] Based on the performance testing conducted in Dell Solution Performance Analysis (SPA) lab on 9/30/2022.
Related Blog Posts
Six Years of Tower Servers: Accelerate Business Insights with AI Inferencing and the PowerEdge T560
Mon, 13 Nov 2023 19:44:02 -0000
|Read Time: 0 minutes
Tasked with describing PowerEdge tower servers in three words, ChatGPT landed on, “Reliable. Versatile, Scalable,” perfectly capturing the key qualities of PowerEdge towers. In the following blog, we’ll cover scalability in terms of – you guessed it – AI inferencing workloads.
Our deep learning and AI inferencing benchmarks revealed the PowerEdge T560 to perform up to 15.8x better than the T440 and up to 3.8x better than the T550. Even with over triple the performance, the T560 had nearly 74% lower latency compared to the T550 for the same workload. The rest of this blog highlights why the 2-socket T560 is well-suited for AI inferencing on CPU and provides greater detail behind the benchmarks – TensorFlow and OpenVINO – we tested in our lab.
In case you missed it in our last post, we covered exceptional database workload performance gains across the PowerEdge T440, T550, and T560. Make sure to give that a read to learn how these towers represent six years of innovation since the launch of 14th Generation PowerEdge servers.
PowerEdge towers and AI – a perfect pair
Databases, businesses applications, and virtualization are use cases commonly associated with tower servers. While the PowerEdge tower portfolio is designed to accelerate these more traditional workloads, it simultaneously matches the exploding business demand for AI solutions. In fact, IDC projects $154 billion in global AI spending this year, with retail and banking topping the industries with the greatest AI investment.
It is important to note that not all AI workloads look the same; they vary widely in scope and necessary compute power. Use cases range from predicting cancerous regions on CT scans to identifying the most trafficked aisles in a retail store. Irrespective of the specific application, McKinsey reveals organizations that adopted AI for specific functions in 2022 are already seeing a return on investment in 2023. Specifically, across all functions, an average of 59% of organizations report revenue increases from AI adoption and 42% report cost decreases.
Whether a business has a clearly defined need for AI compute power or anticipates having one in the future, the PowerEdge T560 scales with evolving industry demands. The key product features that drive the PowerEdge T560’s “AI-readiness” include:
- 2x Intel® Xeon® Scalable Processors
- Up to six single-width or two double-width GPUs
- PCle Gen 5 and DDR5 memory
Figure 1. PowerEdge T560 AI accelerators
Testing details and benchmark information
For our testing, we evaluated two AI inferencing performance benchmarks, TensorFlow and Intel’s OpenVINO, on the PowerEdge T440, T550, and T560 using Phoronix Test Suites. Inferencing, a subset of AI workloads, refers to the use of input data and an associated trained model to make real-time predictions. Common applications include detecting faces and monitoring traffic for incoming vehicles and pedestrians.
Both TensorFlow and OpenVINO are image-based, and we ran both on CPU. All systems tested were equipped with Intel® Xeon® processors, which is especially relevant to inferencing given that Intel reports “up to 70% of CPUs installed for inferencing are Intel Xeon processors.” While the T560’s GPU capacity allows businesses to scale up their AI workloads, our results show that inferencing on CPU alone still lends itself to impressive performance.
The full testing configurations are listed in the following table. Each system has a Gold-class Intel® Xeon® processor, equal memory capacity, and storage to reflect industry transitions. All testing was conducted in a Dell Technologies lab.
Note: We set the System Profile in BIOS setting to “Performance” on all systems, which has shown to boost out-of-the-box performance by up to 10%. Check out this paper for more details and other ways to simply and quickly optimize your AI workload performance.
Table 1. Testing configurations
| PowerEdge T440 | PowerEdge T550 | PowerEdge T560 |
CPU | Intel® Xeon® Gold 5222 4c/8T, TDP 105W | Intel® Xeon® Gold 6338N 32c/64T, TDP 185W | Intel® Xeon® Gold 6448Y 32c/64T, TDP 225W |
Storage | 4x 800 GB SAS SSD (RAID 5) | 4x 960 GB SAS SSD | 4x 1.6TB NVMe |
Memory | 512 GB DDR4
| 512 GB DDR4 | 512 GB DDR5 |
PowerEdge T560 inferencing performance “clean sweep”
We report TensorFlow inferencing performance results for three common deep learning architectures: AlexNet, VGG-16, and RestNet-50. Performance – or in this case throughput – is measured by the number of images processed every second. The higher the images per second value, the better the inferencing performance.
As shown in Figure 1, the PowerEdge T560 processed significantly more images per second compared to both prior-gen towers and across all three architectures. Most notably, the T560 demonstrated up to 318% higher throughput than the T440.
Figure 2. TensorFlow benchmark performance
Table 2 provides more details about the performance improvements across all systems and architectures tested.
Table 2. TensorFlow benchmark results
| T440 to T550 | T550 to T560 | T440 to T560 |
CPU-Batch Size[1]-Architecture | Percent Uplift in Throughput | ||
CPU -512- ResNet-50 | 171.32% | 22.11% | 231.32% |
CPU -512- VGG-16 | 234.12% | 25.13% | 318.08% |
CPU – 16 - AlexNet | 175.21% | 20.54% | 231.74% |
In a similar vein, we report OpenVINO performance results for four computer vision use cases:
- Person Detection
- Face Detection
- Age & Gender Recognition in Retail
- Person, Vehicle & Bike Detection
Performance is measured by both throughput in number of frames processed per second (FPS) and latency in milliseconds (ms). The higher the FPS value, the better the inferencing performance. Conversely, a lower latency indicates a quicker system response and therefore better performance.
The figures below illustrate changes in FPS for the four use cases across all three generations of tower servers. For Face Detection specifically, the T560 has 15.8x the FPS compared to the T440 and almost 4x the FPS compared to the T550.
Figure 3. Face Detection and Person Detection OpenVINO FPS
Figure 4. Age Gender Recognition Retail OpenVINO FPS
Figure 5. Person Vehicle Bike Detection OpenVINO FPS
The following table provides the FPS values for the use cases and all three systems tested.
Table 3. OpenVINO frames per second results
| PowerEdge T440 | PowerEdge T550 | PowerEdge T560 |
Model | Throughput in Frames per Second, More is Better | ||
Face Detection FP16 | 3.54 | 14.77 | 55.94 |
Person Detection FP16 | 1.94 | 7.6 | 17.37 |
Person Vehicle Bike Detection FP16 | 249.62
| 701.76 | 2732.94 |
Age Gender Recognition Retail FP16 | 8396.74 | 34131.92 | 80733.72 |
Lastly, the T560 reduces inferencing latency by up to 73% compared to the T550 on these same models, as illustrated in Figure 6.
Figure 6. Percent decrease in latency
The following table presents the latency values in ms for the T550 and T560.
Table 4. OpenVINO latency results
| PowerEdge T550 | PowerEdge T560 | Latency Reduction from T550 to T560 |
Model | Latency in ms, Less is Better | Reduction | |
Face Detection | 2164.53 | 570.48 | -73.64% |
Person Detection | 4130.79 | 1833.29 | -55.62% |
Person Vehicle Bike Detection | 45.56 | 23.4 | -48.64% |
Age Gender Recognition Retail | 1.73 | 0.72 | -58.38% |
Concluding Thoughts
Emerging AI workloads have taken numerous industries by storm, and the latest-gen PowerEdge T560 is built for businesses looking to scale up and reap the benefits of AI-generated insights. Between support for 4th Gen Intel® Xeon® Scalable Processors, up to 6 graphics cards, and DDR5 memory, this tower can handle both CPU- and GPU-heavy use cases.
Our recent AI inferencing testing on CPU revealed the PowerEdge T560 has:
Up to 318% percent better inferencing performance than the T440 for the TensorFlow benchmark
Up to 15.8x the inferencing performance compared to the T440 and almost 4x the performance compared to the T550 for the OpenVINO benchmark
Up to 73% lower latency compared to the T550 for the OpenVINO benchmark
While this concludes our blog series on “Six Years of Tower Servers,” we hope we have left you wanting to learn more about the PowerEdge T560. Don’t forget to check out our previous blog detailing exceptional database workload performance gains across tower servers. We’ll part ways with this short unboxing video for a look under the lid of the server:
Resources
- Six Years of Tower Servers: Exceptional Database Performance with PowerEdge T560 | Dell Technologies Info Hub
- Worldwide Spending on AI-Centric Systems Forecast to Reach $154 Billion in 2023, According to IDC
- The state of AI in 2023: Generative AI’s breakout year | McKinsey
- Tensorflow Benchmark - OpenBenchmarking.org
- OpenVINO Benchmark - OpenBenchmarking.org
- Optimize Inference with Intel® CPU Technology
[1] This is a manually set parameter, ranging from 16 to 512. Read about the parameter meaning here.
Legal Disclosures
Based on September 2023 Dell labs testing subjecting the PowerEdge T440, T550, and T560 tower servers to AI inference benchmarks – OpenVINO and TensorFlow via the Phoronix Test Suite. Actual results will vary.
Authors: Olivia Mauger, Jeremy Johnson, Delmar Hernandez | Compute Tech Marketing
Talking CloudIQ: PowerEdge
Wed, 08 Nov 2023 16:32:28 -0000
|Read Time: 0 minutes
Introduction
In my previous blogs, I have focused on a specific feature in CloudIQ. This blog talks about various CloudIQ features for Dell’s PowerEdge servers. Dell CloudIQ continues to expand its feature set for PowerEdge assets. CloudIQ integrates with Dell’s OpenManage Enterprise at each of your sites, to efficiently collect and aggregate telemetry data to give you a multisite, enterprise-wide view of all your PowerEdge servers and chassis. And with OpenManage Enterprise 4.0, onboarding your PowerEdge servers to CloudIQ is easier than ever!
Health, inventory, and performance
Since the introduction of PowerEdge support in CloudIQ, health, inventory, and performance monitoring for PowerEdge servers have all been available. CloudIQ provides an overall health score for each PowerEdge server and recommended remediation when an issue is identified. Inventory reporting provides numerous properties about each server, including contract status, component firmware versions, licensing information, and hardware listings to name a few. CloudIQ displays key performance metrics and not only shows historical trends but identifies performance anomalies and provides performance forecasting. This information allows you to see unexpected performance patterns, and plan future resource needs based on trending workloads.
Figure 1. Example of a performance forecasting chart for PowerEdge
Cybersecurity
Cybersecurity is a feature in CloudIQ that allows you to compare your existing security configuration settings to a predefined set of desired security configuration settings. The configuration is continuously monitored, notifying you when a configuration does not meet its desired setting. Cybersecurity monitors up to 31 server configuration settings and 18 chassis configuration settings tied to NIST security standards. Without automated continuous checking, it's impractical to manually check all settings on all servers every day. Lab tests show that it takes six minutes on average to manually check just 15 settings on a single server.
Users can also see a list of applicable Dell Security Advisories (DSAs) for their PowerEdge systems. By intelligently matching attributes like models and code versions, users can quickly see which DSAs are applicable to their systems, allowing them to take immediate action to remediate these security vulnerabilities.
Figure 2. The Security Assessment page for a PowerEdge chassis
System Management
You can now initiate BIOS and firmware updates for PowerEdge servers and chassis from CloudIQ. Users with a Server Admin role in CloudIQ can initiate these upgrades across multiple systems with just a few clicks. This feature simplifies the process of keeping your fleet of servers consistent and secure.
Figure 3. Multisystem update for PowerEdge servers and chassis
Virtualization View
The integration of PowerEdge into the Virtualization View consolidates and simplifies resource information about PowerEdge servers running ESXi. Available details include the OS version, model, resource consumption per virtual machine, and health issues with recommendations for remediation. A hyperlink lets you quickly navigate to the system details page for the PowerEdge server for more troubleshooting. Another hyperlink directs you to vCenter to perform virtualized resource administration.
Figure 4. PowerEdge support in the Virtualization View
Carbon footprint monitoring
CloudIQ has introduced carbon footprint analysis support for PowerEdge servers and chassis. CloudIQ takes power and energy metrics and calculates carbon emissions based on international standards and conversion factors for location. CloudIQ Administrators can override and customize these values with their own unique location emission factors.
Figure 5. Energy, power, and carbon emissions for a PowerEdge server
Custom reports and IT integrations
You can generate custom reports using both tables and charts for PowerEdge servers:
- Tables are available to provide lists of assets, code versions, contract information, capacity metrics, and average performance metrics.
- Charts can be used to see historical performance trends and performance anomalies.
You can also take advantage of custom tags in your reports. For example, you can create a list of PowerEdge servers in a certain business unit with their BIOS and firmware versions, contract expiration dates, average power consumption, and service tags. And with Webhooks and REST API access, you can integrate data and events from CloudIQ with ServiceNow, Slack, and other IT tools to help you monitor your entire Dell IT infrastructure.
Figure 6. Custom reporting table for PowerEdge with custom tags
Conclusion
As IT resources become more remote and isolated, it has become increasingly time consuming to maintain, manage, and secure resources in the data center and at the edge. CloudIQ simplifies monitoring and management by providing a single portal to view all your PowerEdge servers across your entire environment. With cybersecurity monitoring of PowerEdge servers and chassis, you can quickly see where security configuration settings may be incorrectly set or accidentally changed, opening those systems to cyberattacks, and receive instructions to remediate. With the new maintenance and management features, CloudIQ simplifies the process of keeping your entire fleet at consistent, secure, and desired BIOS and firmware versions. The carbon footprint page in CloudIQ helps you meet sustainability goals. And with Webhook and REST API support, CloudIQ can be integrated with other IT tools to help you monitor not only your PowerEdge servers, but your entire Dell IT portfolio.
Resources
This Knowledge Base Article discusses how to onboard PowerEdge devices to CloudIQ.
For a quick demo about CloudIQ PowerEdge support, see the CloudIQ videos section on the Info Hub.
Direct from Development Tech Note: Dell CloudIQ Cybersecurity for PowerEdge: The Benefits of Automation
See other informative blogs: Overview of CloudIQ, Proactive Health Scores, Capacity Monitoring and Planning, Cybersecurity, and Custom Reports and Tags.
How do you become more familiar with Dell Technologies and CloudIQ? The Dell Technologies Info Hub site provides expertise that helps to ensure customer success with Dell Technologies platforms. We have CloudIQ demos, white papers, and videos available at the Dell Technologies CloudIQ page. Also, feel free to reference the white paper CloudIQ: A Detailed Overview which provides an in-depth summary of CloudIQ.
Author: Derek Barboza, Senior Principal Engineering Technologist