


TPCx-HS Results on Dell EMC Hardware with AMD Milan Processors
Mon, 19 Apr 2021 17:56:26 -0000
|Read Time: 0 minutes
Introduction
As part of the Dell Technologies AMD Milan launch in March 2021, Dell Technologies published eight results with the Transaction Processing Performance Council (TPC) (www.tpc.org). Six of those results are categorized as Big Data; five as TPCx-HS and one as TPCx-Big Bench. Milan is a code name for AMD EPYC third-generation processors which represent a broad line-up for cloud, enterprise, and high-performance computing workloads. TPC Big Data results are categorized by data sizes that are known as Scale Factor (SF). The results showcase Big Data performance at the low-end SF 1 TB, while at the high end TPCx-HS crosses the “size frontier” with a 100 TB result.
Big Data technologies like Hadoop and Spark have become an important part of the enterprise IT ecosystem. The TPC Express Benchmark™ HS (TPCx-HS) was developed to provide an objective measure of hardware, operating system, and commercial Apache Hadoop File System API compatible software distributions. Also, it provides the industry with verifiable performance, price-performance, and availability metrics. The benchmark models a continuous system availability of 24 hours a day, 7 days a week.
This blog dives deeply into the results, what they mean, and why they are important for Big Data enthusiasts and professionals in Engineering, Marketing, and Sales.
System under test (SUT)
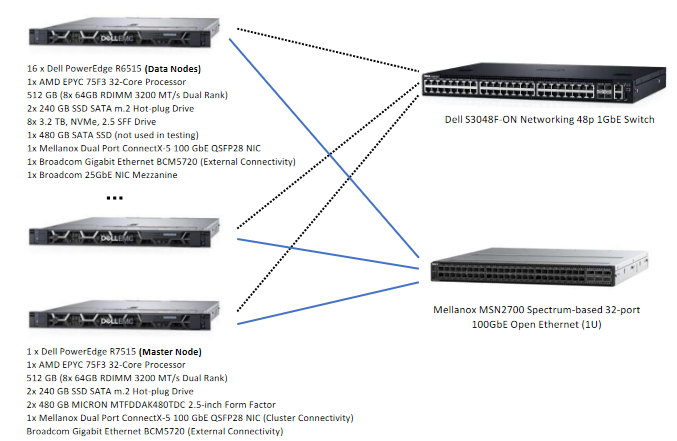
Figure 1: SUT for the SF100 TB result
All the 5 TPCx-HS results used 1 x PowerEdge 7515 for the Master node and either 9 or 16 PowerEdge R6515 nodes for the Worker nodes. The only major hardware configuration difference apart from the number of Worker nodes was the storage size. The SF 100 TB result was run on a SUT with each Worker node having 8 x 3.2 TB NVMe. All other results used 5 x 3.2 TB NVMe.
Hardware Configuration | |||||
Data Size | SF 100 TB | SF 3 TB | SF 1 TB | ||
# nodes | 17 | 17 | 17 | 10 | 10 |
Processor/Cores/Threads (P/C/T) | 17/544/1,088 | 17/544/1,088 | 17/544/1,088 | 10/320/640 | 10/320/640 |
Framework | MapReduce | Spark | |||
Processor | 1 x AMD EPYC 75F3 32-core, 2.95 GHz, 256 MB-L3 | ||||
Memory | 512GB (8x64GB RDIM 3200 MT/s Dual Rank) | ||||
Network (Cluster Connectivity) | 1x Mellanox Dual Port ConnectX-5 100GbE QSFP28 NIC | ||||
Network (Remote Connectivity) | 1 x Broadcom Gigabit Ethernet BCM5720 NIC | ||||
Data Storage (Number of 3.2 TB NVMe) | 8 | 5 | |||
Software Stack | |||||
Operating System | SUSE Linux Enterprise Server 12 SP5 | ||||
Hadoop | Cloudera Private Cloud Base 7.1.4 | ||||
Java | Open JDK 64-Bit Server build 1.8.0_232-cloudera | ||||
Table 1: SUT configuration
Benchmark workload
TPCx-HS was the first Big Data industry-standard benchmark that was designed to stress both hardware and software that is based on Apache HDFS API compatible distributions. TPCx-HS extends the workload that is defined in TeraSuite (TeraGen, TeraSort, TeraValidate) with formal rules for implementation, execution, metric, result verification, publication, and pricing. It can be used to assess a broad range of Big Data Hadoop system topologies, implementation methodologies and systems in a technically rigorous, directly comparable, and vendor-neutral manner. The current TPCx-HS specification can be found on the TPC Documentation Webpage.
The TPC requires that Express benchmarks like TPCx-HS must run the TPC-provided kit in order to publish a compliant TPC Express result. The latest TPCx-HS kit can be downloaded from www.tpc.org/tpcx-hs. The benchmark workload consists of the following modules:
- HSGen generates data at a particular Scale Factor. It is based on TeraGen.
- HSDataCheck checks the validity of the dataset and replication.
- HSSort sorts and orders the data. It is based on TeraSort.
- HSValidate validates the sorted output. It is based on TeraValidate.
The benchmark test is performed in five phases that are run from a TPCx-HS-master script. The phases must run sequentially without any overlaps.
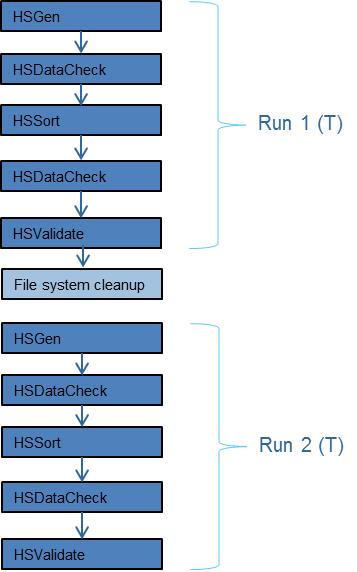
Figure 2: TPCx-HS execution phases
The benchmark test consists of two runs, Run 1 and Run 2, which must follow the run phases shown above. Except for file system cleanup, no activities are allowed between Run 1 and Run 2. The total elapsed runtime T, in seconds is used for the TPCx-HS Performance Metric calculation. The performance run is defined as the run (Run 1 or Run 2) with the lower TPCx-HS Performance Metric. The repeatability run is defined as the run (Run 1 or Run 2) with the higher TPCx-HS Performance Metric. The reported Performance Metric is the TPCx-HS Performance Metric for the performance run.
Scale factors
Scale Factor (SF) is the dataset size in relation to the minimum required size of a test dataset. For TPCx-HS, the test dataset size must be selected from a set of fixed SFs:
1 TB | 3 TB | 10 TB | 30 TB | 100 TB | 300 TB | 1000 TB | 3000 TB | 10,000 TB |
The SF 100 TB result was the first TPCx-HS result to be published at that SF, which was a major milestone for the Industry.
What is measured?
All TPC published results disclose a Primary Metric that consists of a Performance metric, Price/Performance metric, and an availability date. For TPCx-HS:
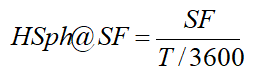
- Performance Metric (HSph@SF) reflects the throughput of a run (Run 1 or Run 2) at Scale Factor SF. This metric is the elapsed time T for a performance run to perform all the five phases shown in Figure 2.
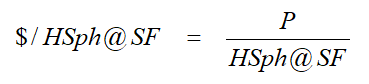
- Price/Performance Metric ($/HSph@SF) indicates the Total Cost of Ownership P needed to own and sustain the SUT that scored the Performance Metric.
- System availability date is the day all components used in the Performance test will be available to customers as defined in the TPC Pricing specification.
What the metric numbers mean
Generally, the faster the performance run is completed, the higher the performance score. The score is obtained by normalizing the run times as per the formulas shown above. For Price/Performance, the lower the metric score the better. In this case, a higher Performance score achieved on a SUT with a lower Total Cost of Ownership P will show a better price/performance metric.
Results
As part of the Dell Technologies AMD Milan launch, Dell Technologies published five TPCx-HS results on March 04, 2021. These results summarized in Table 2 below show several performance scenarios:
- Data sizes that are scaled from SF 1 TB to SF 100 TB
- Two different frameworks MapReduce and Spark
- Two different cluster sizes 10 nodes and 17 nodes
The common denominator for these results is that all SUTs used the AMD Milan EPYC 75F3 processors.
Data Size | SF 100 TB | SF 3 TB | SF 1 TB | ||
Number of nodes | 17 | 17 | 17 | 10 | 10 |
Framework | MapReduce | Spark | |||
HSGen (s) | 1,604.68 | 62.32 | 33.03 | 47.14 | 41.22 |
HSSort (s) | 5,819.10 | 205.21 | 87.76 | 140.68 | 119.28 |
HSValidate (s) | 791.54 | 36.25 | 22.09 | 26.01 | 15.99 |
Elapsed Run time (s) | 8,225 | 313 | 146 | 218 | 181 |
Data Size | SF 100 TB | SF 3 TB | SF 1 TB | ||
Performance Metric (HSph) | 43.76 | 34.52 | 24.69 | 16.52 | 19.92 |
Total Cost of Ownership (TCO) | $1,344,855 | $1,229,447 | $1,229,447 | $728,080 | $728,080 |
Price/Performance ($/HSph) | $30,733 | $35,616 | $49,795 | $44,073 | $36,550 |
Total Rack Units (TRU) | 20U | 20U | 20U | 13U | 13U |
Performance/TRU | 2.19 | 1.73 | 1.23 | 1.27 | 1.53 |
Table 2: TPCx-HS results published on March 04, 2021
The table also shows that data sizes were scaled from 1 TB to 100 TB using SUTs occupying the same space as measured in Total Rack Units (TRU). Detailed results can be found at http://tpc.org/tpcx-hs/results/tpcxhs_perf_results5.asp?version=2.
Figure 3 below is a scatter chart that shows the relative performance, relative price/performance, and performance/TRU of all the TPCx-HS SF 1 TB results on March 04, 2021. These results are based on three AMD processor generations. The results in red markers are based on the first-generation AMD Naples processor. Orange markers show results that are based on the second-generation processor AMD Rome. Blue markers show results that are based on the most recent third-generation AMD Milan processors. Green markers show results that were from a competitor, CompA.
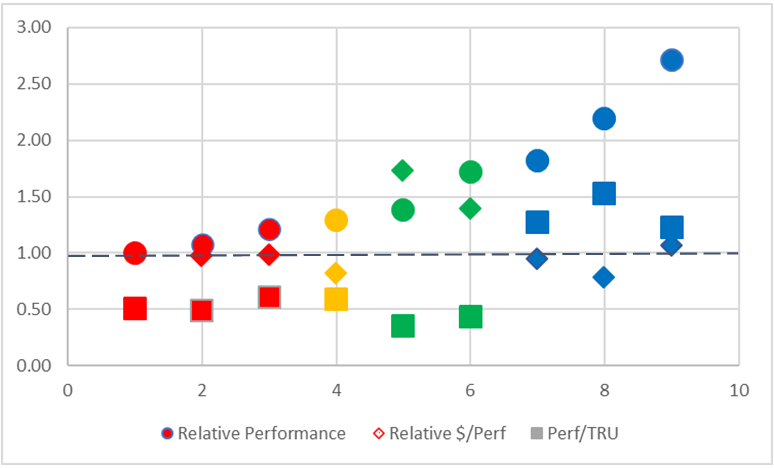
Figure 3: TPCx-HS SF 1 TB results by processor
The relative performance and price/performance scores use the results of the AMD Naples-based SUT as a reference. All performance results (circle marker) above the dashed line performed better than the reference SUT and those results below performed worse. Conversely, price/performance results (diamond marker) above the dashed line scored worse than those results below the line.
Figure 4 is a similar chart but shows results at SF 3 TB.
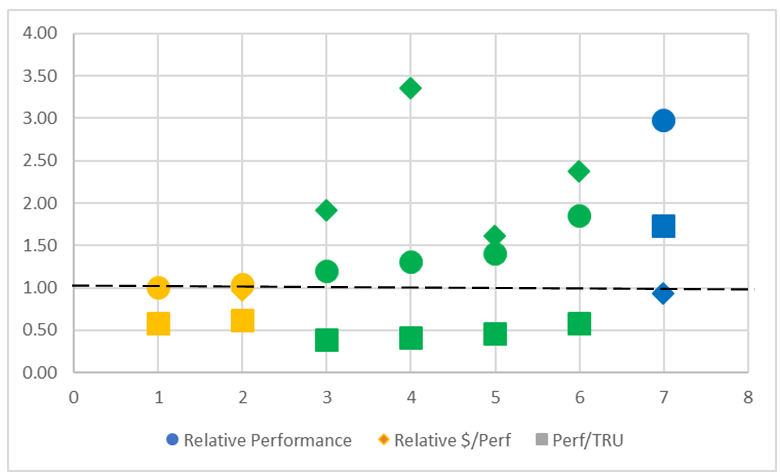
Figure 4: TPCx-HS SF 3 TB results by processor
Figure 5 is a bar chart that shows relative performance using the results of the R6415-Naples-17node-MR SUT as the reference. The bars show results that are based on AMD processors: red for AMD Naples; orange for AMD Rome; and blue for AMD Milan. The green bars are for results from competitor CompA.
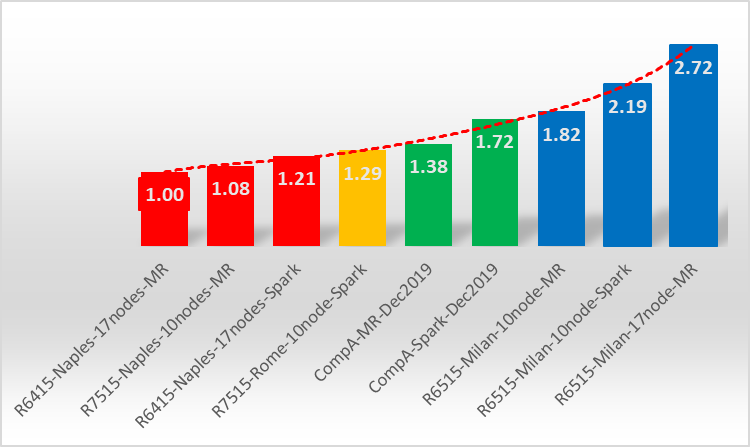
Figure 5: TPCx-HS SF 1 TB relative performance results
Figure 6 is a chart that shows performance per TRU and color-coded similarly to Figure 5.
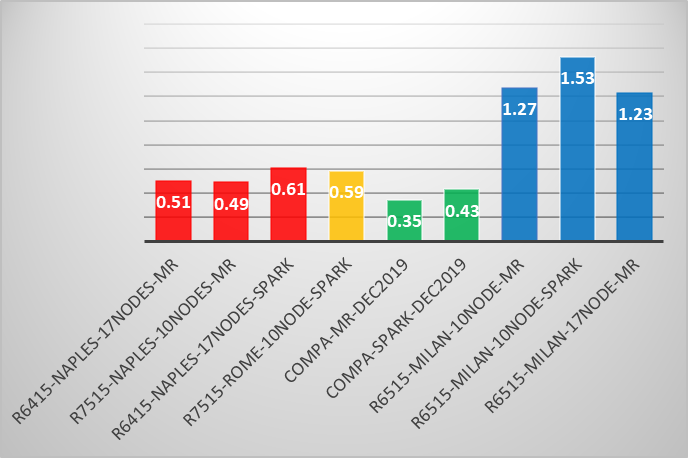
Figure 6: Performance/TRU
Key takeaways from the results
- AMD Milan-based SUTs give the best bang for the money based on TPCx-HS results. Figure 5 shows that they performed up to 2.72x better than SUTs based on earlier generation AMD processors and the competition. Figures 3 and 4 show that the price/performance is comparable to that of the reference SUT.
- Data sizes can be scaled without fear of reduction in price/performance. Table 2 shows that price/performance based on Total Cost of Ownership improves remarkably as the data sizes are scaled from SF 1 TB to SF 100 TB.
- It is worth investing in NVMe-based storage. As shown in Table 2, all the results used NVMe-based storage. This configuration enabled them to use the 1U R6515 servers which occupied less rack space without a reduction in computing resources.
- AMD Milan-based SUTs enable reduced data center footprint. Table 2 and Figure 6 show that within the same space, the workload size can be increased by a factor of 100 without loss of efficiency.
- AMD Milan-based SUTs show improved performance efficiency at scale. At SF 100 TB, more data is being processed in a proportionately less time.
Conclusion
With the publication of TPCx-HS results based on AMD Milan processors, Dell Technologies has become the most dominant publisher of TPC Big Data benchmarks. The results show that Dell EMC hardware platforms with third-generation AMD EPYC processors can do more work efficiently in less space, and with more value for the dollar.