


SQL Server deployments–Have you tried this?
Tue, 27 Sep 2022 19:11:24 -0000
|Read Time: 0 minutes
SQL Server databases are critical components of most business operations and initiatives. As these systems become more intelligent and complex, maintaining optimal SQL Server database performance and uptime can pose significant challenges to IT—and often have severe implications for the business.
What is SQL Server best practice?
Best practices for SQL Server database solution provide a comprehensive set of recommendations for both the physical infrastructure and the software stack. This set of recommendations is derived from many testing hours and expertise from the Dell Server team, Dell Storage team, and the Dell Solutions and Engineering SQL Server specialists.
Why use SQL Server best practice?
Business-critical applications require an optimized infrastructure to run smoothly and efficiently. An optimized infrastructure allows applications to run smoothly and prevents performance risks, such as system sluggishness that could affect system resources and application response time. Such unexpected outcomes can often result in revenue loss, customer dissatisfaction, and damage to brand reputation.
The mission around best practices
Dell’s mission is to ensure that its customers have a robust and high-performance database infrastructure solution by providing best practices for SQL Server 2019 running on PowerEdge R750xs servers and PowerStore T model storage including the new PowerStore 3.0. These best practices aim to offer time savings for our customers by reducing the complex work required to optimize their databases. To enhance the value of best practices, we identify which configuration changes produce the greatest results and categorize them as follows:
Day 1 through Day 3: Most enterprises implement changes based on the delivery cycle:
- Day 1: Indicates configuration changes that are part of provisioning a database. The business has defined these best practices as an essential part of delivering a database.
- Day 2: Indicates configuration changes that are applied after the database has been delivered to the customer. These best practices address optimization steps to further improve system performance.
- Day 3: Indicates configuration changes that provide small incremental improvements in the database performance.
Highly, moderately, and fine-tuning recommendations: Customers want to understand the impact of the best practices and these terms are used to indicate the value of each best practice.
- Highly recommended: Indicates best practices that provided the greatest performance in our tests.
- Moderately recommended: Indicates best practices that provide modest performance improvements, but which are not as substantial as the highly recommended best practices.
- Fine-tuning: Indicates best practices that provide small incremental improvements in database performance.
Best practices test methodology for Intel-based PowerEdge and PowerStore deployments
Within each layer of the infrastructure, the team sequentially tested each component and documented the results. For example, within the storage layer, the goal was to show how optimizing the number of volumes for SQL User DB Data area volumes improve performance of a SQL Server database.
The expectation was that performance would sequentially improve. Using this methodology, an overall optimal SQL Server database solution would be achieved during the last test.
The physical architecture consists of:
- 2 x PowerEdge R750xs servers
- 1 x PowerStore T model array
Table 1 and Table 2 show the server configuration and the PowerStore T model configuration.
Table 1. Server configuration
Processors | 2 x Intel® Xeon® Gold 6338 32 core CPU @2.00GHz |
Memory | 16 x 64 GB 3200MT/s memory, total of 1 TB |
Network Adapters | Embedded NIC: 1 x Broadcom BCM5720 1 GbE DP Ethernet Integrated NIC1: 1 x Broadcom Adv. Dual port 25 Gb Ethernet NIC slot 5: 1 x Mellanox ConnectX-5-EN 25 GbE Dual port |
HBA | 2 x Emulex LP35002 32 Gb Dual Port Fibre Channel |
Table 2. PowerStore 5000T configuration details
Processors | 2 x Intel® Xeon® Gold 6130 CPU @ 2.10 GHz per Node
|
Cache size | 4 x 8.5 GB NVMe NVRAM |
Drives | 21 x 1.92 TB NVMe SSD |
Total usable capacity | 28.3 TB |
Front-end I/O modules | 2 x Four-Port 32 Gb FC |
The software layer consists of:
- VMware ESXi 7.0.3
- Red Hat Enterprise Linux 8.5
- SQL Server 2019 CU 16-15.0.4223.1
There are several combinations possible for the software architecture. For this testing, SQL Server 2019, Red Hat Enterprise Linux 8.5, and VMware vSphere 7.0.3 were selected to have a design that applies to many database customers use today.
Benchmark tool
HammerDB is a leading benchmarking tool that is used with databases like Oracle, MySQL, Microsoft SQL Server, and others. Dell’s engineering team used HammerDB to generate an Online Transaction Processing (OLTP) workload to simulate enterprise applications. To compare the benchmark results between the baseline configuration and the best practice configuration, there must be a significant load on the SQL Server Database infrastructure to ensure that the system was sufficiently taxed. This method of testing guarantees that the infrastructure resources are optimized after applying best practices. Table 3 shows the HammerDB workload configuration.
Table 3. HammerDB workload configuration
Setting name | Value |
Total transactions per user | 1,000,000 |
Number of warehouses | 5,000 |
Number of virtual users | 80 |
Minutes of ramp up time | 10 |
Minutes of test duration | 50 |
Use all warehouses | Yes |
User delay (ms) | 500 |
Repeat delay (ms) | 500 |
Iterations | 1 |
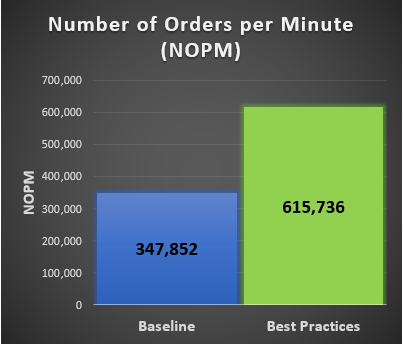
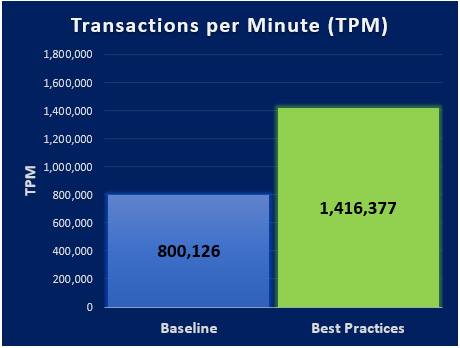
New Order per Minute (NOPM) and Transaction per Minute (TPM) provide metrics to interpret the HammerDB results. These metrics are from the TPC-C benchmark and indicate the result of a test. During our best practice validation, we compared those metrics against the baseline configuration to ensure that there was an increase in performance.
Findings
After performing various test cases between the baseline configuration and the best practice configuration, our results showed an improvement over the baseline configuration. The following graphs are derived from the database virtual machines configuration in the following table.
Note: Every database workload and system is different, which means actual results of these best practices may vary from system to system.
Table 4. vCPU and memory allocation
Resource Reservation | Baseline configuration per virtual machine | Number of SQL Server database virtual machines | Total |
vCPU | 10 cores | 6 | 60 cores |
Memory | 112 GB | 6 | 672 GB |