


Introduction to MLPerf™ Inference v1.1 with Dell EMC Servers
Fri, 24 Sep 2021 16:48:39 -0000
|Read Time: 0 minutes
Dell Technologies has participated in MLPerf submission for the past two years. The current submission is our fourth round to the MLPerf inference benchmarking suite.
This blog provides the latest MLPerf Inference v1.1 data center closed results on Dell EMC servers from our HPC & AI Innovation lab. The objective of this blog is to show optimal inference performance and performance/watt for the Dell EMC GPU servers (PowerEdge R750xa, DSS8440, and PowerEdge R7525). A blog about MLPerf Inference v1.0 performance can be found here. This blog also addresses the benchmarks rules, constraints, and submission categories. We recommend that you read it to become familiar with the MLPerf terminologies and rules.
Noteworthy results
Our noteworthy results include:
- The DSS8440 server (10 x A100-PCIE-80GB, TensorRT) yields Number One results across all the submitters for:
- BERT 99 Offline and Server
- BERT 99.9 Offline and Server
- RNN-T Offline and Server
- SSD-Resnet34 Offline and Server
- The R750xa server (4 x A100-PCIE-80GB, TensorRT) yields Number One results per PCIe accelerator for:
- 3D UNet Offline and 3D UNet 99.9 Offline
- Resnet50 Offline and Resnet50 Server
- BERT 99 Offline and BERT 99 Server
- BERT 99.9 Offline and BERT 99.9 Server
- DLRM 99 Offline and DLRM Server
- DLRM 99.9 Offline and DLRM 99.9 Server
- RNN-T Offline and RNN-T Server
- SSD-Resnet34 Offline and SSD-Resnet34 Server
- The R750xa server (4 x A100-PCIE-80GB, MIG) yields Number One results per PCIe accelerator MIG results for:
- Resnet50 Offline and Resnet50 Server
- BERT 99 Offline and BERT 99 Server
- BERT 99.9 Offline and BERT 99.9 Server
- SSD-Resnet34 Offline and SSD-Reset34 Server
- The R750xa server (4 x A100-PCIE-80GB, Triton) yields Number One results per PCIe accelerator Triton results for:
- 3D UNet Offline and 3D UNet 99.9 Offline
- Resnet50 Offline and Resnet50 Server
- BERT 99 Server
- BERT 99.9 Offline and BERT 99.9 Server
- DLRM 99 Offline and DLRM Server
- DLRM 99.9 Offline and DLRM 99.9 Server
To allow the like-to-like comparison of Dell Technologies results, we chose to test under the Datacenter closed division, as shown in this blog. Customers and partners can rely on our results, all of which MLCommonsTM has officially certified. Officially certified results are peer reviewed, have undergone compliance tests, and conform to the constraints enforced by MLCommons. If wanted, customers and partners can also reproduce our results. The blog that explains how to run MLPerf Inference v1.1 can be found here.
What is new?
The difference between MLPerf inference v1.1 and MLPerf inference v1.0 is that the Multistream scenario is deprecated. All other benchmarks and rules remain the same as for MLPerf inference v1.0.
For v1.1 submissions to MLCommons, over 1700 results were submitted. The number of submitters increased from 17 to 21.
Dell Technologies result submissions included new SUT configurations such as NVIDIA A100 Tensor Core 80GB GPU with 300 W TDP, A30, A100-MIG, and power results with NVIDIA-Certified R750xa servers.
MLPerf Inference 1.1 benchmark results
The following graphs include performance metrics for the Offline and Server scenarios. Overall, Dell Technologies results included approximately 200 performance results and 80 performance and power results. These results serve as a reference point to enable sizing deep learning clusters. The higher number of results in our submission helps further fine tune answers to specific questions that customers might have.
For the Offline scenario, the performance metric is Offline samples per second. For the Server scenario, the performance metric is queries per second (QPS). In general, the metrics represent throughput. A higher throughput is a better result. In the following graphs, the Y axis is an exponentially scaled axis representing the throughput and the X axis represents the SUTs and their corresponding models (described in the appendix).
Figures 1, 2, and 3 show the performance of different Dell EMC servers that were benchmarked for the different models. All these servers performed optimally and rendered high throughput. The backends included NVIDIA Triton, NVIDIA TensorRT on Offline and Server scenarios. Some of the results shown in figures 1 and 3 include MIG numbers.
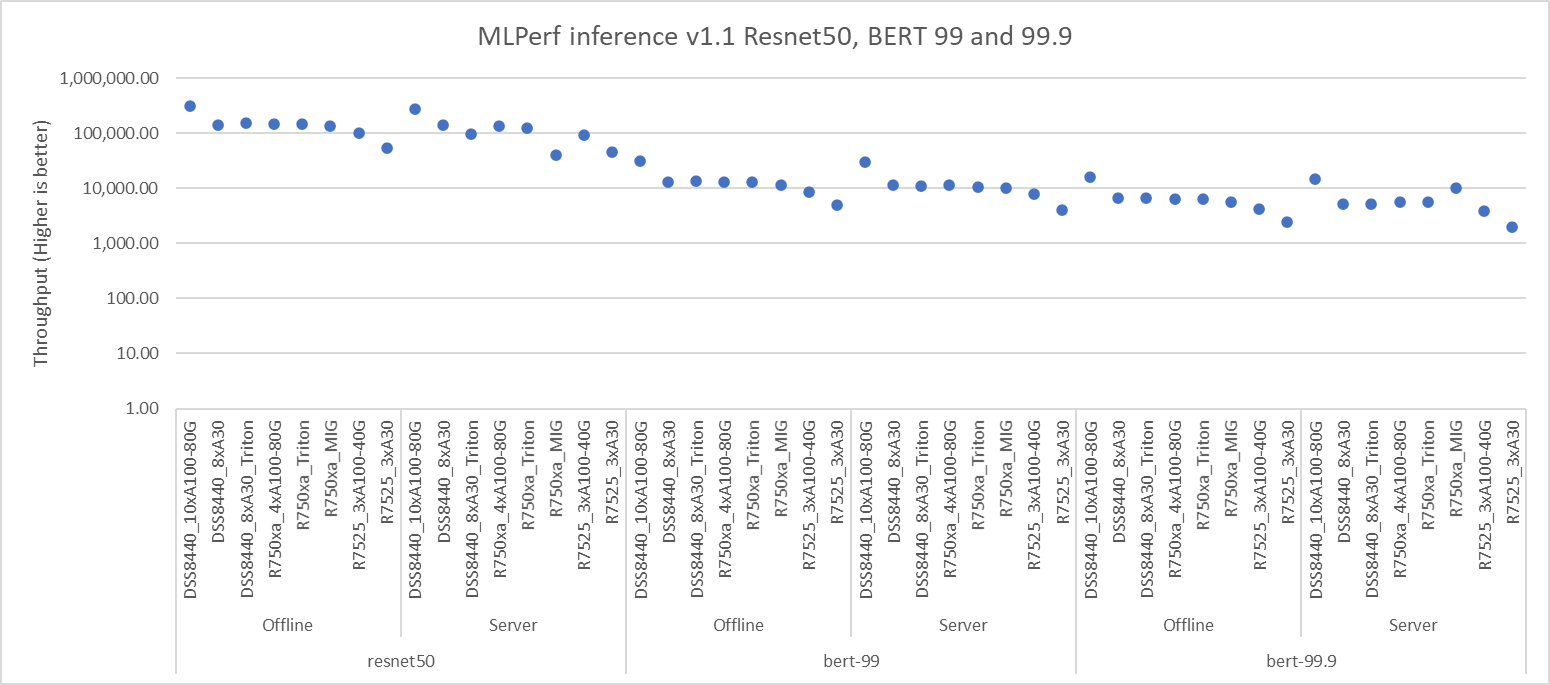
Figure 1: Resnet50, BERT default, and high accuracy results
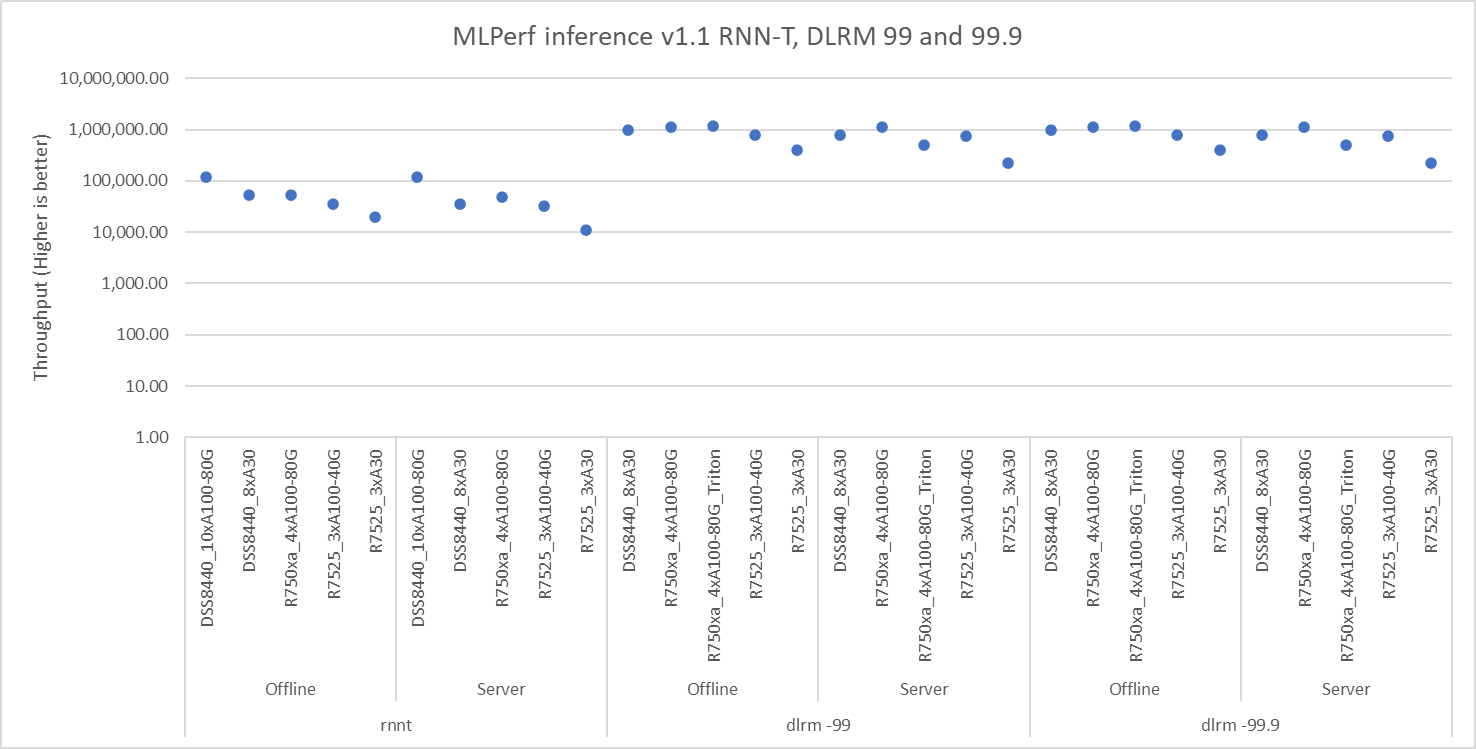
Figure 2: RNN-T, DLRM default, and high accuracy results
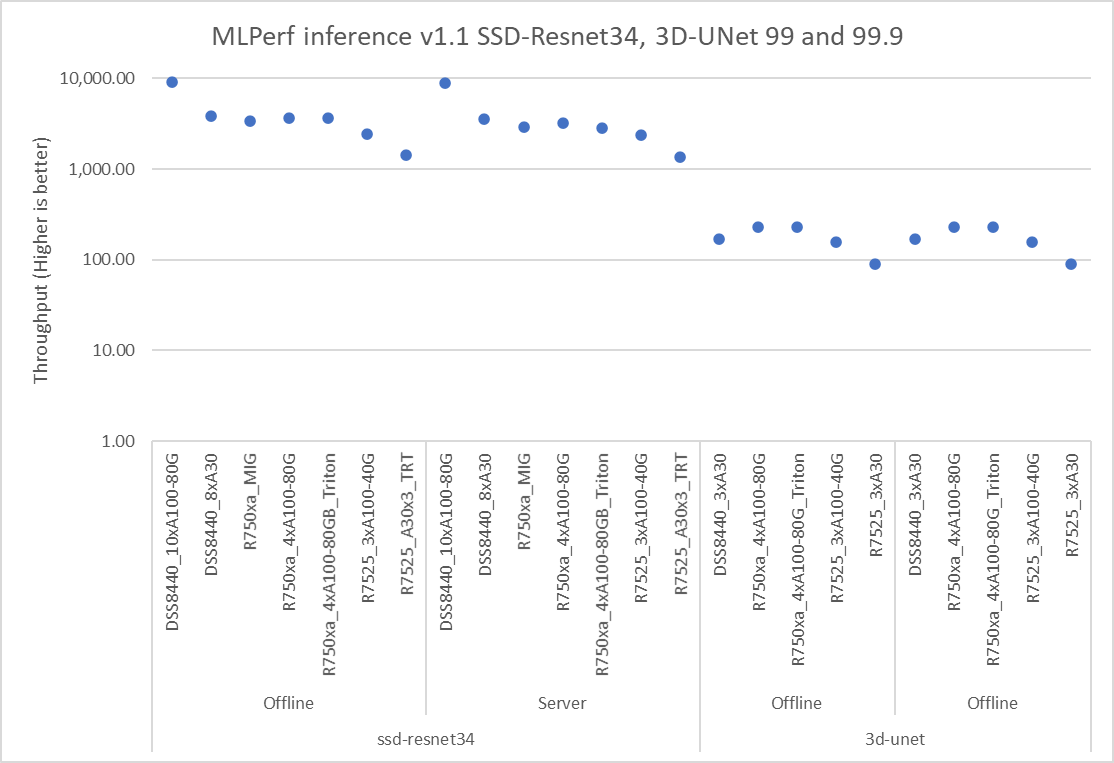
Figure 3: SSD-Resnet34, 3D-UNet default, and high accuracy results
Figure 4 shows the performance of the Dell EMC R750xa server that was benchmarked for the 3D-UNet, BERT 99, BERT 99.9, Resnet and SSD-Resnet34 models. The SUT provided high throughput while maintaining low power consumption. Higher throughputs were achieved with similar power usage for different models. These throughputs established our results in the optimal performance and optimal performance per watt category.
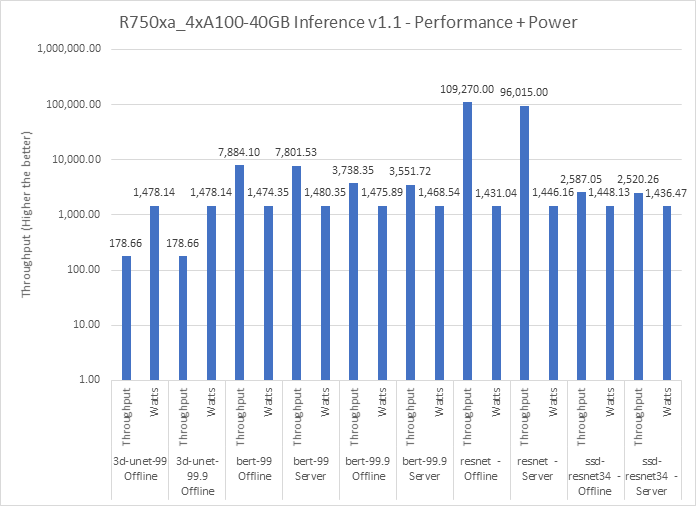
Figure 4: Performance and power submission with inference v1.1 with R750xa and 4 x NVIDIA A100–40G
Observations about results from Dell Technologies
All the preceding results are officially submitted to the MLCommonsTM consortium and verified. Submissions include performance and power-related numbers. Dell Technologies submissions include approximately 200 performance results and 80 performance and power results.
Different types of workload tasks such as image classification, object detection, medical image segmentation, speech to text, language processing, and recommendation were a part of these results, which were promising. These models met the quality-of-service targets as expected by the MLCommons consortium.
With different kinds of GPUs such as the NVIDIA A30 Tensor Core GPU, different NVIDIA A100 variants such as A100 40 GB PCIe and A100 80 GB PCIe, and different CPUs from AMD and Intel, Dell EMC servers performed with optimal performance and power results. Other Dell EMC SUT configuration results for the NVIDIA A40, RTX8000, and T4 GPUs can be found in the v1.0 results, which can be used for comparison with the v1.1 results.
The submission included results from different inference backends such as NVIDIA TensorRT, , and Multi-Instance GPU (MIG). The appendix includes a summary of the NVIDIA software stack.
All our systems are air-cooled. This feature allows data center administrators to perform minimal to no changes to accommodate these systems while delivering high throughput inference performance. Furthermore, Dell EMC servers offer high performance per watt more effectively without adding significant power constraints.
Conclusion
In this blog, we quantified the MLCommons inference v1.1 performance on different Dell EMC servers such as DSS8440 and PowerEdge R750xa and R7525 servers, producing many results. Customers can use these results to address the relative inference performance delivered by these servers. Dell EMC servers are powerful compute machines that deliver high throughput inference capabilities for customers inferencing requirements across different scenarios and workload types.
Next steps
In future blogs, we plan to describe:
- How to run MLPerf Inference v1.1
- The R750xa server as a platform for inference v1.1
- The DSS8440 server as a platform for inference v1.1
- Comparison of inference v1.0 performance with inference v1.1 performance
Appendix
NVIDIA software stack
NVIDIA Triton Inference Server is open-source software that aids the deployment of AI models at scale in production. It is an inferencing solution optimized for both CPUs and GPUs. Triton supports an HTTP/REST and GRPC protocol that allows remote clients to request inferencing for any model that the server manages. It adds support for multiple deep learning frameworks, enables high-performance inference, and is designed to consider IT, DevOps, and MLOps.
NVIDIA TensorRT is an SDK for high-performance, deep learning inference that includes an inference optimizer and runtime. It enables developers to import trained models from all major deep learning frameworks and optimizes them for deployment with the highest throughput and lowest latency, while preserving the accuracy of predictions. TensorRT-optimized applications perform up to 40 times faster on NVIDIA GPUs than CPU-only platforms during inference.
MIG can partition the A100 GPU into as many as seven instances, each fully isolated with their own high-bandwidth memory, cache, and compute cores. Administrators can support every workload, from the smallest to the largest, offering a right-sized GPU with guaranteed quality of service (QoS) for every job, optimizing utilization, and extending the reach of accelerated computing resources to every user.
SUT configurations
We selected servers with different types of NVIDIA GPUs as our SUT to conduct data center inference benchmarks. The following tables list the MLPerf system configurations for these servers.
Note: In the following tables, the main difference in the software stack is the use of NVIDIA Triton Inference Servers.
Table 3: MLPerf system configurations for Dell EMC DSS 8440 servers
| Platform | DSS8440_A100 | DSS8440_A30 | DSS8440_A30 |
| MLPerf System ID | DSS8440_A100-PCIE-80GBx10_TRT | DSS8440_A30x8_TRT | DSS8440_A30x8_TRT_Triton |
| Operating system | CentOS 8.2.2004 | ||
| CPU | Intel Xeon Gold 6248R CPU @ 3.00 GHz | Intel Xeon Gold 6248R | Intel Xeon Gold 6248R |
| Memory | 768 GB | 1 TB | |
| GPU | NVIDIA A100-PCIe-80GB | NVIDIA A30 | |
| GPU form factor | PCIe | ||
| GPU count | 10 | 8 | |
| Software stack | TensorRT 8.0.2 CUDA 11.3 cuDNN 8.2.1 Driver 470.42.01 DALI 0.31.0 | ||
| Triton 21.07 | |||
Table 4: MLPerf system configurations for PowerEdge servers
Platform | R750xa_A100 | R750xa_A100 | R750xa_A100 | R7525_A100 | R7525_A30 |
MLPerf System ID | R750xa_A100-PCIE-80GB-MIG_28x1g.10gb_TRT_Triton | R750xa_A100-PCIE-80GBx4_TRT | R750xa_A100-PCIE-80GBx4_TRT_Triton | R7525_A100-PCIE-40GBx3_TRT | R7525_A30x3_TRT |
Operating system | CentOS 8.2.2004
| ||||
CPU | Intel Xeon Gold 6338 | AMD EPYC 7502 32-Core Processor | AMD EPYC 7763 | ||
Memory | 1 TB | 512 GB | 1 TB | ||
GPU | NVIDIA A100-PCIE-80GB (7x1g.10gb MIG) | NVIDIA A100-PCIE-80GB
| NVIDIA A100-PCIE-40GB | NVIDIA A30 | |
GPU form factor | PCIe | ||||
GPU count | 4 | 3 | |||
Software stack | TensorRT 8.0.2 CUDA 11.3 cuDNN 8.2.1 Driver 470.42.01 DALI 0.31.0 | ||||
Triton 21.07 |
| Triton 21.07 |
| ||