


Introduction to MLPerf™ Inference v1.0 Performance with Dell EMC Servers
Wed, 15 Sep 2021 12:09:44 -0000
|Read Time: 0 minutes
This blog provides MLPerf inference v1.0 data center closed results on Dell servers running the MLPerf inference benchmarks. Our results show optimal inference performance for the systems and configurations on which we chose to run inference benchmarks.
The MLPerf benchmarking suite measures the performance of machine learning (ML) workloads. Currently, these benchmarks provide a consistent way to measure accuracy and throughput for the following aspects of the ML life cycle:
- Training—The MLPerf training benchmark suite measures how fast a system can train ML models.
- Inference—The MLPerf inference benchmark measures how fast a system can perform ML inference by using a trained model in various deployment scenarios.
MLPerf is now a part of the MLCommons™ Association. MLCommons is an open engineering consortium that promotes the acceleration of machine learning innovation. Its open collaborative engineering solutions support your machine learning needs. MLCommons provides:
- Benchmarks and metrics
- Datasets and models
- Best practices
MLPerf inference overview
As of March 2021, MLPerf inference has submitted three versions: v0.5, v0.7, and v1.0. The latest version, v1.0, uses the same benchmarks as v0.7 with the following exceptions:
- Power submission—Power submission, which is a wrapper around inference submission, is supported.
- Error connection code (ECC)—The ECC must set to ON.
- 10-minute runtime—The default benchmark run time is 10 minutes.
- Required number of runs for submission and audit tests—The number of runs that are required to submit Server scenario is one.
v1.0 meets v0.7 requirements, therefore v1.0 results are comparable to v0.7 results. Because the MLPerf v1.0 submissions are more restrictive, the v0.7 results do not meet v1.0 requirements.
In the MLPerf inference evaluation framework, the LoadGen load generator sends inference queries to the system under test (SUT). In our case, the SUTs are Dell EMC servers with various GPU configurations. The SUTs uses a backend (for example, TensorRT, TensorFlow, or PyTorch) to perform inferencing and returns the results to LoadGen.
MLPerf has identified four different scenarios that enable representative testing of a wide variety of inference platforms and use cases. The main differences between these scenarios are based on how the queries are sent and received:
- Offline—One query with all samples is sent to the SUT. The SUT can send the results back once or multiple times in any order. The performance metric is samples per second.
- Server—The queries are sent to the SUT following a Poisson distribution (to model real-world random events). One query has one sample. The performance metric is queries per second (QPS) within latency bound.
- Single-stream—One sample per query is sent to the SUT. The next query is not sent until the previous response is received. The performance metric is 90th percentile latency.
- Multi-stream—A query with N samples is sent with a fixed interval. The performance metric is max N when the latency of all queries is within a latency bound.
MLPerf Inference Rules describes detailed inference rules and latency constraints. This blog focuses on Offline and Server scenarios, which are designed for data center environments. Single-stream and Multi-stream scenarios are designed for non-datacenter (edge and IoT) settings.
MLPerf inference results are submitted under either of the following divisions:
- Closed division—The Closed division provides a “like-to-like” comparison of hardware platforms or software frameworks. It requires using the same model and optimizer as the reference implementation.
The Closed division requires using preprocessing, postprocessing, and model that is equivalent to the reference or alternative implementation. It allows calibration for quantization and does not allow retraining. MLPerf provides a reference implementation of each benchmark. The benchmark implementation must use a model that is equivalent, as defined in MLPerf Inference Rules, to the model used in the reference implementation.
- Open division—The Open division promotes faster models and optimizers and allows any ML approach that can reach the target quality. It allows using arbitrary preprocessing or postprocessing and model, including retraining. The benchmark implementation may use a different model to perform the same task.
To allow the like-to-like comparison of Dell Technologies results and enable our customers and partners to repeat our results, we chose to test under the Closed division, as the results in this blog show.
Criteria for MLPerf Inference v1.0 benchmark result submission
For any benchmark, the result submission must meet all the specifications shown in the following table. For example, if we choose the Resnet50 model, then the submission must meet the 76.46 percent target accuracy and the latency must be within 15 ms for the standard image dataset with dimensions of 224 x 224 x 3.
Table 1: Closed division benchmarks for MLPerf inference v1.0 with expectations
Area | Task | Model | Dataset | QSL Size | Quality | Server latency constraint |
Vision | Image classification | Resnet50 – v1.5 | Standard image dataset (224 x 224 x3) | 1024 | 99% of FP32 (76.46%) | 15 ms |
Vision | Object detection (large) | SSD-Resnet34 | COCO (1200 x 1200) | 64 | 99% of FP32 (0.20 mAP) | 100 ms |
Vision | Medical image segmentation | 3D UNet | BraTs 2019 (224 x 224 x 160) | 16 | 99% of FP32 and 99.9% of FP32 (0.85300 mean DICE score) | N/A |
Speech | Speech-to-text | RNNT | Librispeech dev-clean (samples < 15 seconds) | 2513
| 99% of FP32 (1 - WER, where WER=7.452253714852645%)
| 1000 ms |
Language | Language processing | BERT | SQuAD v1.1 (max_seq_len=384) | 10833
| 99% of FP32 and 99.9% of FP32 (f1_score=90.874%) | 130 ms |
Commerce | Recommendation | DLRM | 1 TB Click Logs | 204800 | 99% of FP32 and 99.9% of FP32 (AUC=80.25%) | 30 ms |
It is not mandatory to submit all the benchmarks. However, if a specific benchmark is submitted, then all the required scenarios for that benchmark must also be submitted.
Each data center benchmark requires the scenarios in the following table:
Table 2: Tasks and corresponding required scenarios for data center benchmark suite in MLPerf inference v1.0.
Area | Task | Required scenario |
Vision | Image classification | Server, Offline |
Vision | Object detection (large) | Server, Offline |
Vision | Medical image segmentation | Offline |
Speech | Speech-to-text | Server, Offline |
Language | Language processing | Server, Offline |
Commerce | Recommendation | Server, Offline |
SUT configurations
We selected the following servers with different types of NVIDIA GPUs as our SUT to conduct data center inference benchmarks. The following table lists the MLPerf system configurations:
Table 3: MLPerf system configurations
Platform | Dell EMC DSS8440_A100 | Dell EMC DSS8440_A40 | PowerEdge R750xa | PowerEdge XE8545 |
MLPerf System ID | DSS8440_A100-PCIE-40GBx10_TRT | DSS8440_A40x10_TRT | R750xa_A100-PCIE-40GBx4_TRT | XE8545_7713_A100-SXM4-40GBx4 |
Operating system | CentOS 8.2.2004 | CentOS 8.2.2004 | CentOS 8.2.2004 | CentOS 8.2.2004 |
CPU | 2 x Intel Xeon Gold 6248 CPU @ 2.50 GHz | 2 x Intel Xeon Gold 6248R CPU @ 3.00 GHz | 2 x Intel Xeon Gold 6338 CPU @ 2.00 GHz | 2 x AMD EPYC 7713 |
Memory | 768 GB | 768 GB | 256 GB | 1 TB |
GPU | NVIDIA A100-PCIe-40GB | NVIDIA A40 | NVIDIA A100-PCIE-40GB | NVIDIA A100-SXM4-40GB |
GPU Form Factor | PCIE | PCIE | PCIE | SXM4 |
GPU count | 10 | 10 | 4 | 4 |
Software Stack | TensorRT 7.2.3, CUDA 11.1, cuDNN 8.1.1, Driver 460.32.03, DALI 0.30.0 | TensorRT 7.2.3, CUDA 11.1, cuDNN 8.1.1, Driver 460.32.03, DALI 0.30.0 | TensorRT 7.2.3, CUDA 11.1, cuDNN 8.1.1, Driver 460.32.03, DALI 0.30.0 | TensorRT 7.2.3, CUDA 11.1, cuDNN 8.1.1, Driver 460.32.03, DALI 0.30.0 |
MLPerf inference 1.0 benchmark results
The following graphs include performance metrics for the Offline and Server scenarios.
For the Offline scenario, the performance metric is Offline samples per second. For the Server scenario, the performance metric is queries per second (QPS). In general, the metrics represent throughput. A higher throughput is a better result.
Resnet50 results
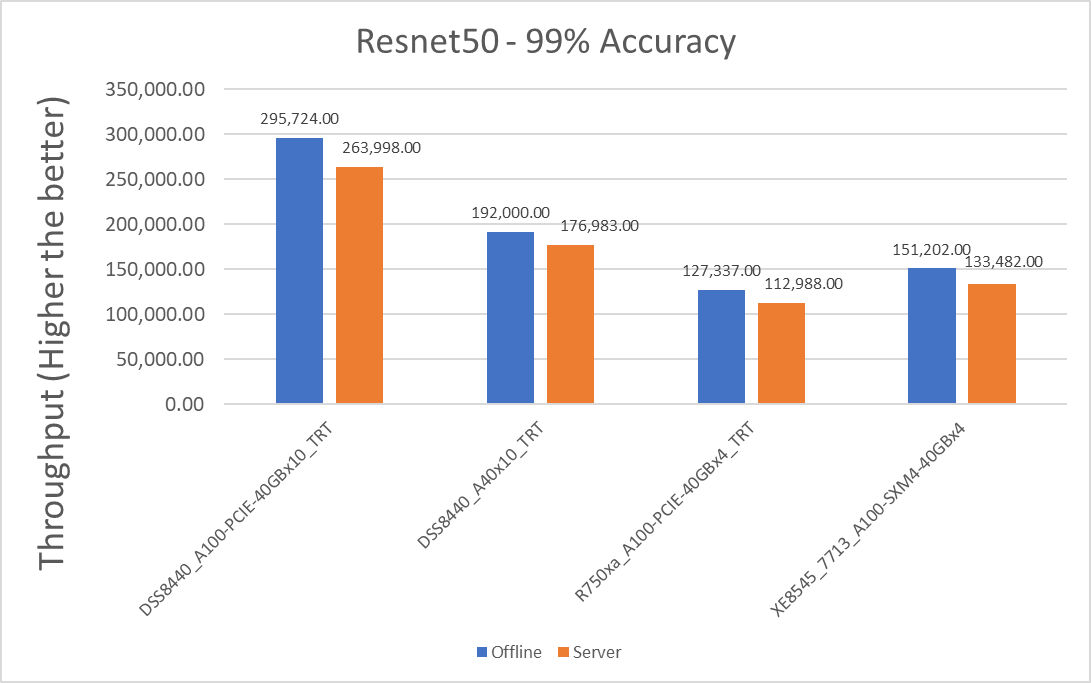
Figure 1: Resnet50 v1.5 Offline and Server scenario with 99 percent accuracy target
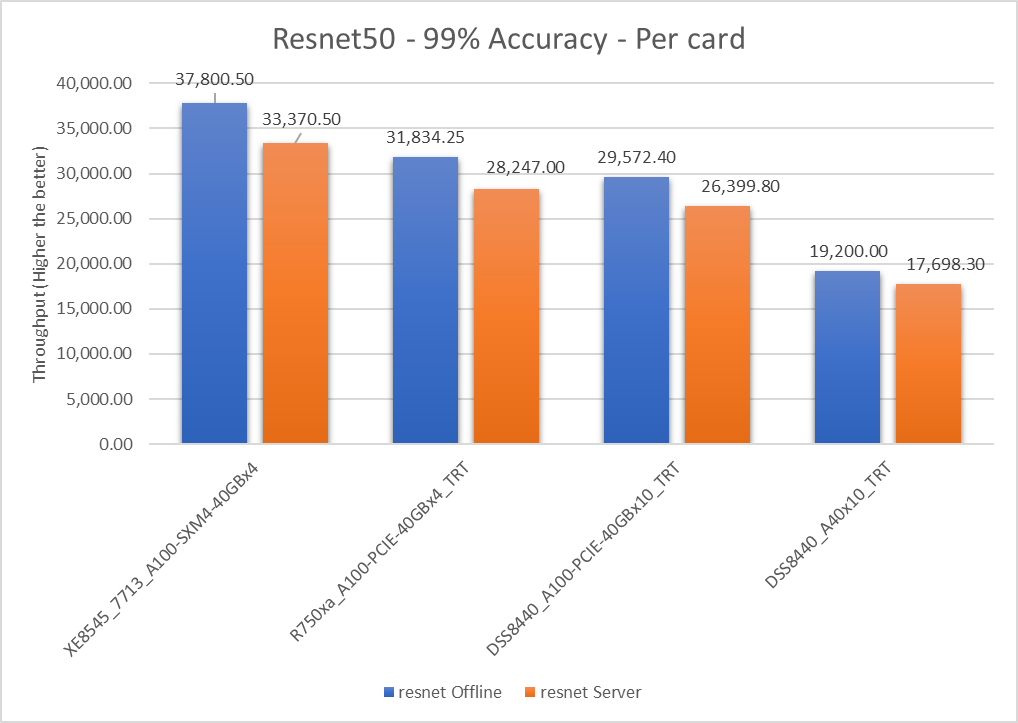
Figure 2: Resnet50 v1.5 Offline and Server scenario with 99 percent accuracy target per card
Table 4: Per card numbers and scenario percentage difference
Dell Server | Offline throughput | Server throughput | Percentage difference between scenarios |
XE8545_7713_A100-SXM4-40GBx4 | 37800.5 | 33370.5 | 12.44 |
R750xa_A100-PCIE-40GBx4_TRT | 31834.25 | 28247 | 11.94 |
DSS8440_A100-PCIE-40GBx10_TRT | 29572.4 | 26399.8 | 11.33 |
DSS8440_A40x10_TRT | 19200 | 17698.3 | 8.139 |
The Offline per card throughput exceeds the Server per card throughput for all the servers in this study.
Table 5: Per card percentage difference from a XE8545_7713_A100-SXM4-40GBx4 system
Dell Server | Offline (in percentage) | Server (in percentage) |
XE8545_7713_A100-SXM4-40GBx4 | 0 | 0 |
R750xa_A100-PCIE-40GBx4_TRT | 17.13 | 16.63 |
DSS8440_A100-PCIE-40GBx10_TRT | 24.42 | 26.39 |
DSS8440_A40x10_TRT | 65.26 | 61.37 |
SSD-Resnet34 results
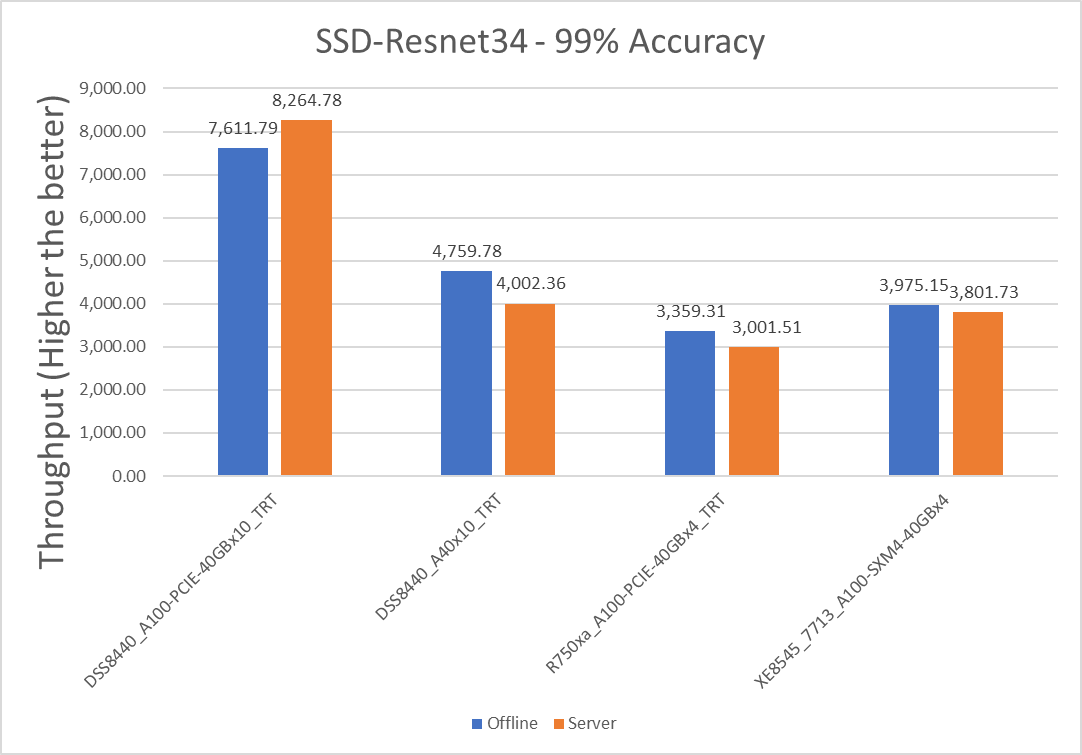
Figure 3: SSD with Resnet34 Offline and Server scenario with 99 percent accuracy target
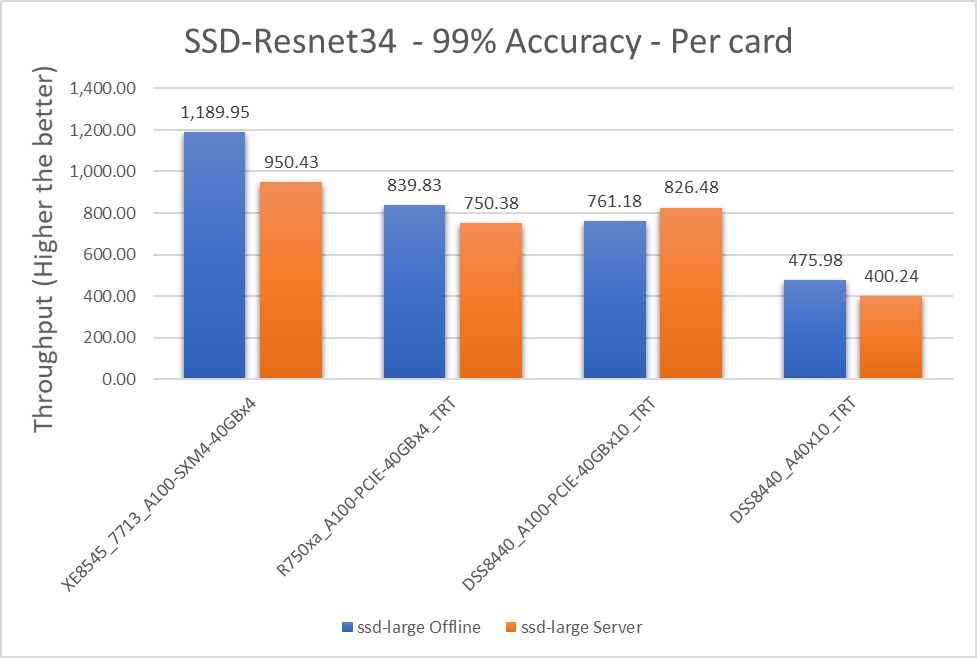
Figure 4: SSD-Resnet34, Offline and Server scenario with 99 percent accuracy targets per card
Table 6: Per card numbers and scenario percentage difference on SSD-Resnet34
Dell Server | Offline throughput | Server throughput | Percentage difference between scenarios |
XE8545_7713_A100-SXM4-40GBx4 | 1189.945 | 950.4325 | 22.38 |
R750xa_A100-PCIE-40GBx4_TRT | 839.8275 | 750.3775 | 11.25 |
DSS8440_A100-PCIE-40GBx10_TRT | 761.179 | 826.478 | -8.22 |
DSS8440_A40x10_TRT | 475.978 | 400.236 | 17.28 |
Note: A negative value of percentage difference indicates the Server scenario outperformed the Offline scenario.
Table 7: Per card percentage difference from a XE8545_7713_A100-SXM4-40GBx4 system with an A100 SXM4 card
Dell Server | Offline (in percentage) | Server (in percentage) |
XE8545_7713_A100-SXM4-40GBx4 | 0 | 0 |
R750xa_A100-PCIE-40GBx4_TRT | 34.4982 | 23.52 |
DSS8440_A100-PCIE-40GBx10_TRT | 43.95067 | 13.95 |
DSS8440_A40x10_TRT | 85.71429 | 81.47 |
BERT Results
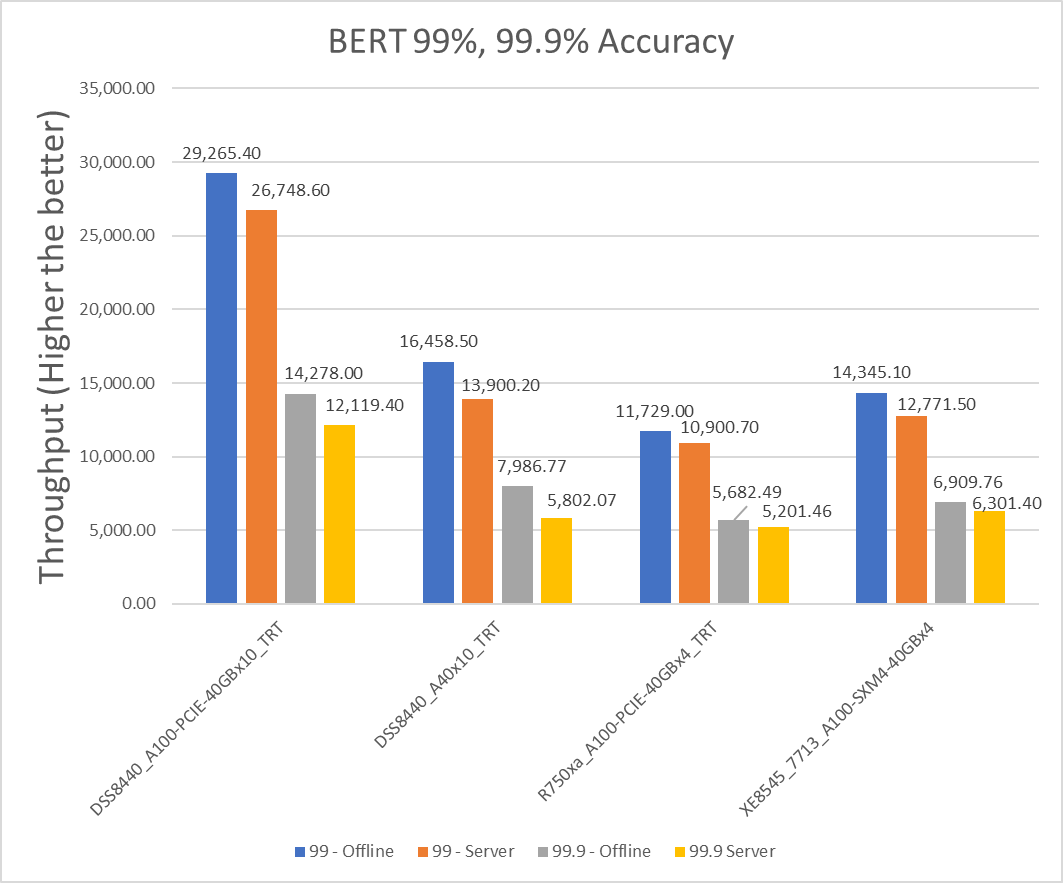
Figure 4: BERT Offline and Server scenario with 99 percent and 99.9 percent accuracy targets
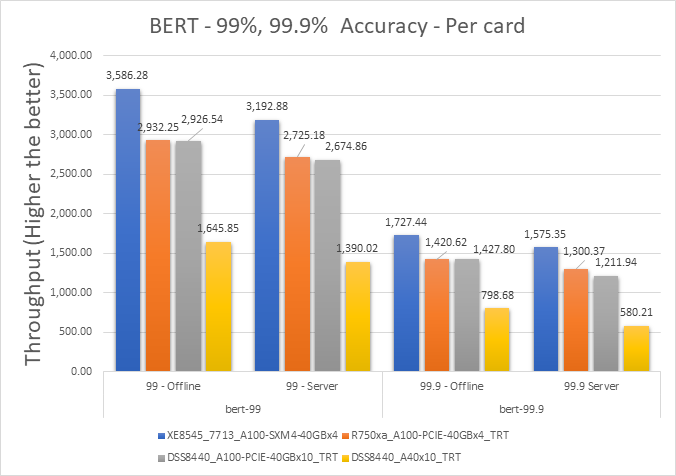
Figure 5: BERT Offline and Server scenario with 99 percent and 99.9 percent accuracy targets per card
Table 8: Per card numbers and scenario percentage difference on BERT with 99 percent accuracy target
Dell Server | Offline throughput | Server throughput | Percentage difference between scenarios |
XE8545_7713_A100-SXM4-40GBx4 | 3586.275 | 3192.875 | 11.60617482 |
R750xa_A100-PCIE-40GBx4_TRT | 2932.25 | 2725.175 | 7.320468234 |
DSS8440_A100-PCIE-40GBx10_TRT | 2926.54 | 2674.86 | 8.986324847 |
DSS8440_A40x10_TRT | 1645.85 | 1390.02 | 16.85381785 |
Table 9: Per card percentage difference from an XE8545_7713_A100-SXM4-40GBx4 system with an A100 SXM4 card
Dell Server | 99% - Offline (in percentage) | 99% - Server (in percentage) |
XE8545_7713_A100-SXM4-40GBx4 | 0 | 0 |
R750xa_A100-PCIE-40GBx4_TRT | 20.06 | 15.8 |
DSS8440_A100-PCIE-40GBx10_TRT | 20.25 | 17.65 |
DSS8440_A40x10_TRT | 74.17 | 78.67 |
Table 10: Per card numbers and scenario percentage difference on BERT with 99.9 percent accuracy target
Dell Server | 99.9% - Offline throughput | 99.9% Server throughput | Percentage difference between scenarios |
XE8545_7713_A100-SXM4-40GBx4 | 1727.44 | 1575.35 | 9.2097893 |
R750xa_A100-PCIE-40GBx4_TRT | 1420.6225 | 1300.365 | 8.8392541 |
DSS8440_A100-PCIE-40GBx10_TRT | 1427.8 | 1211.94 | 16.354641 |
DSS8440_A40x10_TRT | 798.677 | 580.207 | 31.687945 |
Table 11: Per card percentage difference from an XE8545_7713_A100-SXM4-40GBx4 system with an A100 SXM4 card
Dell Server | 99.9% - Offline (in percentage) | 99.9% - Server (in percentage) |
XE8545_7713_A100-SXM4-40GBx4 | 0 | 0 |
R750xa_A100-PCIE-40GBx4_TRT | 19.49 | 19.12 |
DSS8440_A100-PCIE-40GBx10_TRT | 18.99 | 26.07 |
DSS8440_A40x10_TRT | 73.53 | 92.33 |
RNN-T Results
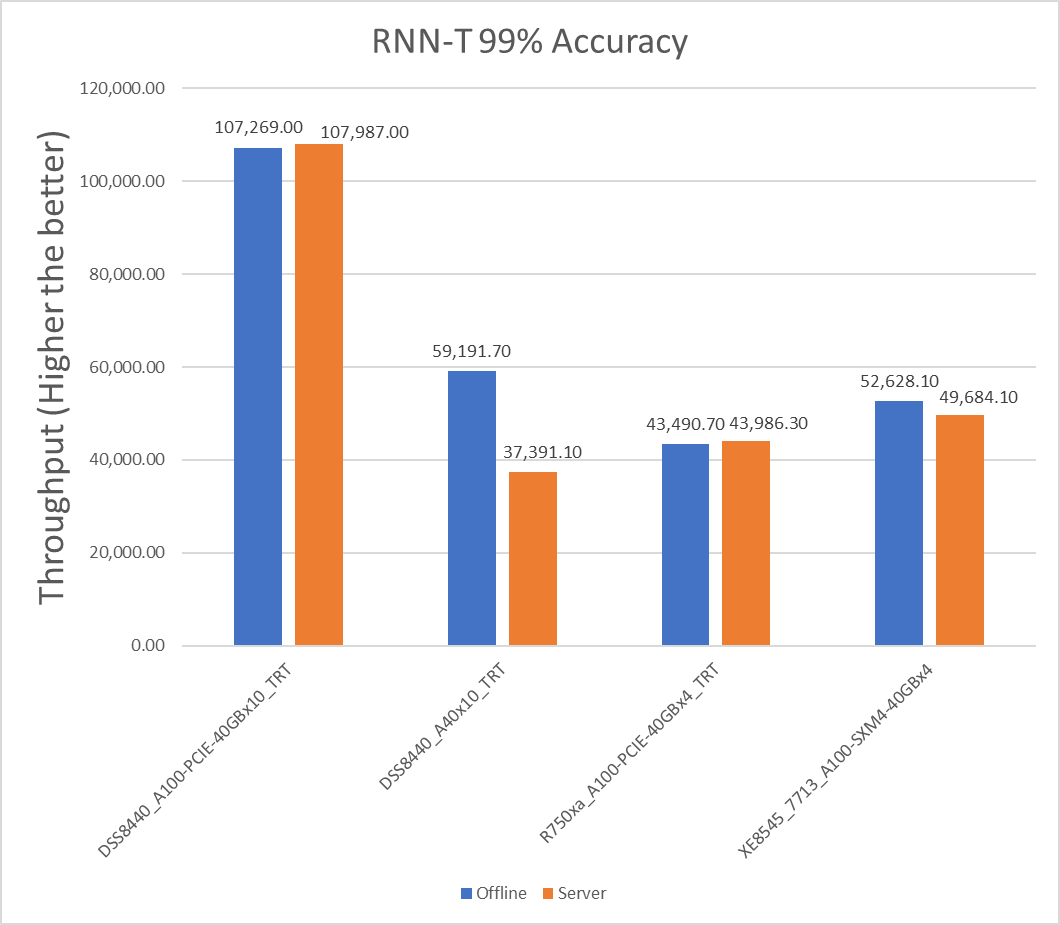
Figure 6: RNN-T Offline and Server scenario with 99 percent accuracy target
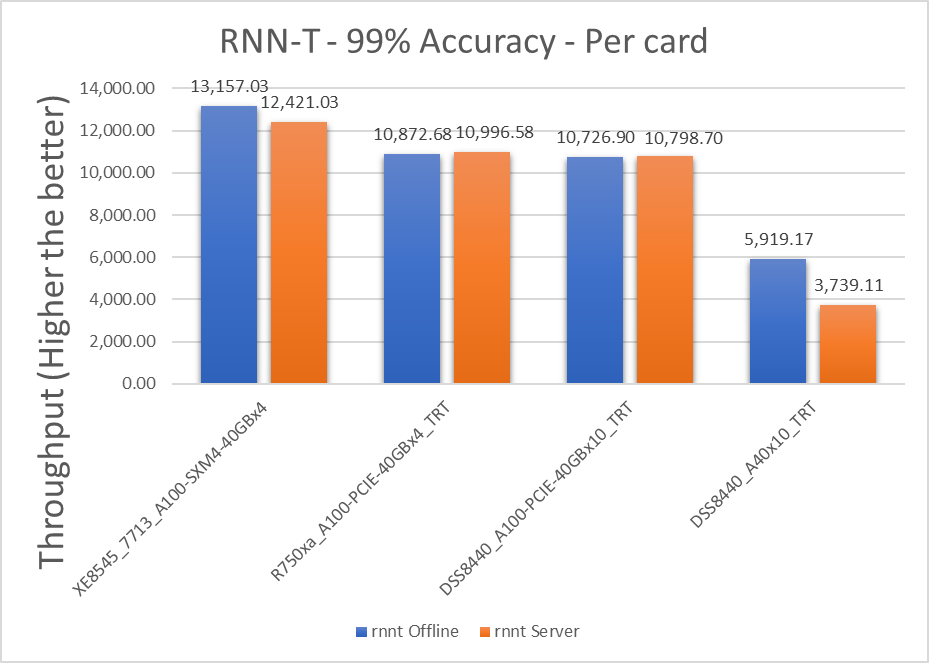
Figure 7: RNN-T Offline and Server scenario with 99 percent accuracy target per card
Table 12: Per card numbers and scenario percentage difference on RNNT with 99 percent accuracy target
Dell Server | Offline throughput | Server throughput | Percentage difference between scenarios |
XE8545_7713_A100-SXM4-40GBx4 | 13157.025 | 12421.025 | 5.754934 |
R750xa_A100-PCIE-40GBx4_TRT | 10872.675 | 10996.575 | -1.1331 |
DSS8440_A100-PCIE-40GBx10_TRT | 10726.9 | 10798.7 | -0.66711 |
DSS8440_A40x10_TRT | 5919.17 | 3739.11 | 45.14386 |
Note: A negative value for the percentage difference indicates that Server scenario performed better than Offline scenario.
Table 13: Per card percentage difference from an XE8545_7713_A100-SXM4-40GBx4 system with an A100 SXM4 card
Dell Server | Offline (in percentage) | Server (in percentage) |
XE8545_7713_A100-SXM4-40GBx4 | 0 | 0 |
R750xa_A100-PCIE-40GBx4_TRT | 19.01 | 12.16 |
DSS8440_A100-PCIE-40GBx10_TRT | 20.34 | 13.97 |
DSS8440_A40x10_TRT | 75.88 | 107.44 |
3D-UNet Results
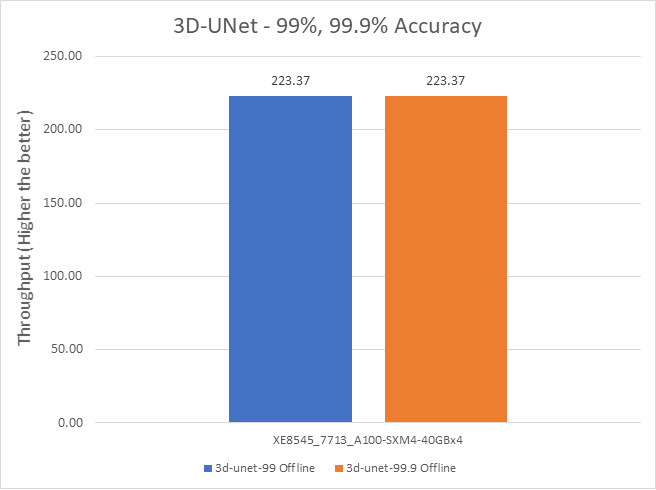
Figure 8: 3D-UNet Offline and Server scenario with 99 percent and 99.9 percent accuracy target
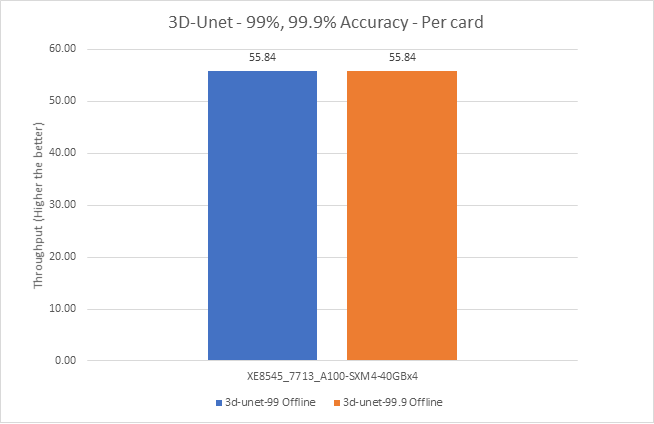
Figure 9: 3D-UNet Offline and Server scenario with 99 percent and 99.9 percent accuracy target
Conclusion
In this blog, we quantified the MLCommons MLPerf inference v1.0 performance on Dell EMC DSS8440, PowerEdge R750xa, and PowerEdge XE8545 servers with A100 PCIE and SXM form factors using benchmarks such as Resnet50, SSD w/ Resnet34, BERT, RNN-T, and 3D-UNet. These benchmarks span tasks from vision to recommendation. Dell EMC servers delivered top inference performance normalized to processor count among commercially available results.
The PowerEdge XE8545 server outperforms the per card numbers of other servers in this study. This result can be attributed to its SXM GPU, which offers higher base and boost clock rate.
The SSD-Resnet34 image segmentation model benefits significantly from an SXM form factor-based GPU. The results show an approximate 34 percent performance difference compared to a PCIE from factor, relative to other models that average approximately 20 percent.
The PowerEdge R750xa server with an A100 GPU performs better in the Server scenario than in the Offline scenario for RNN-T model.
The DSS 8440 server with an A100 GPU performs better in the Server scenario than the Offline scenario for BERT, RNN-T, and SSD-Resnet34 models.
Furthermore, we found that the performance of the DSS8440 server with 10 x A100 PCIE cards exceeded other MLCommons MLPerf inference v1.0 submissions for the RNN-T Server benchmark.
Next Steps
In future blogs, we plan to describe how to:
- Run MLCommons MLPerf inference v1.0
- Understand MLCommons MLPerf inference results on recently released PowerEdge R750xa and PowerEdge XE8545 servers
- Run benchmarks on other servers
Related Blog Posts

Quantifying Performance of Dell EMC PowerEdge R7525 Servers with NVIDIA A100 GPUs for Deep Learning Inference
Tue, 17 Nov 2020 21:10:22 -0000
|Read Time: 0 minutes
The Dell EMC PowerEdge R7525 server provides exceptional MLPerf Inference v0.7 Results, which indicate that:
- Dell Technologies holds the #1 spot in performance per GPU with the NVIDIA A100-PCIe GPU on the DLRM-99 Server scenario
- Dell Technologies holds the #1 spot in performance per GPU with the NVIDIA A100-PCIe on the DLRM-99.9 Server scenario
- Dell Technologies holds the #1 spot in performance per GPU with the NVIDIA A100-PCIe on the ResNet-50 Server scenario
Summary
In this blog, we provide the performance numbers of our recently released Dell EMC PowerEdge R7525 server with two NVIDIA A100 GPUs on all the results of the MLPerf Inference v0.7 benchmark. Our results indicate that the PowerEdge R7525 server is an excellent choice for inference workloads. It delivers optimal performance for different tasks that are in the MLPerf Inference v0.7 benchmark. These tasks include image classification, object detection, medical image segmentation, speech to text, language processing, and recommendation.
The PowerEdge R7525 server is a two-socket, 2U rack server that is designed to run workloads using flexible I/O and network configurations. The PowerEdge R7525 server features the 2nd Gen AMD EPYC processor, supports up to 32 DIMMs, has PCI Express (PCIe) Gen 4.0-enabled expansion slots, and provides a choice of network interface technologies to cover networking options.
The following figure shows the front view of the PowerEdge R7525 server:
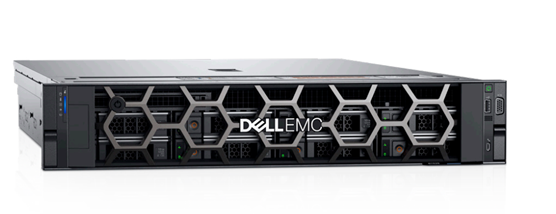
Figure 1. Dell EMC PowerEdge R7525 server
The PowerEdge R7525 server is designed to handle demanding workloads and for AI applications such as AI training for different kinds of models and inference for different deployment scenarios. The PowerEdge R7525 server supports various accelerators such as NVIDIA T4, NVIDIA V100S, NVIDIA RTX, and NVIDIA A100 GPU s. The following sections compare the performance of NVIDIA A100 GPUs with NVIDIA T4 and NVIDIA RTX GPUs using MLPerf Inference v0.7 as a benchmark.
The following table provides details of the PowerEdge R7525 server configuration and software environment for MLPerf Inference v0.7:
Component | Description |
Processor | AMD EPYC 7502 32-Core Processor |
Memory | 512 GB (32 GB 3200 MT/s * 16) |
Local disk | 2x 1.8 TB SSD (No RAID) |
Operating system | CentOS Linux release 8.1 |
GPU | NVIDIA A100-PCIe-40G, T4-16G, and RTX8000 |
CUDA Driver | 450.51.05 |
CUDA Toolkit | 11.0 |
Other CUDA-related libraries | TensorRT 7.2, CUDA 11.0, cuDNN 8.0.2, cuBLAS 11.2.0, libjemalloc2, cub 1.8.0, tensorrt-laboratory mlperf branch |
Other software stack | Docker 19.03.12, Python 3.6.8, GCC 5.5.0, ONNX 1.3.0, TensorFlow 1.13.1, PyTorch 1.1.0, torchvision 0.3.0, PyCUDA 2019.1, SacreBLEU 1.3.3, simplejson, OpenCV 4.1.1 |
System profiles | Performance |
For more information about how to run the benchmark, see Running the MLPerf Inference v0.7 Benchmark on Dell EMC Systems.
MLPerf Inference v0.7 performance results
The MLPerf inference benchmark measures how fast a system can perform machine learning (ML) inference using a trained model in various deployment scenarios. The following results represent the Offline and Server scenarios of the MLPerf Inference benchmark. For more information about different scenarios, models, datasets, accuracy targets, and latency constraints in MLPerf Inference v0.7, see Deep Learning Performance with MLPerf Inference v0.7 Benchmark.
In the MLPerf inference evaluation framework, the LoadGen load generator sends inference queries to the system under test, in our case, the PowerEdge R7525 server with various GPU configurations. The system under test uses a backend (for example, TensorRT, TensorFlow, or PyTorch) to perform inferencing and sends the results back to LoadGen.
MLPerf has identified four different scenarios that enable representative testing of a wide variety of inference platforms and use cases. In this blog, we discuss the Offline and Server scenario performance. The main differences between these scenarios are based on how the queries are sent and received:
- Offline—One query with all samples is sent to the system under test. The system under test can send the results back once or multiple times in any order. The performance metric is samples per second.
- Server—Queries are sent to the system under test following a Poisson distribution (to model real-world random events). One query has one sample. The performance metric is queries per second (QPS) within latency bound.
Note: Both the performance metrics for Offline and Server scenario represent the throughput of the system.
In all the benchmarks, two NVIDIA A100 GPUs outperform eight NVIDIA T4 GPUs and three NVIDIA RTX800 GPUs for the following models:
- ResNet-50 image classification model
- SSD-ResNet34 object detection model
- RNN-T speech recognition model
- BERT language processing model
- DLRM recommender model
- 3D U-Net medical image segmentation model
The following graphs show PowerEdge R7525 server performance with two NVIDIA A100 GPUs, eight NVIDIA T4 GPUs, and three NVIDIA RTX8000 GPUs with 99% accuracy target benchmarks and 99.9% accuracy targets for applicable benchmarks:
- 99% accuracy (default accuracy) target benchmarks: ResNet-50, SSD-Resnet34, and RNN-T
- 99% and 99.9% accuracy (high accuracy) target benchmarks: DLRM, BERT, and 3D-Unet
99% accuracy target benchmarks
ResNet-50
The following figure shows results for the ResNet-50 model:
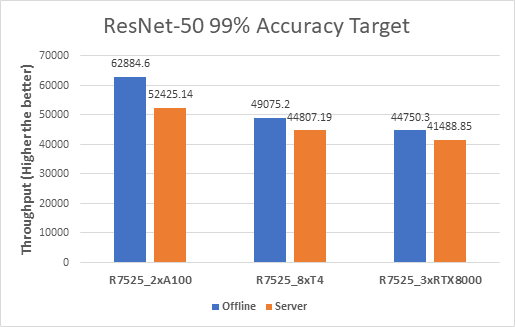
Figure 2. ResNet-50 Offline and Server inference performance
From the graph, we can derive the per GPU values. We divide the system throughput (containing all the GPUs) by the number of GPUs to get the Per GPU results as they are linearly scaled.
SSD-Resnet34
The following figure shows the results for the SSD-Resnet34 model:
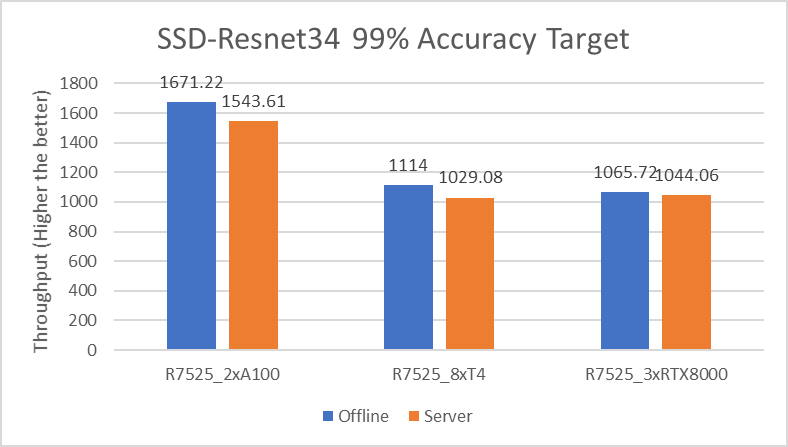
Figure 3. SSD-Resnet34 Offline and Server inference performance
RNN-T
The following figure shows the results for the RNN-T model:
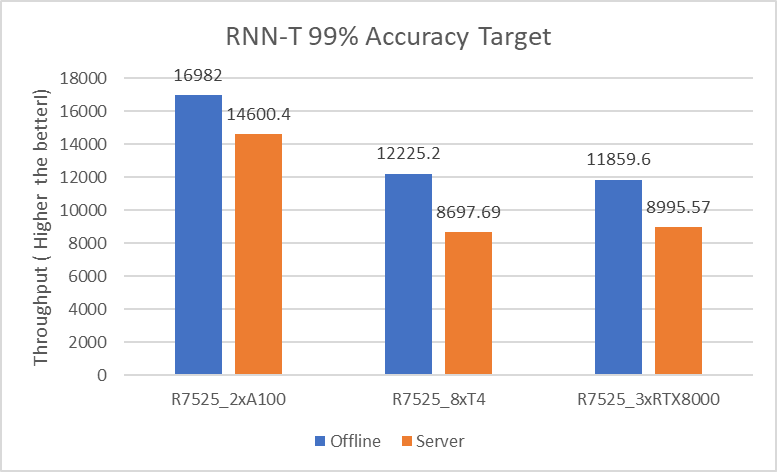
Figure 4. RNN-T Offline and Server inference performance
99.9% accuracy target benchmarks
DLRM
The following figures show the results for the DLRM model with 99% and 99.9% accuracy:
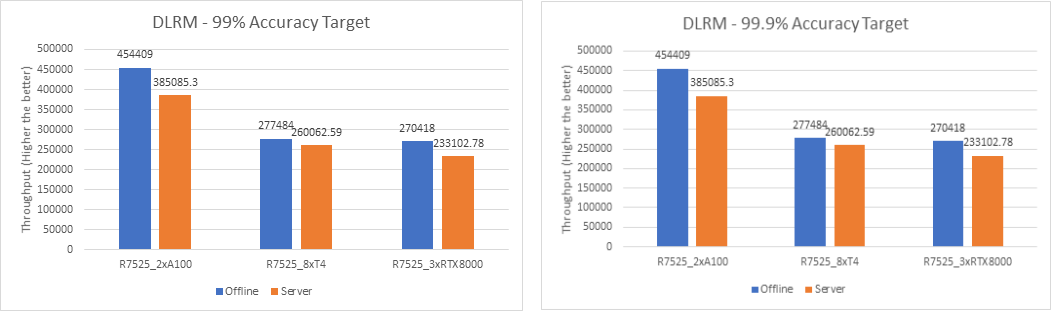
Figure 5. DLRM Offline and Server Scenario inference performance – 99% and 99.9% accuracy
For the DLRM recommender and 3D U-Net medical image segmentation (see Figure 7) models, both 99% and 99.9% accuracy have the same throughput. The 99.9% accuracy benchmark also satisfies the required accuracy constraints with the same throughput as that of 99%.
BERT
The following figures show the results for the BERT model with 99% and 99.9% accuracy:
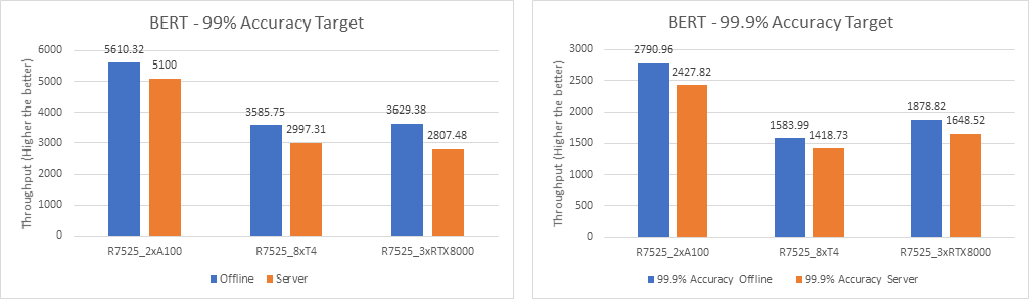
Figure 6. BERT Offline and Server inference performance – 99% and 99.9% accuracy
For the BERT language processing model, two NVIDIA A100 GPUs outperform eight NVIDIA T4 GPUs and three NVIDIA RTX8000 GPUs. However, the performance of three NVIDIA RTX8000 GPUs is a little better than that of eight NVIDIA T4 GPUs.
3D U-Net
For the 3D-Unet medical image segmentation model, only the Offline scenario benchmark is available.
The following figure shows the results for the 3D U-Net model Offline scenario:
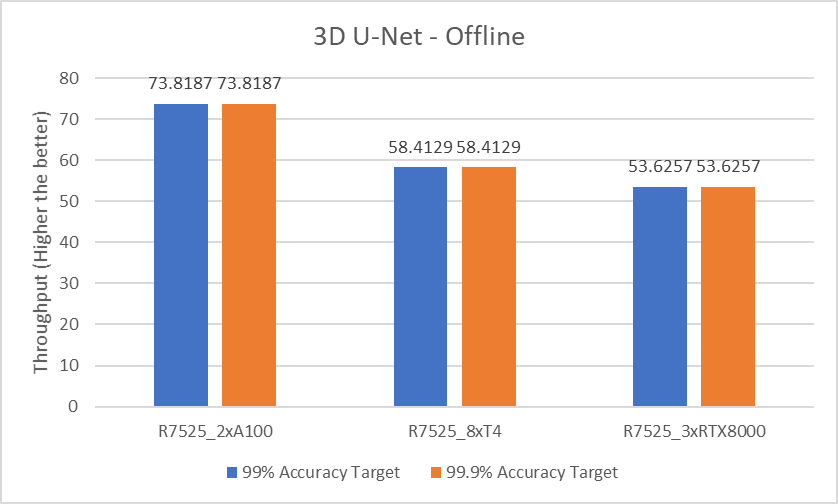
Figure 7. 3D U-Net Offline inference performance
For the 3D-Unet medical image segmentation model, since there is only offline scenario benchmark for 3D-Unet the above graph represents only Offline scenario.
The following table compares the throughput between two NVIDIA A100 GPUs, eight NVIDIA T4 GPUs, and three NVIDIA RTX8000 GPUs with 99% accuracy target benchmarks and 99.9% accuracy targets:
Model | Scenario | Accuracy | 2 x A100 GPUs vs 8 x T4 GPUs | 2 x A100 GPUs vs 3 x RTX8000 GPUs |
ResNet-50 | Offline | 99% | 5.21x | 2.10x |
Server | 4.68x | 1.89x | ||
SSD-Resnet34 | Offline | 6.00x | 2.35x | |
Server | 5.99x | 2.21x | ||
RNN-T | Offline | 5.55x | 2.14x | |
Server | 6.71x | 2.43x | ||
DLRM | Offline | 6.55x | 2.52x | |
Server | 5.92x | 2.47x | ||
Offline | 99.9% | 6.55x | 2.52x | |
Server | 5.92x | 2.47x | ||
BERT | Offline | 99% | 6.26x | 2.31x |
Server | 6.80x | 2.72x | ||
Offline | 99.9% | 7.04x | 2.22x | |
Server | 6.84x | 2.20x | ||
3D U-Net | Offline | 99% | 5.05x | 2.06x |
Server | 99.9% | 5.05x | 2.06x |
Conclusion
With support of NVIDIA A100, NVIDIA T4, or NVIDIA RTX8000 GPUs, Dell EMC PowerEdge R7525 server is an exceptional choice for various workloads that involve deep learning inference. However, the higher throughput that we observed with NVIDIA A100 GPUs translates to performance gains and faster business value for inference applications.
Dell EMC PowerEdge R7525 server with two NVIDIA A100 GPUs delivers optimal performance for various inference workloads, whether it is in a batch inference setting such as Offline scenario or Online inference setting such as Server scenario.
Next steps
In future blogs, we will discuss sizing the system (server and GPU configurations) correctly based on the type of workload (area and task).

MLPerf™ Inference v4.0 Performance on Dell PowerEdge R760xa and R7615 Servers with NVIDIA L40S GPUs
Fri, 05 Apr 2024 17:41:56 -0000
|Read Time: 0 minutes
Abstract
Dell Technologies recently submitted results to the MLPerf™ Inference v4.0 benchmark suite. This blog highlights Dell Technologies’ closed division submission made for the Dell PowerEdge R760xa, Dell PowerEdge R7615, and Dell PowerEdge R750xa servers with NVIDIA L40S and NVIDIA A100 GPUs.
Introduction
This blog provides relevant conclusions about the performance improvements that are achieved on the PowerEdge R760xa and R7615 servers with the NVIDIA L40S GPU compared to the PowerEdge R750xa server with the NVIDIA A100 GPU. In the following comparisons, we held the GPU constant across the PowerEdge R760xa and PowerEdge R7615 servers to show the excellent performance of the NVIDIA L40S GPU. Additionally, we also compared the PowerEdge R750xa server with the NVIDIA A100 GPU to its successor the PowerEdge R760xa server with the NVIDIA L40S GPU.
System Under Test configuration
The following table shows the System Under Test (SUT) configuration for the PowerEdge servers.
Table 1: SUT configuration of the Dell PowerEdge R750xa, R760xa, and R7615 servers for MLPerf Inference v4.0
Server | PowerEdge R750xa | PowerEdge R760xa | PowerEdge R7615 |
MLPerf Version | V4.0
| ||
GPU | NVIDIA A100 PCIe 80 GB | NVIDIA L40S
| |
Number of GPUs | 4 | 2 | |
MLPerf System ID | R750xa_A100_PCIe_80GBx4_TRT | R760xa_L40Sx4_TRT | R7615_L40Sx2_TRT
|
CPU | 2 x Intel Xeon Gold 6338 CPU @ 2.00GHz | 2 x Intel Xeon Platinum 8470Q | 1 x AMD EPYC 9354 32-Core Processor |
Memory | 512 GB | ||
Software Stack | TensorRT 9.3.0 CUDA 12.2 cuDNN 8.9.2 Driver 535.54.03 / 535.104.12 DALI 1.28.0 | ||
The following table lists the technical specifications of the NVIDIA L40S and NVIDIA A100 GPUs.
Table 2: Technical specifications of the NVIDIA A100 and NVIDIA L40S GPUs
Model | NVIDIA A100 | NVIDIA L40S | ||
Form factor | SXM4 | PCIe Gen4 | PCIe Gen4 | |
GPU architecture | Ampere | Ada Lovelace | ||
CUDA cores | 6912 | 18176 | ||
Memory size | 80 GB | 48 GB | ||
Memory type | HBM2e | HBM2e | ||
Base clock | 1275 MHz | 1065 MHz | 1110 MHz | |
Boost clock | 1410 MHz | 2520 MHz | ||
Memory clock | 1593 MHz | 1512 MHz | 2250 MHz | |
MIG support | Yes | No | ||
Peak memory bandwidth | 2039 GB/s | 1935 GB/s | 864 GB/s | |
Total board power | 500 W | 300 W | 350 W | |
Dell PowerEdge R760xa server
The PowerEdge R760xa server shines as an Artificial Intelligence (AI) workload server with its cutting-edge inferencing capabilities. This server represents the pinnacle of performance in the AI inferencing space with its processing prowess enabled by Intel Xeon Platinum processors and NVIDIA L40S GPUs. Coupled with NVIDIA TensorRT and CUDA 12.2, the PowerEdge R760xa server is positioned perfectly for any AI workload including, but not limited to, Large Language Models, computer vision, Natural Language Processing, robotics, and edge computing. Whether you are processing image recognition tasks, natural language understanding, or deep learning models, the PowerEdge R760xa server provides the computational muscle for reliable, precise, and fast results.
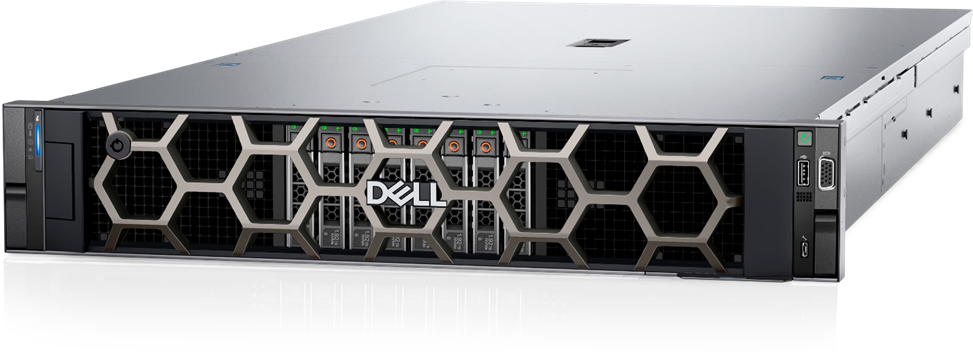
Figure 1: Front view of the Dell PowerEdge R760xa server
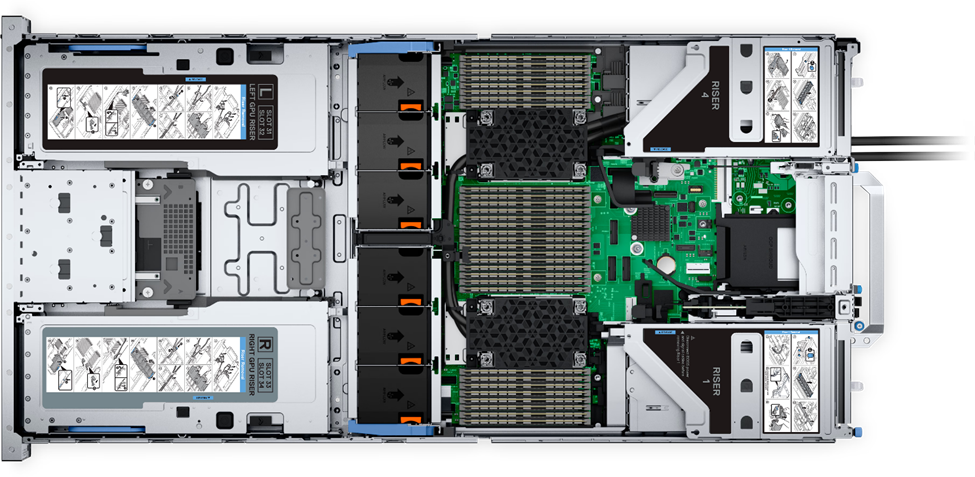
Figure 2: Top view of the Dell PowerEdge R760xa server
Dell PowerEdge R7615 server
The PowerEdge R7615 server stands out as an excellent choice for AI, machine learning (ML), and deep learning (DL) workloads due to its robust performance capabilities and optimized architecture. With its powerful processing capabilities including up to three NVIDIA L40S GPUs supported by TensorRT, this server can handle complex neural network inference and training tasks with ease. Powered by a single AMD EPYC processor, this server performs well for any demanding AI workloads.
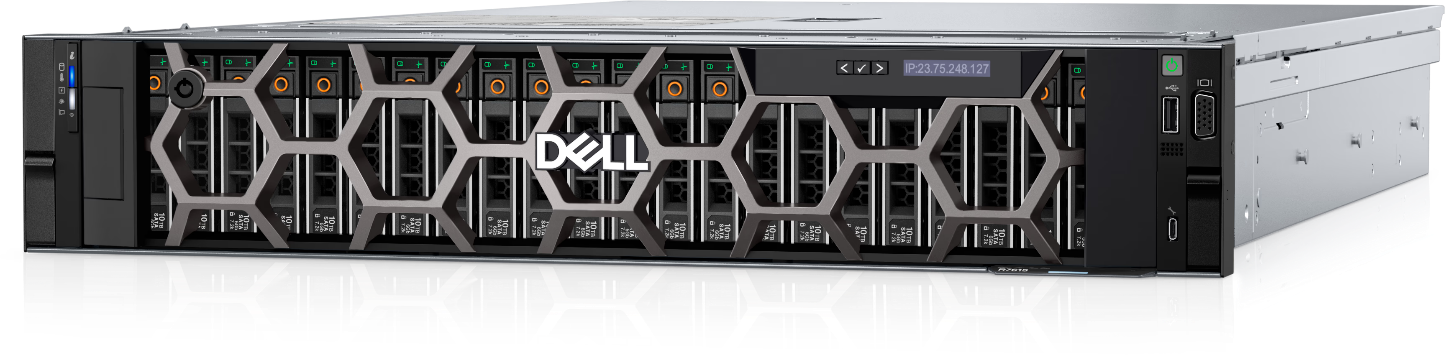
Figure 3: Front view of the Dell PowerEdge R7615 server
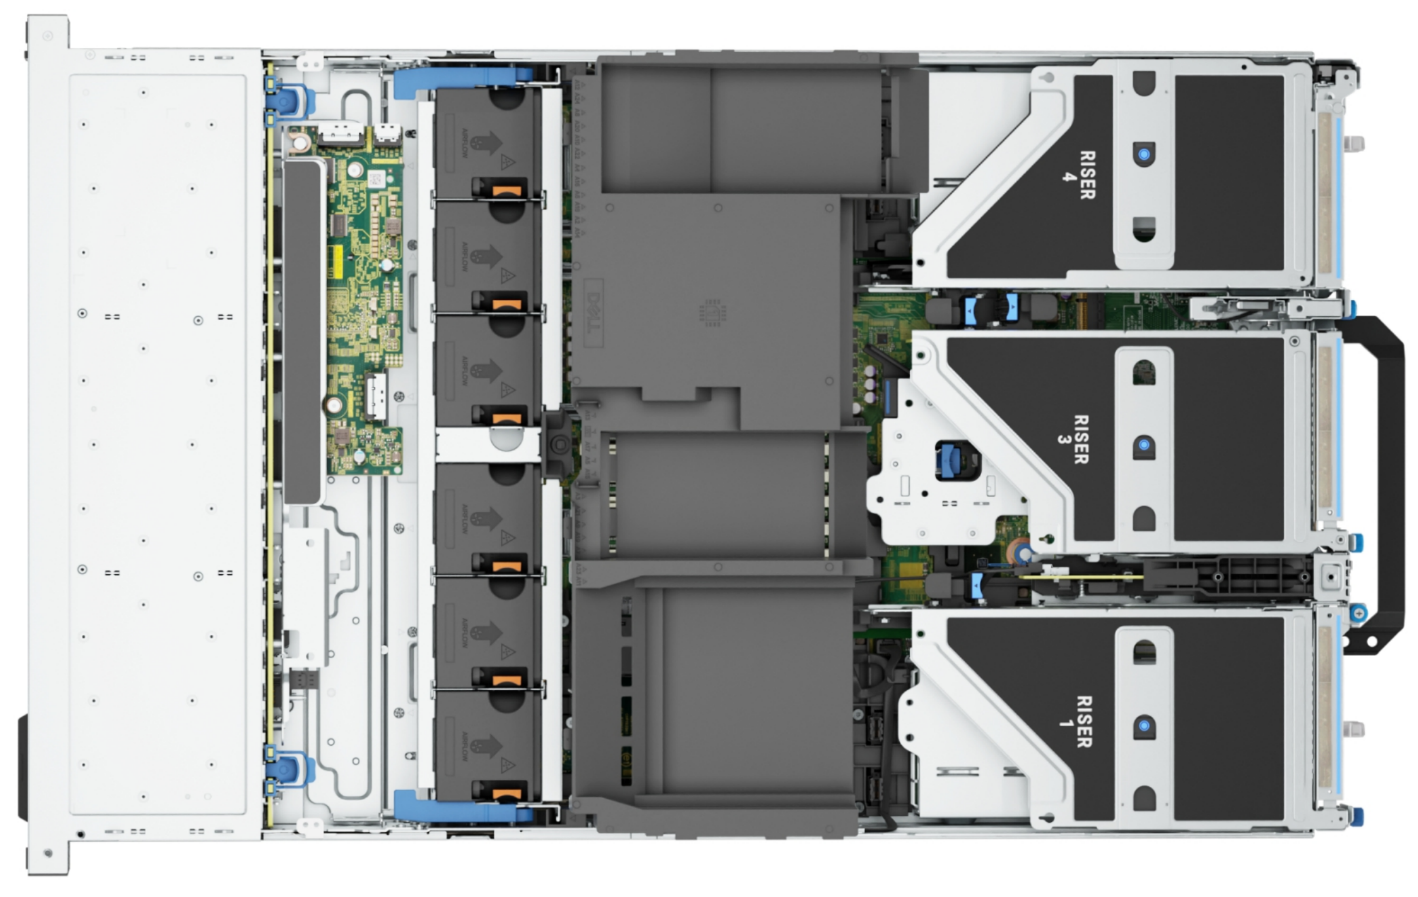
Figure 4: Top view of the Dell PowerEdge R7615 server
Dell PowerEdge R750xa server
The PowerEdge R750xa server is a perfect blend of technological prowess and innovation. This server is equipped with Intel Xeon Gold processors and the latest NVIDIA GPUs. The PowerEdge R760xa server is designed for the most demanding AI, ML, and DL workloads as it is compatible with the latest NVIDIA TensorRT engine and CUDA version. With up to nine PCIe Gen4 slots and availability in a 1U or 2U configuration, the PowerEdge R750xa server is an excellent option for any demanding workload.
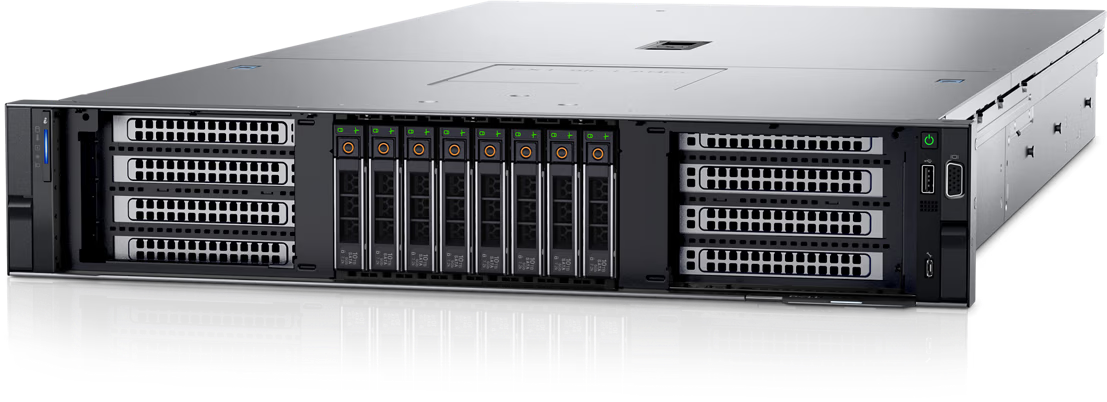
Figure 5: Front view of the Dell PowerEdge R750xa server
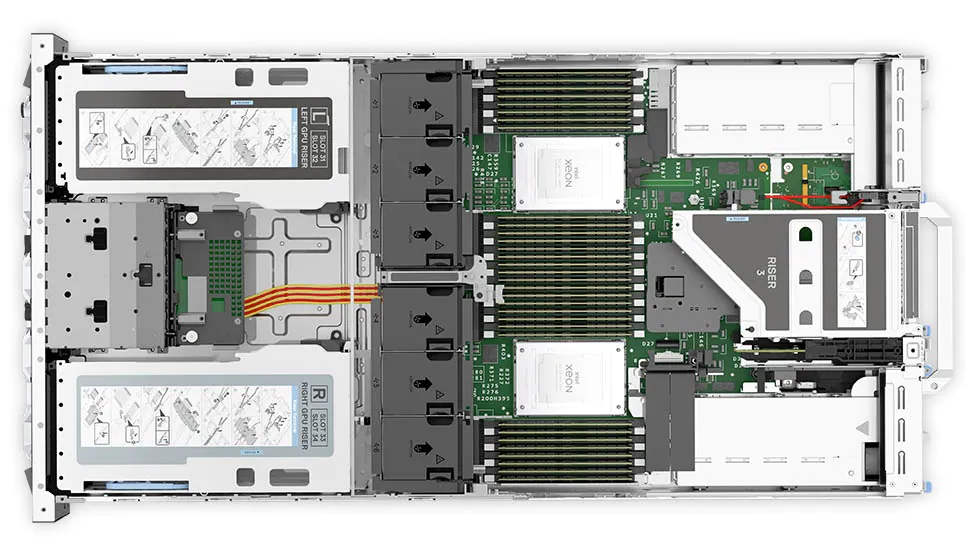
Figure 6: Top view of the Dell PowerEdge R750xa server
Performance results
Classical Deep Learning models performance
The following figure presents the results as a ratio of normalized numbers over the Dell PowerEdge R750xa server with four NVIDIA A100 GPUs. This result provides an easy-to-read comparison of three systems and several benchmarks.
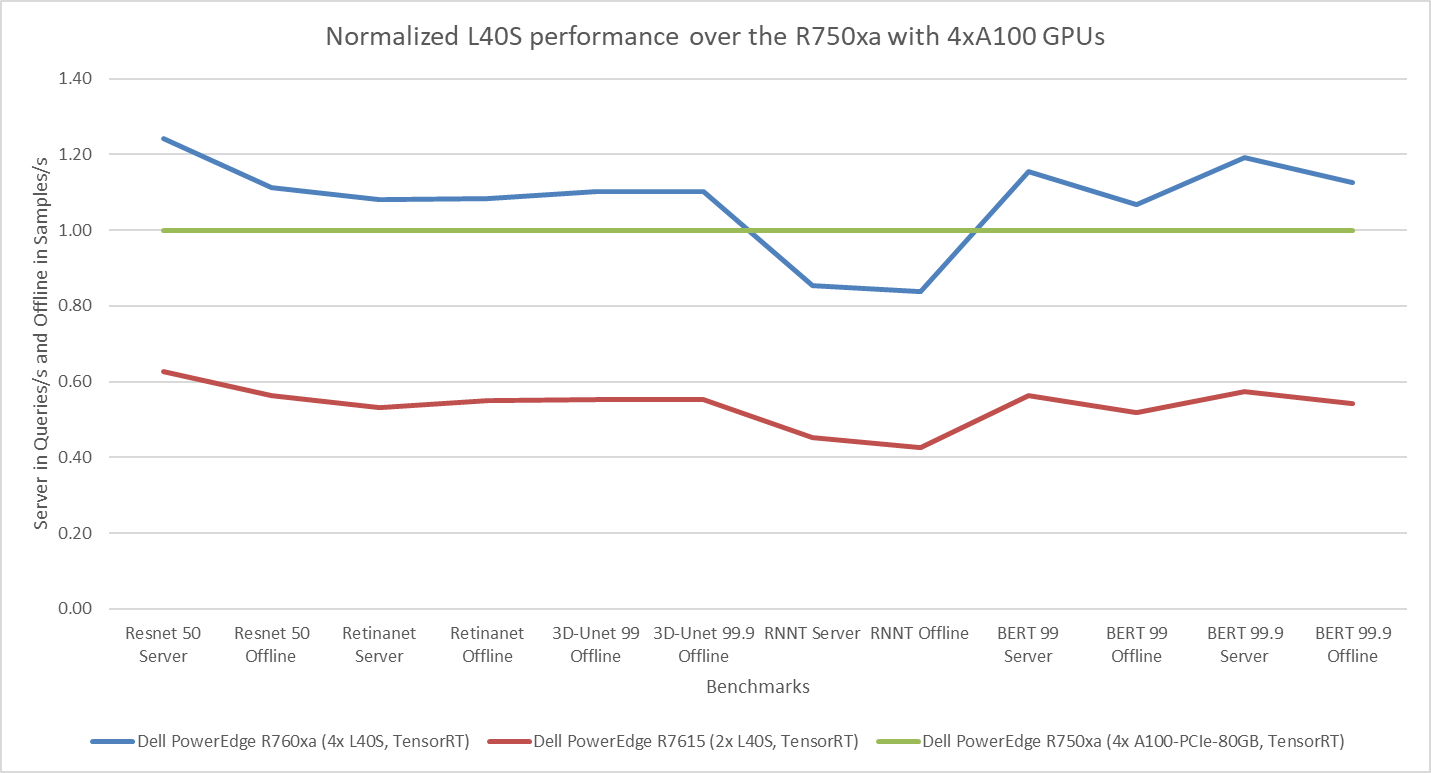
Figure 7: Normalized NVIDIA L40S GPU performance over the PowerEdge R750xa server with four A100 GPUs
The green trendline represents the performance of the Dell PowerEdge R750xa server with four NVIDIA A100 GPUs. With a score of 1.00 for each benchmark value, the results have been divided by themselves to serve as the baseline in green for this comparison. The blue trendline represents the performance of the PowerEdge R760xa server with four NVIDIA L40S GPUs that has been normalized by dividing each benchmark result by the corresponding score achieved by the PowerEdge R750xa server. In most cases, the performance achieved on the PowerEdge R760xa server outshines the results of the PowerEdge R750xa server with NVIDIA A100 GPUs, proving the expected improvements from the NVIDIA L40S GPU. The red trendline has also been normalized over the PowerEdge R750xa server and represents the performance of the PowerEdge R7615 server with two NVIDIA L40S GPUs. It is interesting that the red line almost mimics the blue line. This result suggests that the PowerEdge R7615 server, despite having half the compute resources, still performs comparably well in most cases, showing its efficiency.
Generative AI performance
The latest submission saw the introduction of the new Stable Diffusion XL benchmark. In the context of generative AI, stable diffusion is a text to image model that generates coherent image samples. This result is achieved gradually by refining and spreading out information throughout the generation process. Consider the example of dropping food coloring into a large bucket of water. Initially, only a small, concentrated portion of the water turns color, but gradually the coloring is evenly distributed in the bucket.
The following table shows the excellent performance of the PowerEdge R760xa server with the powerful NVIDIA L40S GPU for the GPT-J and Stable Diffusion XL benchmarks. The PowerEdge R760xa takes the top spot in GPT-J and Stable Diffusion XL when compared to other NVIDIA L40S results.
Table 3: Benchmark results for the PowerEdge R760xa server with the NVIDIA L40S GPU
Benchmark | Dell PowerEdge R760xa L40S result (Server in Queries/s and Offline in Samples/s) | Dell’s % gain to the next best non-Dell results (%) |
Stable Diffusion XL Server | 0.65 | 5.24 |
Stable Diffusion XL Offline | 0.67 | 2.28 |
GPT-J 99 Server | 12.75 | 4.33 |
GPT-J 99 Offline | 12.61 | 1.88 |
GPT-J 99.9 Server | 12.75 | 4.33 |
GPT-J 99.9 Offline | 12.61 | 1.88 |
Conclusion
The MLPerf Inference submissions elicit insightful like-to-like comparisons. This blog highlights the impressive performance of the NVIDIA L40S GPU in the Dell PowerEdge R760xa and PowerEdge R7615 servers. Both servers performed well when compared to the performance of the Dell PowerEdge R750xa server with the NVIDIA A100 GPU. The outstanding performance improvements in the NVIDIA L40S GPU coupled with the Dell PowerEdge server position Dell customers to succeed in AI workloads. With the advent of the GPT-J and Stable diffusion XL Models, the Dell PowerEdge server is well positioned to handle Generative AI workloads.