

Inference Results Comparison of Dell Technologies Submissions for MLPerf™ v1.0 and MLPerf™ v1.1
Wed, 17 Nov 2021 20:43:29 -0000
|Read Time: 0 minutes
Abstract
The Dell Technologies HPC & AI Innovation Lab recently submitted results to the MLPerf Inference v1.1 benchmark suite. These results provide our customers with transparent information about the performance of Dell EMC servers. This blog highlights the enhancements between the MLPerf™ Inference v1.0 and MLPerf Inference v1.1 submissions from Dell Technologies. These enhancements include improved GPU performance and new software to extract performance. Also, this blog compares server and GPU configurations from the MLPerf Inference v1.0 and v1.1 submissions.
Configuration comparison
The MLPerf Inference submissions focus was on outperforming the expectations outlined by MLPerf. For an introduction to the MLPerf Inference v1.0 performance results, we recommend that you read this blog published by Dell Technologies.
The following table provides the software stack configurations from the two submissions for the closed division benchmarks:
Table 1: MLPerf Inference v1.0 and v1.1 software stacks
| v1.0 | v1.1 |
TensorRT | 7.2.3 | 8.0.2 |
CUDA | 11.1 | 11.3 |
cuDNN | 8.1.1 | 8.2.1 |
GPU driver | 460.32.03 | 470.42.01 |
DALI | 0.30.0 | 0.31.0 |
Triton |
| 21.07 |
The following table shows the Dell EMC servers used for the MLPerf Inference v1.0 and v1.1 submissions:
Table 2: Servers used for the MLPerf Inference v1.0 and v1.1 submissions
| v1.0 | v1.1 |
Server | Accelerator | Accelerator |
DSS 8440 | 10 x A100-PCIe-40GB 10 x A40 | 10 x NVIDIA A100-PCIE-80GB 8 x A30 (TensorRT) 8 x A30 (Triton) |
PowerEdge R7525 | 3 x Quadro RTX 8000 2 x A100-PCIe-40GB 3 x A100-PCIe-40GB | 3 x A100-PCIE-40GB 3 x A30 3 x GRID A100-40C |
PowerEdge R740 | 3 x NVIDIA A100-PCIe-40GB 4 x A100-PCIe-40GB |
|
PowerEdge R750 |
| ICX-6330(2S 28C) ICX-8352M(2S 32C) |
PowerEdge R750xa |
| 4 x A100-PCIE-40GB, MaxQ 4 x A100-PCIE-80GB-MIG-7x1g.10gb 4 x A100-PCIE-80GB (TensorRT) 4 x A100-PCIE-80GB (Triton) |
PowerEdge XE2420 | 4 x T4 | 2 x A10 |
PowerEdge XE8545 | 4 x A100-SXM-40GB 4 x A100-SXM-80GB | 4 x A100-SXM-80GB-7x1g.10gb 4 x A100-SXM-80GB (TensorRT) 4 x A100-SXM-80GB (Triton) |
PowerEdge XR12 |
| 2 x A10 |
Besides the upgrades in the software stack that are detailed in the preceding table and the results from the latest hardware, differences between the MLPerf Inference v1.0 and v1.1 submissions include:
- The Multistream scenario has been deprecated in MLPerf v1.1.
- The total number of submitters increased from 17 to 21.
- There were 1725 total submissions to MLCommons™ in v1.1.
MLPerf Inference v1.0 compared to MLPerf Inference v1.1
We compared the MLPerf v1.0 and v1.1 submissions by looking at results from an identical server and the same GPU configurations used in both rounds of submission. For both submissions, Dell Technologies submitted results for the Dell EMC PowerEdge XE8545 server configured with four A100 SXM 80 GB GPUs. The PowerEdge XE8545 servers used a combination of the latest AMD CPUs and powerful NVIDIA A100 Tensor Core GPUs. The PowerEdge XE8545 Spec Sheet provides additional details about the server.
The following figure shows nearly level performance across the two submissions, which allows for a fair comparison between the submissions. Also, it shows that we need to be aware of the software upgrades listed in Table 1, no matter how minimal.
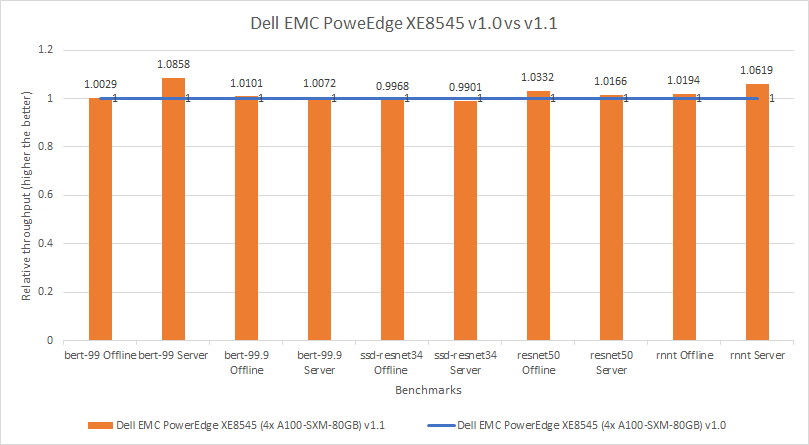
Figure 1: Relative performance comparison of PowerEdge XE8545 4 x A100 SXM 80 GB in MLPerf v1.0 and v1.1
Dell EMC systems improvements for MLPerf Inference v1.1
This section provides detailed comparisons of various GPUs across the MLPerf Inference v1.0 and v1.1 submissions to show an expansion of Dell EMC server and GPU configurations that are available.
A100 40 GB GPU compared with A100 80 GB GPU
Dell EMC DSS 8440 server
The Dell EMC DSS 8440 server delivers high performance at a lower cost compared to our competitors. By offering support for four, eight, or 10 GPUs, this server excels in processing capacity along with a flexible infrastructure. The DSS 8440 server delivers high performance for machine learning workloads. The DSS 8440 Spec Sheet provides more details about the server.
The following figure compares two DSS 8440 servers configured with NVIDIA A100 Tensor Core GPUs. For the v1.0 submission, the DSS 8440 server was configured with the A100 40 GB GPU (shown in blue). For the v1.1 submission, the DSS 8440 server was configured with the A100 80 GB GPU (shown in orange). Across the different models, the performance improvement was between three percent to 20 percent, favoring the system with the A100 80 GB GPU. The more than 10 percent performance improvement can be attributed to the frequency of each card; the A100 80 GB GPU is a 300W card whereas the A100 40 GB GPU is 250W card.
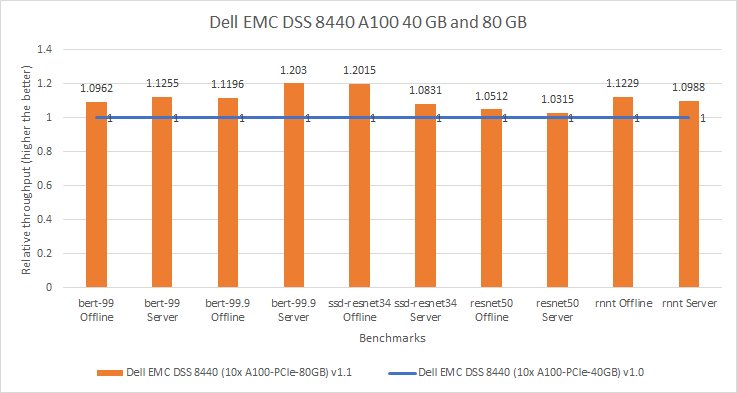
Figure 2: Relative performance comparison of DSS 8440 10 x A100 PCIe 40 GB and 80 GB in MLPerf v1.0 and v1.1
Dell EMC PowerEdge R750xa server
The PowerEdge R750xa server is ideal for Artificial Intelligence (AI)/Machine Learning (ML)/Deep Learning (DL) training and inferencing, high performance computing, and virtualization. See the Dell EMC PowerEdge R750xa Spec Sheet for more information about the server.
For this comparison, the server for both submissions was consistent. For the MLPerf v1.0 submission, the PowerEdge R750xa server was configured with four A100 40 GB GPUs. For the MLPerf v1.1 submission, the PowerEdge R750xa server was configured with four A100 80 GB GPUs. The following figure shows that for the MLPerf v1.1 submission, extra performance was extracted from the system. Across the various models, the MLPerf v1.1 results are seven percent to 22 percent better than the results from the MLPerf v1.0 submission. In the Resnet50 benchmark, the MLPerf v1.1 results are an impressive 15 and 19 percent better in the Offline and Server scenarios respectively.
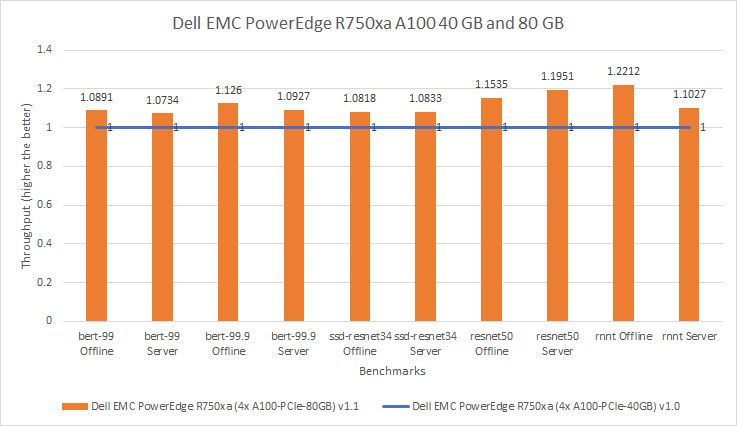
Figure 3: Relative performance of PowerEdge R750xa 4 x A100 40 GB GPU and 80 GB in MLPerf v1.0 and v1.1 respectively
Dell EMC PowerEdge XE8545 server
For the MLPerf v1.0 submission, the PowerEdge XE8545 server was configured with the A100 SXM4 40 GB GPU (shown in blue in figures 4 and 5) and the A100 SXM4 80 GB GPU (shown in orange in figures 4 and 5). For the MLPerf v1.1 submission, the PowerEdge XE 8545 server was configured with the A100 SXM4 80 GB GPU (shown in gray in figures 4 and 5). It was expected that for the MLPerf v1.0 submission, the A100 SXM4 80 GB GPU would outperform the A100 SXM4 40 GB GPU. Across the models in the MLPerf v1.1 submission, the A100 SXM4 80 GB GPU performed between negative one percent (a negative value indicates a performance deficit, noted for SSD ResNet34 in Figure 5) and eight percent better than the identical system in the MLPerf v1.0 submission. Interestingly, for the SSD Resnet-34 benchmark, the A100 GPU in the MLPerf v1.0 submission slightly outperformed the A100 GPU in the MLPerf v1.1 submission.
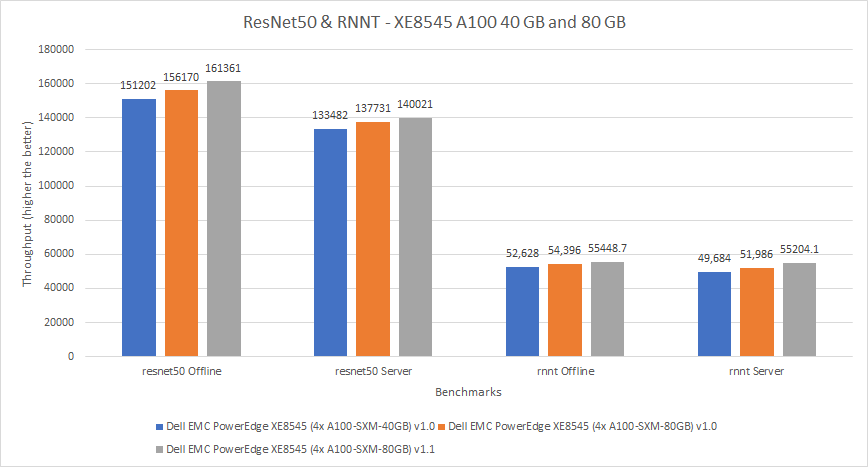
Figure 4: Performance of PowerEdge XE8545 4 x A100 40 GB and 80 GB in MLPerf v1.0 and 80 GB in MLPerf v1.1 for ResNet50 and RNNT
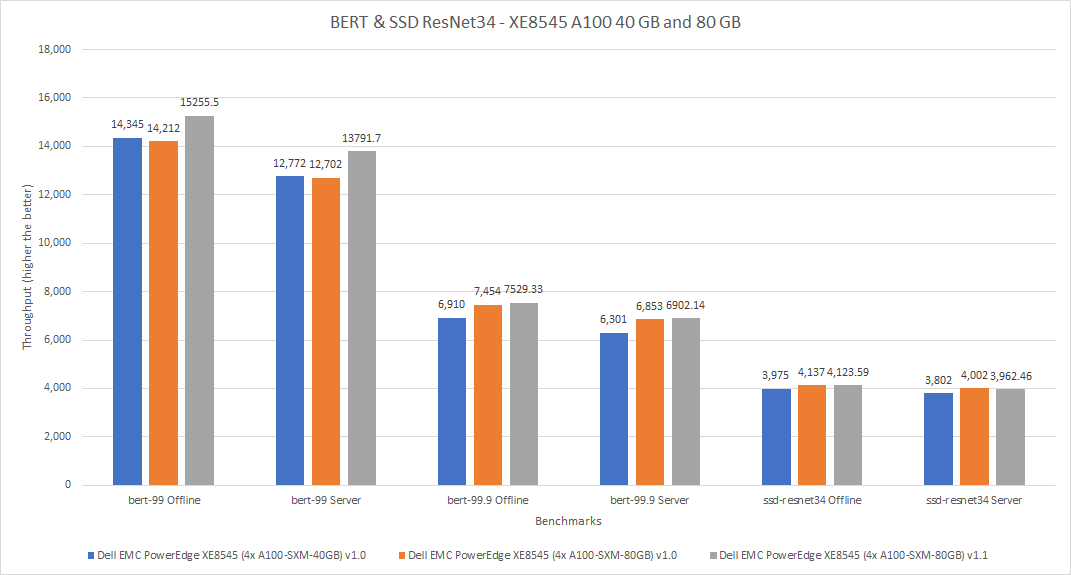
Figure 5: Performance of PowerEdge XE8545 4 x A100 40 GB and 80 GB in MLPerf v1.0 and 80 GB in MLPerf v1.1 for BERT and SSD ResNet34
NVIDIA A30 GPU compared with NVIDIA A40 GPU
This comparison considers the NVIDIA A40 and NVIDIA A30 Tensor Core GPU. For a fair comparison between the two GPUs, the DSS 8440 server configuration was consistent across the two submissions. For the MLPerf v1.0 submission, the DSS 8440 server was configured with ten A40 GPUs. For the MLPerf v1.1 submission, the server was configured with eight A30 GPUs. For a clear interpretation of the two GPUs, the results in Figure 6 are presented as the per card performance numbers, which means that the throughput results from the A40 GPU have been divided by ten and the results from the A30 GPU have been divided by eight.
The system configured with the A30 GPU performed 15 to 111 percent better than the A40 GPU across the various benchmarks. The A30 GPU is ideal for inference as it is configured with a High Bandwidth Memory (HBM2) and a higher GPU frequency. The A40 GPU is positioned more for Virtual Desktop Infrastructure (VDI) and other workloads.
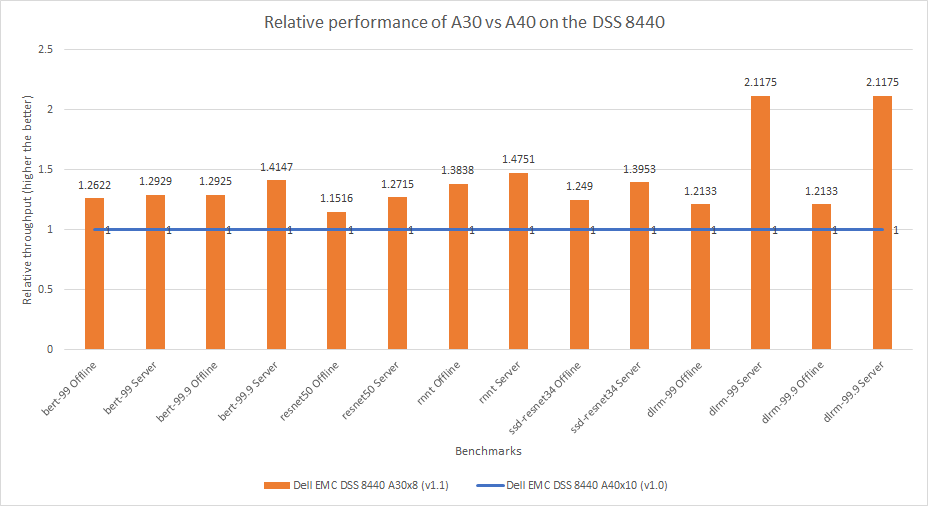
Figure 6: Per card relative performance comparison of the DSS 8440 server with A30 and A40 GPUs in MLPerf v1.0 and v1.1
Comparison of NVIDIA T4, A30, and A10 GPUs
This comparison considers three submissions on three different servers. The numbers are divided to display per card performance.
The Dell EMC PowerEdge XE2420 server is a specialty edge server that supports demanding applications at the edge, retail applications and analytics, manufacturing and logistics applications, and 5G cell processing. See the PowerEdge XE2420 Spec Sheet for more information. Our lab configured the system with four NVIDIA Tesla T4 GPUs that have been optimized for high utilization while also performing in an energy-efficient manner. The results from this system were published in the MLPerf Inference v1.0 Results.
The second server in this comparison is the DSS 8440 server, which was configured with eight NVIDIA A30 GPUs. The final server in this comparison is the PowerEdge XE2420 server, which was configured with two NVIDIA A10 GPUs.
The three cards in this comparison have different form factors; the A10 and A30 GPUs are larger than the T4 GPU. The following figure shows that the A30 GPU performed better than the other two GPUs. Across the various benchmarks, the A30 GPU performed between 204 and 360 percent better than the T4 GPU and between five percent and 57 percent better than the A10 GPU.
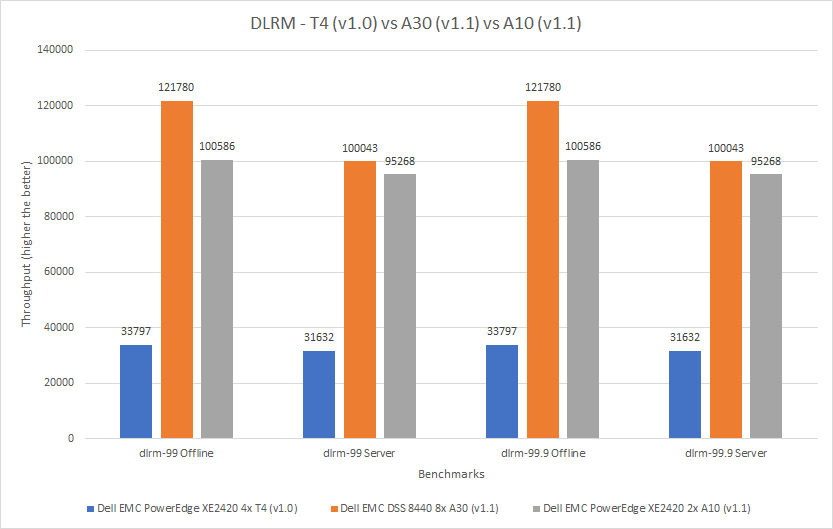
Figure 7: Comparison of T4, A30, and A10 GPUs for DLRM
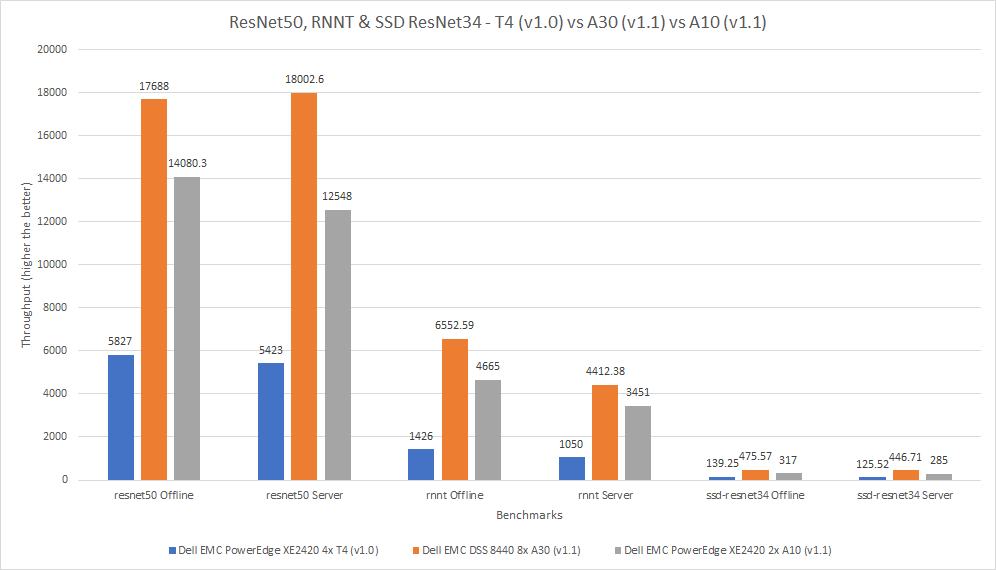
Figure 8: Comparison of T4, A40, and A10 GPUs for ResNet50, RNNT, and SSD ResNet34
Comparison of NVIDIA T4 GPU, A30 Multi-Instance GPU (MIG), and A100 MIG
This comparison also considers three submissions on three different servers. The results from the Resnet50 and SSD Resnet34 benchmarks have been divided to display per card performance.
The PowerEdge XE2420 server was configured with four NVIDIA Tesla T4 GPUs. The results for this system are from the MLPerf v1.0 submission. The PowerEdge R7525 server was configured with three NVIDIA A30 GPUs. MIG was enabled on all these GPUs with a profile of 1g6gb. We did not publish the A30 MIG results on the PowerEdge R7525 server to MLCommons, but the results are compliant.
The PowerEdge R750xa server was configured with four NVIDIA A100 80 GB GPUs, which support Multi-Instance GPU (MIG) and Peripheral Component Interconnect Express (PCIe). MIG is an enhancement for NVIDIA GPUs with the Ampere architecture that allows for seven secure partitions of GPU instances. This architecture is beneficial because it allows for increased parallelism. The results from this system were submitted in the MLPerf Inference v1.1 submission. There are different sizes of MIG slices. The configuration for the A30 and A100 GPUs used the smallest slice possible. For example, the A100 GPU was divided into seven slices and the A30 GPU into four slices.
The following figures show results across the MLPerf v1.0 and v1.1 submissions from Dell Technologies for ResNet50 and SSD ResNet34. Figure 9 shows per physical GPU results. For the ResNet50 Offline benchmark, the A30 GPU performed 232 percent better than the T4 GPU, while the A100 GPU performed 76 percent better than the A30 GPU. In the ResNet 50 Server mode, the A30 GPU outperformed the T4 GPU by 50 percent and the A100 GPU outperformed the A30 GPU by 23 percent. We observed a similar trend across the Offline and Server modes where the A100 GPU outperformed the A30 GPU, which outperformed the T4 GPU.
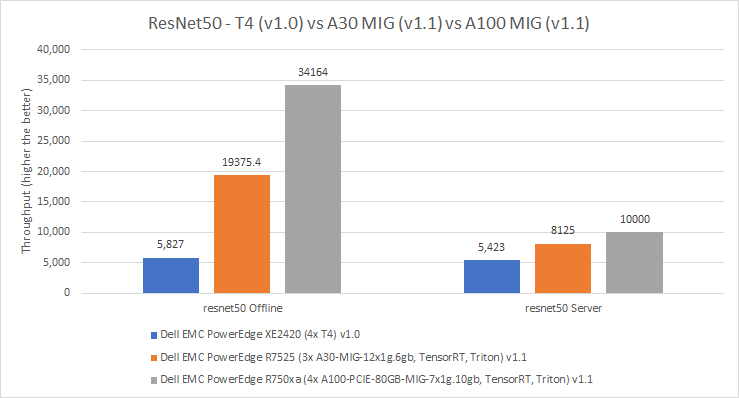
Figure 9: Per card performance of the T4 GPU, A30 MIG, and A100 MIG for ResNet50
In the SSD ResNet34 benchmark, we observed a similar trend where the performance of the A100 GPU was better than the performance of the A30 GPU, which performed better than the T4 GPU. In the Offline mode of the SSD ResNet34 benchmark, the A30 GPU performed 243 percent better than the T4 GPU, and the A100 GPU performed 77 percent better than the A30 GPU. In the Server mode, the A100 GPU outperformed the A30 GPU by 93 percent and the A30 GPU performed 198 percent better than the T4 GPU.
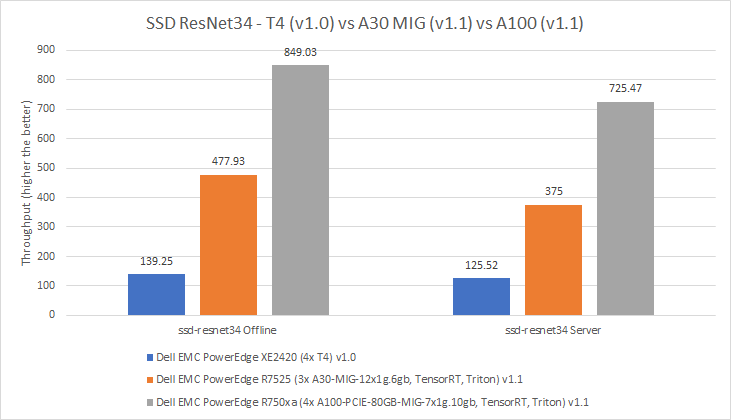
Figure 10: Per card performance of the T4 GPU, A30 MIG, and A100 MIG for SSD ResNet34
Conclusion
This blog has provided a brief introduction to MLPerf Inference benchmarking and a summary of the Dell Technologies submission from MLPerf Inference v1.0. Also, it highlighted the differences in the software stack between the MLPerf v1.0 and v1.1 submissions. This blog quantified results from various server and GPU configurations across the two rounds of MLPerf submissions and displayed noteworthy and relevant performance comparisons.
When comparing the A100 40 GB to the A100 80 GB GPUs on the Dell EMC DSS 8440 server, the latter exhibited an 11 percent increase in performance. On the Dell EMC PowerEdge R750xa server, the A100 PCIe 80 GB GPU performed 12 percent better than the A100 PCIe 40 GB GPU. The Dell EMC PowerEdge XE8545 server confirmed this result for the MLPerf v1.1 submission; the A100 SXM 80 GB GPU performed three percent better than an identical system from the MLPerf v1.0 submission.
The A30 and A40 GPU comparison showed that the former achieved a notable 42 percent performance improvement while maintaining the Dell EMC DSS 8440 server.
The comparison between the T4, A30, and A10 GPUs revealed that the A30 GPU performed significantly better than the T4 GPU and is considered a good upgrade for your ML workloads. The T4 GPU, A30 MIG, and A100 MIG were compared based on results from the ResNet50 and SSD-ResNet34 benchmarks.


