


Enabling Efficient LLM Inferencing: Power Capping Strategies for PowerEdge XE9680
Download PDFThu, 27 Jun 2024 19:30:04 -0000
|Read Time: 0 minutes
Summary
As the power demand of high-performance GPU servers like the Dell PowerEdge XE9680 continues to rise, customers are increasingly seeking to balance their performance requirements with data center power constraints. One effective solution is power capping the GPUs. This approach not only helps achieve high performance within the server's unique power envelope, but also holds the potential for significant cost savings.
The latest release of the MLPerf™ inference v4.0 benchmark from MLCommons™ includes the Meta Llama-2 70B Chat model to represent large language model (LLM) performance on the Dell PowerEdge XE9680. As a key member of the MLPerf™ consortium since version 0.7, Dell Technologies brings its extensive expertise to bear. We have valuable insights on power-capping NVIDIA H100 GPUs in the Dell PowerEdge XE9680 to achieve the best performance at different power values using the latest MLPerf™ benchmarks. In this paper, we explore how power capping affects the performance per watt of the Dell PowerEdge XE9680 server with NVIDIA H100 GPUs.
Introduction
This paper highlights the performance of the XE9680 with different GPU power limit values and shows the best performance you can achieve with various iDRAC settings and GPU power cap values. This is to empower our customers to control their power expenditure, potentially saving costs and reducing power usage for certain temporary cases where power reduction is necessary as well as modifying old data centers to increase power capacity. The paper covers the verified performance numbers submitted for MLPerf™ inference v4.0 and the unverified performance numbers with different power-limit values.
PowerEdge XE9680
The PowerEdge XE9680 server—Dell Technologies’ latest two-socket, 6U air-cooled rack server—is designed with the training and inference of the most demanding machine learning (ML) and deep learning (DL) large models in mind. Its adaptability and performance under different power settings make it a reliable choice for customers balancing performance requirements with data center power constraints.
Key system features include:
- Two 4th Gen Intel® Xeon® Scalable Processors
- Up to 32 DDR5 DIMM slots
- Eight NVIDIA HGX H100-SXM-80GB GPUs or eight NVIDIA HGX A100-SXM-80GB
- 10 PCIe Gen5 slots to support the latest Gen5 PCIe devices and networking, enabling flexible networking design
- Up to eight U.2 NVMe drives (PSB direct) or up to 16 E3.S NVMe drives (PSB direct)
- Designed to train and run inference on demanding ML and DL large models and run compute-intensive HPC workloads

Figure 1: NVIDIA H100 SXM GPU
Figure 2: PowerEdge XE9680
The detailed PowerEdge XE9680 configuration used for the testing discussed in this paper can be found here.
Table 1: Server configuration
Server | 1x PowerEdge XE9680 |
Accelerators | 8x NVIDIA H100-SXM-80GB |
CPUs | 2x Intel® Xeon® Platinum 8470 |
Memory | 32x 64GB DDR5 |
Framework | TensorRT 9.3, CUDA 12.2 |
Llama 2 model for inference
Llama 2 represents a significant advancement in large-scale language modeling. Developed by Meta AI and released in 2023, Llama 2 is a family of pre-trained and fine-tuned large language models (LLMs). These models are available for research and commercial use, catering to various natural language processing (NLP) tasks. Llama 2 Chat models come in multiple sizes—ranging from 7 billion to 70 billion parameters—allowing flexibility based on computing capabilities and specific applications. Llama 2 includes specialized fine-tuned chat models optimized for dialogue use cases—known as Llama-2-Chat—with improved scale, efficiency, and performance. Please refer to mlcommons.org for details on the Llama 2 integration with MLPerf™.
Performance testing
Now, let’s look at our test configurations and test results. First, we changed the PowerEdge XE9680 iDRAC firmware parameters to those submitted in Table 1, then ran the MLPerf™ Llama 2 70B benchmark while collecting average power data. We then calculated efficiency by dividing the MLPerf™ performance results by the average server power.
Note: The Resources section at the end of this paper details each firmware setting and how to change them.
Specific firmware changes benchmarked are documented in Table 2.
The test configurations marked as “Unverified” were not verified by the MLCommons™ Association. MLCommons™-verified means an MLPerf™ benchmark was used to obtain a result for our product or service. We submitted our results for MLCommons™ review through which the results were verified. MLCommons™-unverified means our results have not gone through MLCommons™ review and therefore have not been verified by MLCommons™, even though they use the same code.
Note: DAPC stands for Dell Active Power Controller.
Table 2: Configuration permutations
Config | System profile (iDRAC) | Thermal profile optimization (iDRAC) | GPU power limit watts (OS) | MLCommons™ verification |
1 | Performance Per Watt (DAPC) | Default (Minimum Power) | 500, 600, 700 | Unverified |
2 | Performance | Maximum Performance | 450, 500, 600, 700 | Unverified |
3 | Performance | Minimum Power | 450, 500, 600, 700 | Unverified |
4 | Performance Per Watt (DAPC) | Default (Minimum Power) | 450 | Verified |
*GPU Power limit was applied to all 8 GPUs
*GPUDirect flag set to True for all scenarios
“Result not verified by MLCommons Association.”
Figure 3 illustrates the GPU efficiency numbers of the different inference scenarios we ran on the XE9680 by changing iDRAC settings. Following are the three settings:
- System Profile set to Perf per watt (DAPC) and Thermal Profile set to default.
Note: Config 4 is identical to Config 1 with the exception of GPU Power. Hereafter, it will be referred to as Config 1.
2. System Profile set to Performance and Thermal Profile set to Maximum Performance.
3. System Profile set to Performance and Thermal Profile set to Minimum Power.
Efficiency, in this context, means the showing the best performance and using the least power. In other words, this shows maximum performance (tokens per second) per 1 W of system power.
Table 3: Efficiency results
| GPU Power limit (W) | |||
| 450 W | 500 W | 600 W | 700 W |
Config 1 | 3.005 | 2.960 | 2.776 | 2.530 |
Config 2 | 3.000 | 2.902 | 2.667 | 2.407 |
Config 3 | 2.838 | 2.771 | 2.563 | 2.275 |

Figure 3: PowerEdge XE9680 server GPU efficiency matrix on Llama2-70b Datacenter 99.9 Offline scenario [1]
What does efficiency mean in this case?
The GPU Power Limit of 450W for Config 1 which uses the perf per watt (DAPC) profile—highlighted in green in table 4—demonstrates the greatest efficiency and is verified as submitted to MLPerf™ Inference v4.0. The rest of the numbers are unverified and were run internally at the Dell CET AI Engineering lab post submission using the published code. However, they show how the system efficiency (perf/watt) changes with different XE9680 settings.
Again, efficient, in this context, means the showing the best performance and using the least power. In other words, this shows maximum performance (tokens per second) per 1 W of system power.
Table 4: Efficiency as percentage
GPU Power Limit | 450 W | 500 W | 600 W | 700 W |
Config 1 | 100% | 98.5% | 92.38% | 84.20% |
Config 2 | 99.85% | 96.58% | 88.76% | 80.11% |
Config 3 | 94.46% | 92.22% | 85.30% | 75.72% |
When compared in percentage with 3.005, which was our highest efficiency number and the verified submission, we get 84.2 % when we raise GPU Power to the TDP of 700W in the settings. Compared to 700W maximum performance (Config 2) and minimum power (Config 3) iDRAC Thermal Profile, we get 80.11% and 75.72%. However, the most efficient setting would not be realistic for an actual data center deployment. If you want to save power without handicapping the H100 performance, the most efficient is Config 1—perf per watt (DAPC) and default thermal profile.
Now, let’s look at the system’s actual performance and how it affects the system’s performance while saving a notable amount of power.

Figure 4: GPU Power Limit vs Normalized System Power(W) and Throughput (Tokens per second) in percentage on Llama2-70b Datacenter 99.9 Offline scenario with Perf per watt (DAPC) [1]
Figure 4 shows the performance numbers of the Llama2-70b Offline scenario for inferencing in throughput counted in tokens per second compared with average system power with different GPU power limits. For ease of comparison, both parameters are in percentages. This is Config 1 in Tables 2 through 4. The system profile is set to performance per watt optimized (DAPC) for XE9680. This shows, on average, a system power savings up to 32% with a 20% drop in performance. When your power limit is 600W per GPU, that saves 15% in system power with only a 6% performance drop. Note that these numbers are only for one node, so notably power savings scale as nodes do.
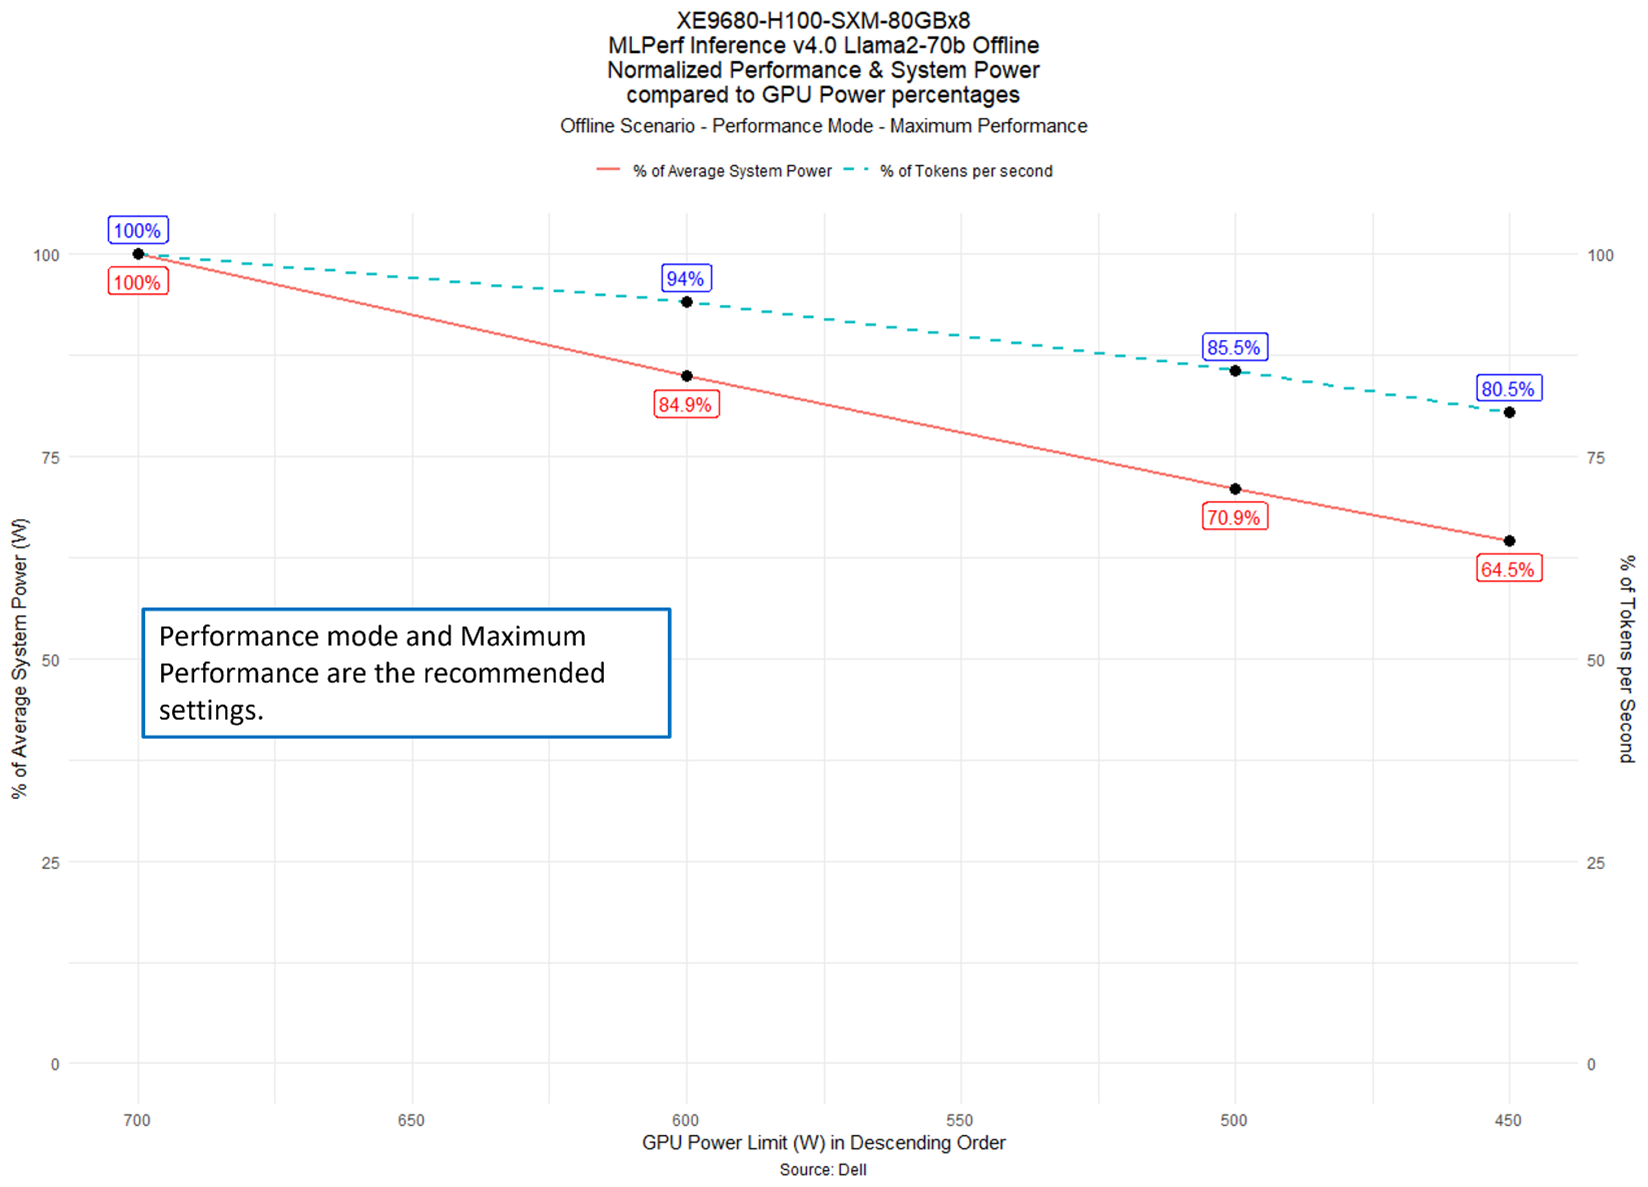
Figure 5: GPU Power Limit vs Normalized System Power(W) and Throughput (Tokens per second) in percentage on Llama2-70b Datacenter 99.9 Offline scenario with Performance – Maximum Performance [1]
In Figure 5, the Llama2-70b Offline scenario shows the iDRAC System Profile set to Performance and Thermal Setting set to Maximum Performance. The performance numbers for Config 2 are slightly smaller than the performance numbers in Config 1 as shown in Table 3. However, this may not be true for different models and is likely due to run-to-run variation given that the MLPerf™ inference is a single 10-minute run. DAPC enables CPU C-States, meaning activities where GPUDirect is not enabled or where CPU cores are relied on heavily could suffer dramatic performance loss in this mode. In other words, the performance may not be equal between DAPC & Performance profiles in other models.
For maximum performance across all possible workloads, we recommend Config 2, which most resembles a real data center deployment. The customer can also profile their workload with the available XE9680 iDRAC settings to see what works best for their deployment.
For Figure 5, the percentage performance vs. power drops is similar to the first chart for one node, even though the overall platform power usage is higher as a result of the maximum performance mode disabling some of the system's power-saving features. The performance numbers (ID 3.1-2019) are submitted to MLPerf™ v4.0 for XE9680 with these settings. Refer to mlcommons.org for the verified numbers.
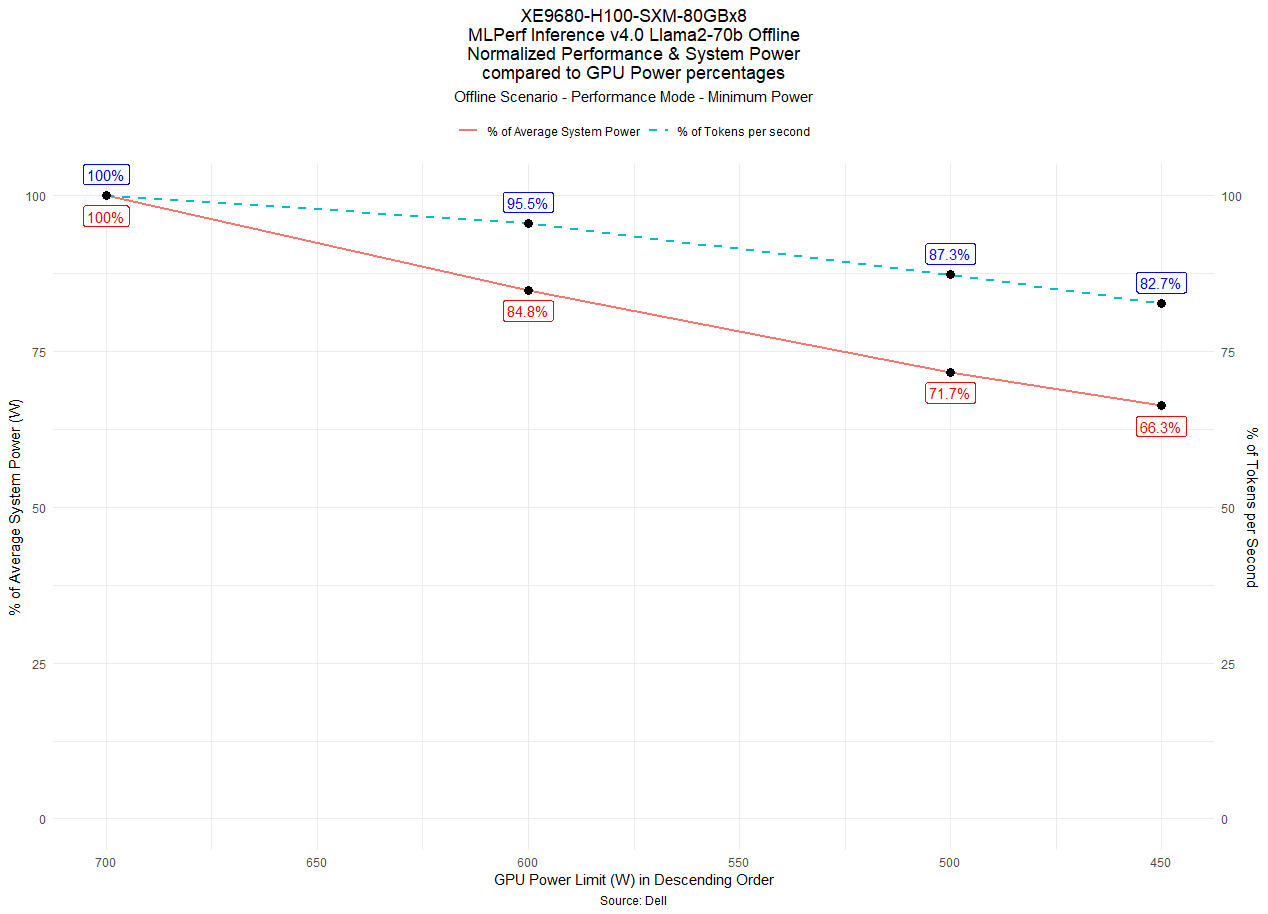
Figure 6: GPU Power Limit vs Normalized System Power(W) and Throughput (Tokens per second) in percentage on Llama2-70b Datacenter 99.9 Offline scenario with Performance – Minimum Power [1]
Figure 6 shows the Llama2-70b Offline scenario illustrating the iDRAC System Profile set to Performance Mode and Thermal Configuration set to Minimum Power. This is Config 3 in Tables 2 through 4. This mode is specifically optimized for the lowest system power consumption and has lower fan speeds at idle and stress loads. The GPUs are still sufficiently cooled, however some transient performance loss is not unusual in this mode due to the time the fans take to spin up. The performance is slightly lower than the other two settings since an inference test is only 10 minutes, and thus transient loss is more obvious. This can also help save energy by keeping the System Profile set to Performance to support most workloads while still reducing some power.
Conclusion
Power efficiency is becoming an increasingly critical design criteria for AI systems as customers are trying to optimize the power consumption of their Gen AI infrastructure. This study demonstrates that the PowerEdge XE9680 can achieve the highest levels of power efficiency and allows customers to fine tune the system for their requirements using the advanced systems management capabilities and proven performance profiles implemented in iDRAC and GPU power capping mechanisms for modern gen AI workloads like Llama 2 models. This empowers our customers to manage power consumption effectively, potentially reducing costs and adapting to specific scenarios where power reduction is crucial.
Resources
This section details how one can configure the firmware parameters discussed in this paper:
- Set System Profile - System Profile - Perf per watt (DAPC) setting
- Set Thermal Profile Optimization - Thermal setting
- Set GPU Power Limit
1. Determine the current, default, and maximum power limit as follows:
nvidia-smi -q | grep 'Power Limit'
2. Ensure that persistence mode is enabled.
3. Set the SW Power Cap limit for all GPUs as follows, where xxx is the desired value in watts:
nvidia-smi -pl xxx
4. This setting is not persistent and will reset after a reboot.
References
[1] Unverified MLPerf® v4.0 Inference Closed Llama2-70b. Result not verified by MLCommons Association.
The MLPerf name and logo are registered and unregistered trademarks of MLCommons Association in the United States and other countries. All rights reserved. Unauthorized use is strictly prohibited. See www.mlcommons.org for more information.