


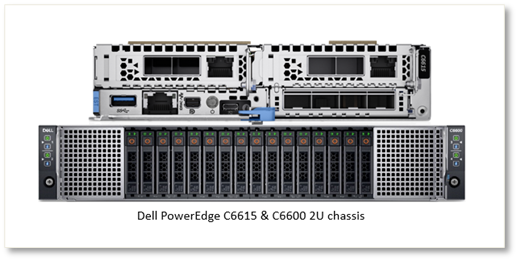
Dell PowerEdge C6615 Performance
Download PDFThu, 04 Apr 2024 16:51:46 -0000
|Read Time: 0 minutes
Dell PowerEdge C6615 Performance
Authors:
David Dam – Principal Engineering Technologist
Kavya Ar – Sr. Systems Development Engineer
Summary
As power and cooling costs continue to occupy a substantial portion of IT budgets, IT departments are placing a strong emphasis on power efficiency to minimize the Total Cost of Ownership (TCO) when selecting server hardware. This paper assesses the power efficiency of the new Dell PowerEdge C6615 server, a model designed in the multi-node, 2U form factor. Due to its adept balance between density and expandability, this form factor is widely used across various edge and telecom use cases.
Test configuration
Server | Processor | CPU Cores | Default TDP | Memory | OS |
PowerEdge C6615 | AMD EPYC 8324P | 32 | 180W | 6 x 64 GB 4800 MT/s | Ubuntu 22.04.2 LTS |
AMD EPYC 8534P | 64 | 200W | 6 x 64 GB 4800 MT/s | Ubuntu 22.04.2 LTS | |
PowerEdge 1S Server | AMD EPYC 9334 | 32 | 240W | 12 x 64 GB 4800 MT/s | Ubuntu 22.04.1 LTS |
AMD EPYC 9534 | 64 | 280W | 12 x 64 GB 4800 MT/s | Ubuntu 22.04.1 LTS |
AMD STREAM
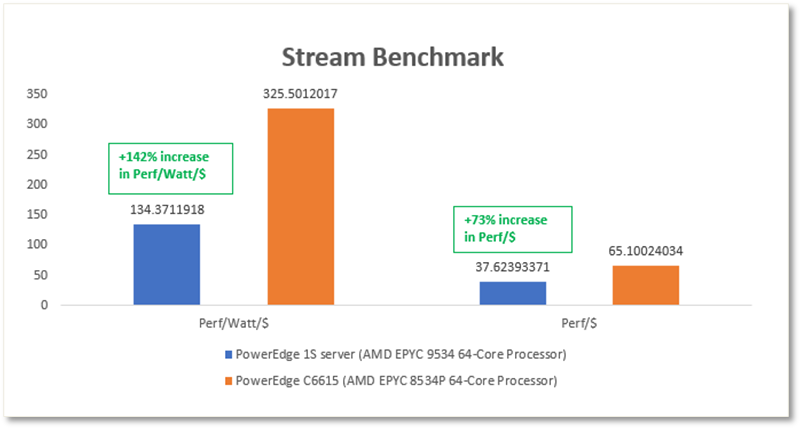
STREAM benchmark is used to calculate the memory bandwidth of a system. The Dell PowerEdge C6615, featuring the AMD EPYC 8534P 64-Core processor, shows a remarkable up to 142% enhancement in performance per watt per dollar. It also boasts an impressive up to 73% increase in performance per CPU dollar when compared to the Dell PowerEdge 1S server equipped with the AMD EPYC 9534P 64-Core processor[1] (Figure 1).
- STREAM results for selected AMD EPYC 64-Core processors
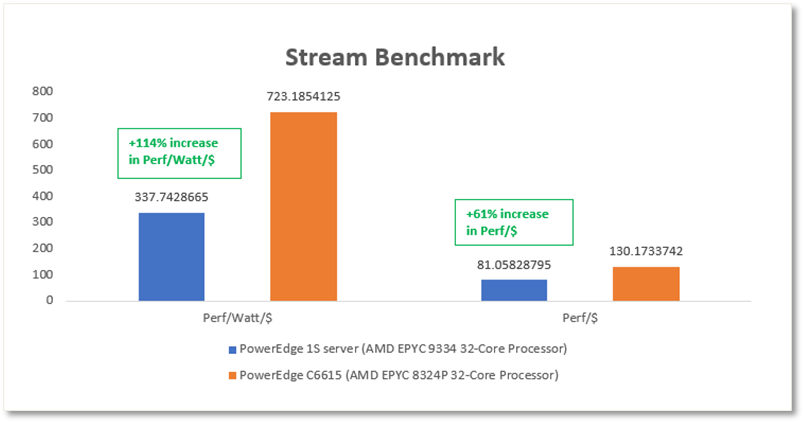
When compared to the Dell PowerEdge 1S server featuring the AMD EPYC 9334 32-Core processor, the test results showed up to a 114% improvement in performance per watt per dollar and up to 61% improvement in performance per CPU dollar[2] (Figure 2).
- STREAM results for selected AMD EPYC 32-Core processors
High-Performance Linpack (HPL)
High-Performance Linpack (HPL) is a benchmark used to measure the floating-point computing performance of a computer system. It is specifically designed to assess a system’s ability to solve a dense system of linear equations. HPL is widely used in the high-performance computing (HPC) industry and is considered a standard benchmark for evaluating supercomputers and clusters.
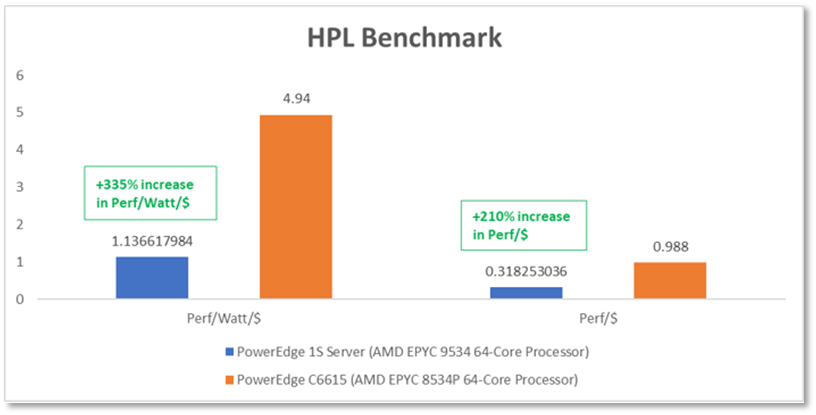
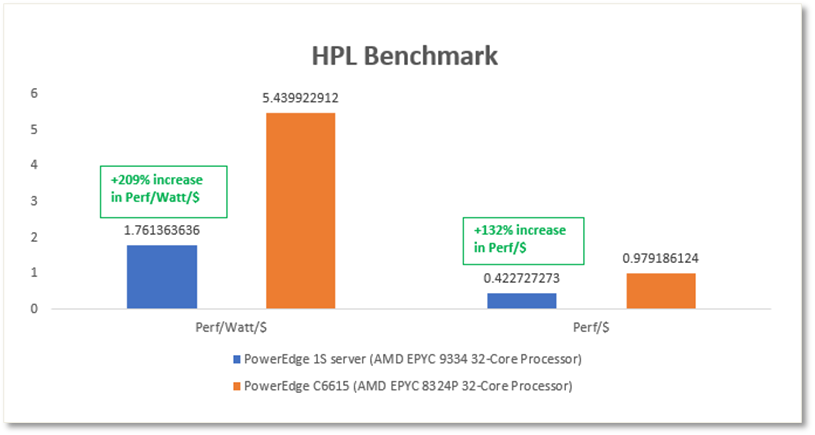
The results have shown outstanding cost-efficiency, revealing a remarkable up to 335% enhancement in performance per watt per dollar, and a substantial 210% increase in performance per CPU dollar when compared to PowerEdge 1S server equipped with the AMD EPYC 9534P 64-Core processor[3] (Figure 3).
- HPL results for selected AMD EPYC 64-Core processors
When compared to a PowerEdge 1S server equipped with the AMD EPYC 9334 32-Core processor, the results highlight exceptional cost-efficiency. It also features an impressive up to 209% improvement in performance per watt per dollar and a substantial 132% increase in performance per CPU dollar[4] (Figure 4).
- HPL results for selected AMD EPYC 32-Core processors
SPEC CPU 2017
The SPEC CPU® 2017 benchmark from the Standard Performance Evaluation Corporation (SPEC®) provides a comparative measure of compute-intensive performance using workloads developed from real user applications. SPEC CPU 2017 is the industry-standardized CPU intensive suite of benchmarks for measuring and comparing compute intensive performance, stressing a system's processor, memory subsystem and compiler. This benchmark is used by hardware vendors, IT industry, computer manufacturers, and government.
The results demonstrate remarkable cost-efficiency, with an impressive up to 281% improvement in performance per watt per dollar, and a substantial 172% increase in performance per CPU dollar when compared to a PowerEdge 1S server equipped with the AMD EPYC 9534P 64-Core processor[5] (Figure 5).
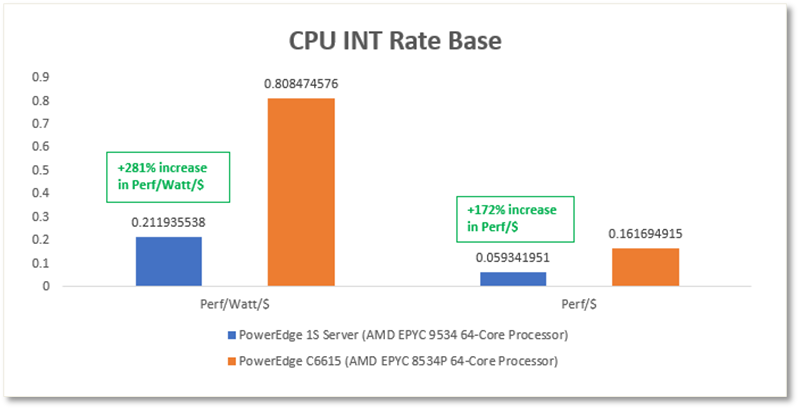
- SPECINTRate results for selected AMD EPYC 64-Core processors
When compared to the Dell PowerEdge 1S server which is equipped with the AMD EPYC 9334 32-Core processor, the test results indicate a significant improvement in cost-efficiency with a remarkable up to 205% increase in performance per watt per dollar, and an impressive up to 128% boost in performance per CPU dollar[6] (Figure 6).
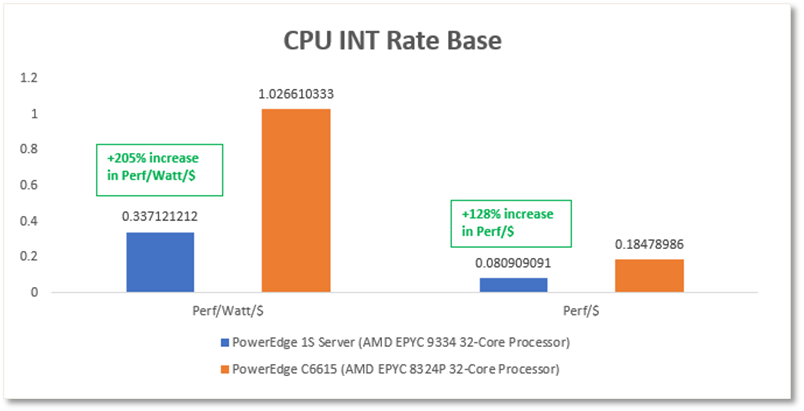
- SPECINTRate results for selected AMD EPYC 32-Core processors
Conclusion
Through various benchmarks and workloads, it is evident that the dense compute-optimized design of Dell PowerEdge C6615, featuring lower cost, lower power AMD EPYC 8004 Series Server Processor, outperforms a similar 1S server equipped with the AMD EPYC 9004 Series Server Processor resulting in higher performance per watt per dollar and enhanced performance per dollar.
References
[1] Based on Dell internal calculations using AMD Stream benchmark achieved on a Dell PowerEdge C6615 and a TDP of 200W with AMD EPYC 8534P 64-Core processors compared to a Dell PowerEdge 1S server and a TDP 280W with AMD EPYC 9534P 64-Core processors. Actual performance will vary.
[2] Based on Dell internal calculations using AMD Stream benchmark achieved on a Dell PowerEdge C6615 and a TDP of 180W with AMD EPYC 8324P 32-Core processors compared to a Dell PowerEdge 1S server and a TDP 240W with AMD EPYC 9334 32-Core processors. Actual performance will vary.
[3] Based on Dell internal calculations using HPL benchmark achieved on a Dell PowerEdge C6615 and a TDP of 200W with AMD EPYC 8534P 64-Core processors compared to a Dell PowerEdge 1S server and a TDP 280W with AMD EPYC 9534P 64-Core processors. Actual performance will vary.
[4] Based on Dell internal calculations using HPL benchmark achieved on a Dell PowerEdge C6615 and a TDP of 180W with AMD EPYC 8324P 32-Core processors compared to a Dell PowerEdge 1S server and a TDP 240W with AMD EPYC 9334 32-Core processors. Actual performance will vary.
[5] Based on Dell analysis of submitted SPEC_CPU2017 score of 477 achieved on a Dell PowerEdge C6615 and a TDP of 200W with AMD EPYC 8534P 64-Core processors compared to a score of 606 on Dell PowerEdge 1S server and a TDP 280W with AMD EPYC 9534P 64-Core processors. Actual performance will vary.
[6] Based on Dell analysis of submitted SPEC_CPU2017 score of 277 achieved on a Dell PowerEdge C6615 and a TDP of 180W with AMD EPYC 8324P 32-Core processors compared to a score of 356 on Dell PowerEdge 1S server and a TDP 240W with AMD EPYC 9334 32-Core processors. Actual performance will vary.
Related Documents

13% Better Performance in Financial Trading with PowerEdge R7615 and AMD EPYC 9374F
Wed, 16 Aug 2023 15:41:36 -0000
|Read Time: 0 minutes
Summary
Dell PowerEdge R7615 with 4th Generation AMD EPYC 9374F provides up to a 13 percent performance gain over Dell PowerEdge R7615 with 4th Generation AMD EPYC 9354P for financial trading benchmarks.[1] This Direct to Development (DfD) document looks at CPU benchmarks for three R7615 32-core based CPU configurations and highlights key features that enable businesses enterprises to host different workloads.
Dell PowerEdge R7615
Dell PowerEdge R7615 is a 2U, single-socket rack server. It is designed to be the best investment per dollar for your data center. This server provides performance, and flexible low-latency storage options in an air or Direct Liquid Cooling (DLC) configuration by using an AMD EPYC 4th generation processor to deliver up to 50% more core count per single socket platform in an innovative air-cooled chassis. It delivers breakthrough innovation for traditional and emerging workloads, including software-defined storage, data analytics, and virtualization, using the latest performance and density.
Figure 1. Side angle of the extremely scalable R7615
4th Generation AMD EPYC processors
PowerEdge R7615 is the latest single socket AMD server supporting 4th Generation AMD EPYC 9004 Series processors, the latest generation of the AMD64 System-on-Chip (SoC) processor family. It is based on the Zen 4 microarchitecture introduced in 2022, supporting up to 128 cores (256 threads) and 12 memory channels per socket, a 50% increase over the previous generation. This series includes three different CPU(s) with 32 cores:
Processor | CPU Cores | Threads | Max. Boost Clock | All core boost speed | Base clock | L3 Cache | Default TDP |
AMD EPYC 9374F | 32 | 64 | Up to 4.3GHz | 4.1GHz | 3.85GHz | 256MB | 320W |
AMD EPYC 9354P | 32 | 64 | Up to 3.8GHz | 3.75GHz | 3.25GHz | 256MB | 280W |
AMD EPYC 9334 | 32 | 64 | Up to 3.9GHz | 3.85GHz | 2.7GHz | 128MB | 210W |
The Base Clock, also known as Base Frequency, refers to the minimum operational clock speed of an AMD processor's cores when running under normal conditions. It serves as the foundational clock speed for the processor's overall performance. During tasks that do not require intense processing power, the processor operates at or around this speed, conserving energy and minimizing heat generation.
The Max Boost Clock, often called Max Turbo Frequency or Max Turbo Boost, signifies the upper limit of a processor's clock speed. This clock speed is achieved when specific cores of the AMD processor dynamically increase their frequency to deliver peak performance. The Max Boost Clock is typically applied to a subset of cores and is triggered when the workload demands require a burst of processing power, such as for gaming, video editing, financial trading, and other intensive applications.
The All-Core Boost Speed refers to the clock speed that all cores of an AMD processor can achieve simultaneously when under load. Unlike the Max Boost Clock, which is applicable to only a select number of cores, the All-Core Boost Speed ensures that all cores are operating at an elevated clock speed for optimized multi-threaded performance. This feature is particularly advantageous for tasks that rely heavily on parallel processing, such as rendering, simulations, and content creation.
AMD EPYC 9374F is the frequency/core optimized offering which provides up to a 13 percent increase in all core boost speed over AMD EPYC 9354P, the basic 32 core 1-socket offering. The series also includes AMD EPYC 9334 which has half the L3 Cache but offers over 52 percent drop in Default TDP over AMD EPYC 9374F, making it the most energy efficient of the three CPUs.
Performance data
We captured four benchmarks:
- Sockperf is a network benchmarking tool designed to measure network latency and throughput performance using the Socket Direct Protocol (SDP) for high-performance computing clusters and data centers.
- The QuantLib benchmark is a software library used in quantitative finance and derivatives pricing for modeling and analyzing financial instruments, providing tools for pricing, risk management, and quantitative research. It is widely used by financial professionals and institutions for accurate and efficient financial calculations.
- High Performance Conjugate Gradient measures the computational efficiency of solving a sparse linear system using conjugate gradient methods, providing insights into HPC system performance and optimization. It complements the traditional HPL benchmark, reflecting real-world application characteristics.
- The dav1d benchmark is a performance testing tool used to assess the decoding speed and efficiency of the AV1 video codec, helping to evaluate its real-time playback capabilities and effectiveness in video streaming applications. It aids in optimizing AV1 codec implementations for improved video compression and playback performance.
To compare performance across three R7615 4th Generation AMD EPYC processors, let us first consider the Sockperf benchmark. This benchmark reports throughput in terms of messages per second, the speed at which queries are processed and data is retrieved or stored. It also reports latency overload in usec, measuring the system's response time (latency) under different load conditions.
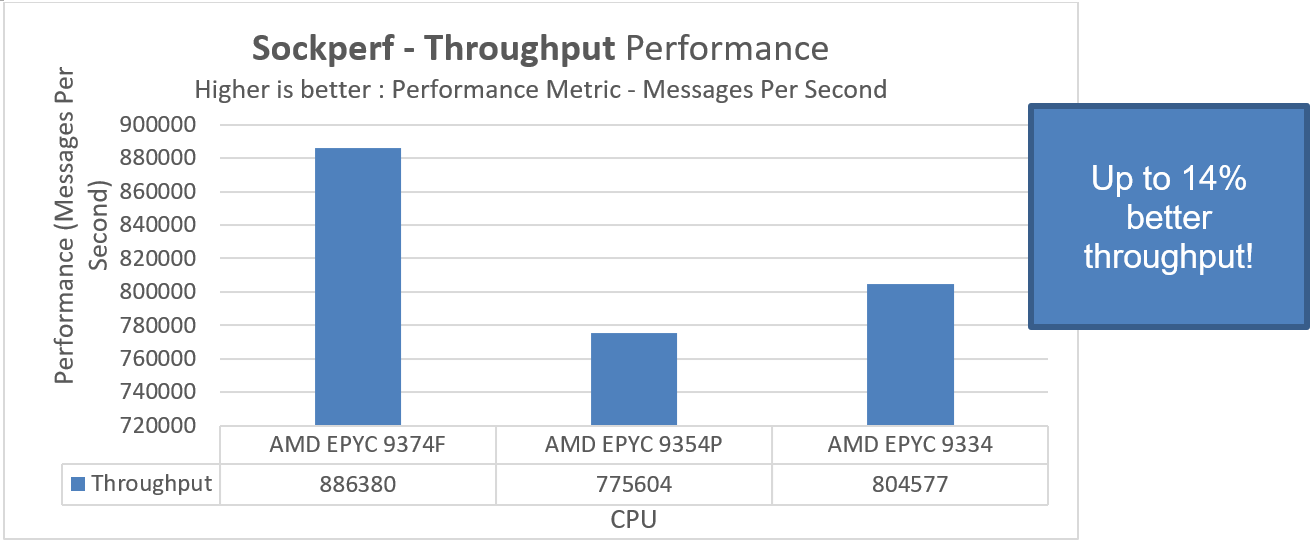
Figure 1. Three CPU comparison demonstrating Throughput performance using the Sockperf benchmark
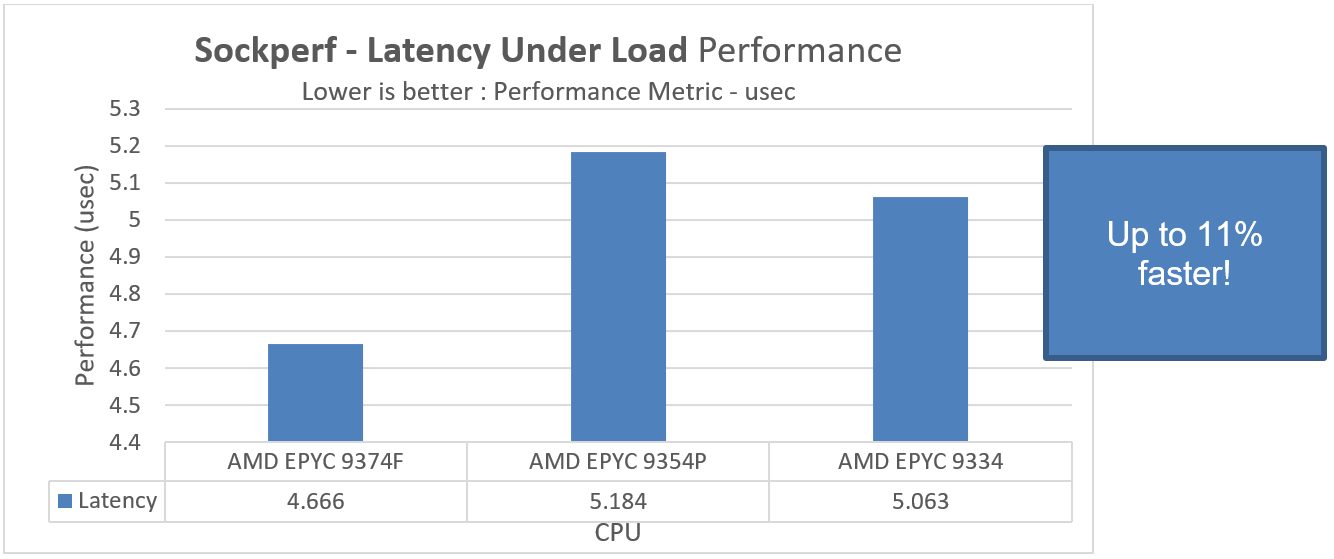
Figure 2. CPU comparison showing Latency under Load performance using the Sockperf benchmark
In PowerEdge R7615 with AMD EPYC 9374F, we see up to 14 percent better throughput performance and an 11 percent drop-in time taken for the Latency Under Load subtest to complete using the Sockperf benchmark over AMD EPYC 9354P.
We also report dav1d results in Frames per second. This test measures the time taken to decode AV1 video content and QuantLib results in MFLOPS, a benchmark for quantitative finance for modeling, trading, and risk management scenarios.
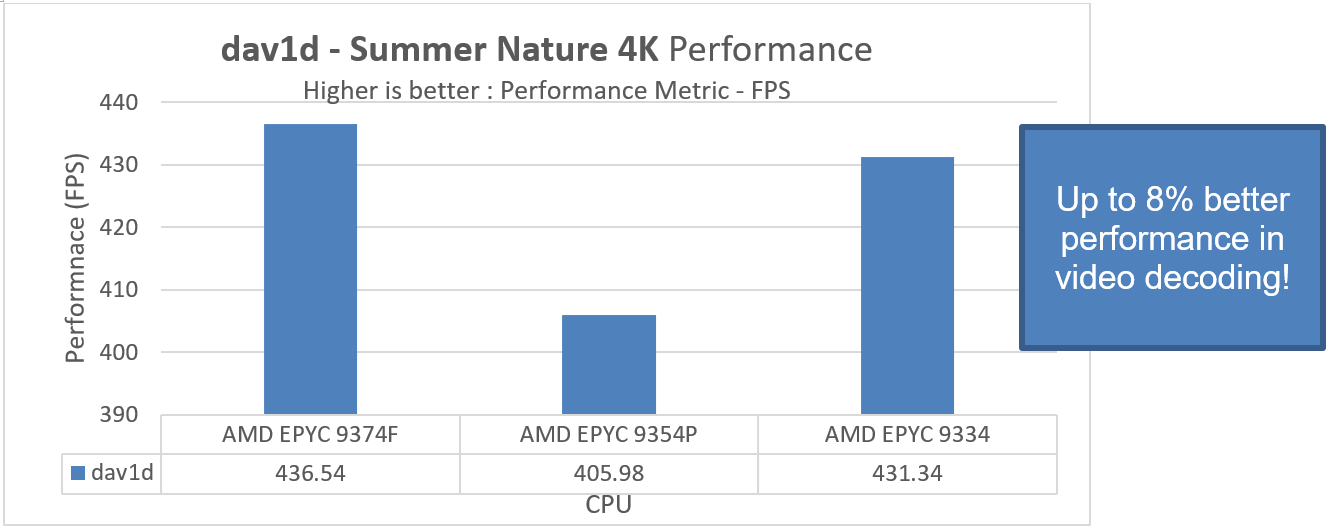
Figure 3. A three CPU comparison demonstrating dav1d performance
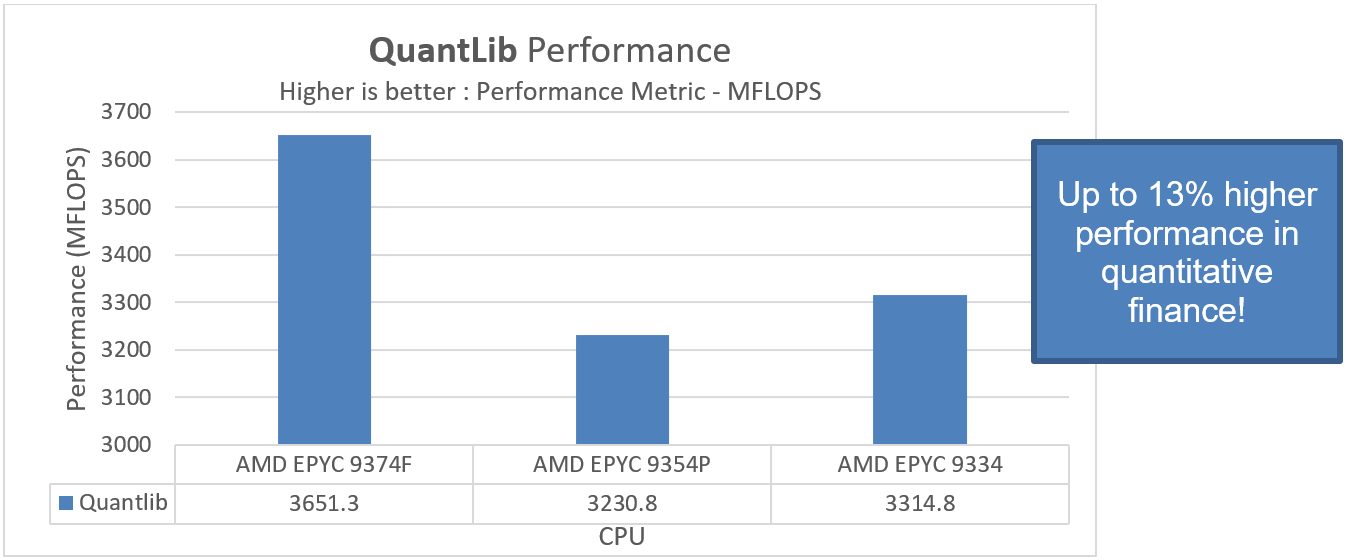
Figure 4. A three CPU comparison demonstrating performance using the QuantLib benchmark
Performance in PowerEdge R7615 with AMD EPYC 9374F is better for the dav1d and QuantLib benchmarks than for the other tested configurations. We find an up to 8 percent performance uptake for video decoding and an additional 13 percent better performance for financial modelling and trading workloads in Dell Technologies PowerEdge R7615 with the frequency optimized AMD EPYC 9374F.
Conclusion
Some workloads benefit from more cores and some benefit from higher frequency. Here we have shown examples of workloads that take advantage of the higher boost frequencies.
Like most industries, the financial trading industry continues to evolve. Firms are pushing workloads harder and with larger datasets, all while expecting immediate or real-time results. These organizations must be confident that they are investing in the right platforms to support computational requirements. With PowerEdge R7615 with AMD EPYC 9374F, Dell Technologies delivers the systems to address the current and expanding needs for high-performance quantitative trading modelling and risk management scenarios.
References
- Dell PowerEdge R7615 Spec Sheet
- AMD EPYC™ 9374F Processors | AMD
- DDR5 Memory Bandwidth for Next-Generation PowerEdge Servers Featuring 4th Gen AMD EPYC Processors | Dell Technologies Info Hub
[1] Tests were performed in August 2023 at the Solutions and Performance Analysis Lab at Dell Technologies.

Up to 29% Higher Inference Performance: PowerEdge R750xa and NVIDIA H100 PCIe GPU
Tue, 11 Apr 2023 22:40:39 -0000
|Read Time: 0 minutes
Executive Summary - PowerEdge R750xa
The Dell PowerEdge R750xa, powered by the 3rd Generation Intel® Xeon® Scalable processors, is a dual-socket/2U rack server that delivers outstanding performance for the most demanding emerging and intensive GPU workloads. It supports eight channels/CPU, and up to 32 DDR4 DIMMs @ 3200 MT/s DIMM speed. In addition, the PowerEdge R750xa supports PCIe Gen 4, and up to eight SAS/SATA SSD or NVMe drives.

Up to 29% higher inference performance PowerEdge R750xa and NVIDIA H100 PCIe GPU(1)
 One platform that supports all of the PCIe GPUs in the PowerEdge portfolio makes the PowerEdge R750xa the ideal server for workloads including AI-ML/DL Training and Inferencing, High-Performance Computing, and virtualization environments. The PowerEdge R750xa includes all of the benefits of core PowerEdge: serviceability, consistent systems management with IDRAC, and the latest in extreme acceleration.
NVIDIA H100 PCIe GPU
The new NVIDIA® H100 PCIe GPU is optimal for delivering the fastest business outcomes with the latest accelerated servers in the Dell PowerEdge portfolio, starting with the R750xa. The PowerEdge R750xa boosts workloads to new performance heights with GPU and accelerator support for demanding workloads, including enterprise AI. With its enhanced, air-cooled design and support for up to four NVIDIA double-width GPUs, the PowerEdge R750xa server is purpose-built for optimal performance for the entire spectrum of HPC, AI-ML/DL training, and inferencing workloads. Learn more here.
Next-Generation GPU Performance Analysis
The Dell HPC & AI Innovation Lab compared the performance of the new NVIDIA® H100 PCIe 310W GPU to the last Gen A00 PCIe GPU in the Dell PowerEdge R750xa. They ran the popular TensorRT Inference benchmark across various batch sizes to evaluate inferencing performance.
The results are in Figure 1.
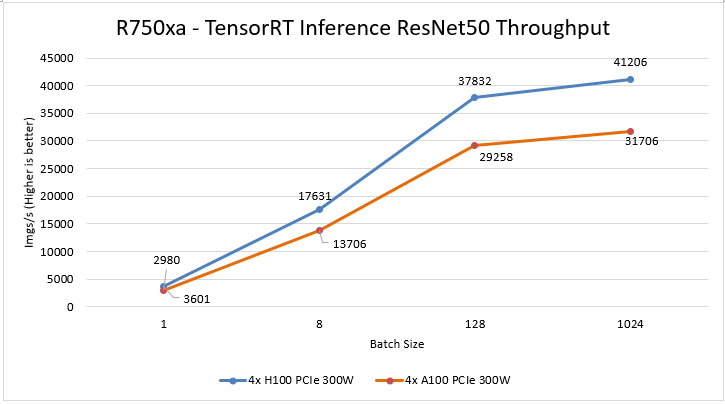
Figure 1. TensorRT
According to the industry standard TensorRT Inference Resnet50-v1.5 benchmark, the PowerEdge R750xa with NVIDIA's H100 PCIe 310W GPU processes approximately 29% more images per second than the NVIDIA A100 PCIe 300W GPU on the same server across various batch sizes. This significant improvement in image processing speed translates to higher overall throughput for inferencing workloads, making the PowerEdge R750xa with the H100 GPU an excellent choice for demanding applications.
Test Configuration
| R750xa with 4 NVIDIA H100 | R750xa with 4 NVIDIA A100 |
Server | PowerEdge R750xa | |
CPU | 2x Intel(R) Xeon(R) Gold 6338 CPU | |
Memory | 512G system memory | |
Storage | 1x 3.5T SSD | |
BIOS/iDRAC | 1.9.0/6.0.0.0 | |
Benchmark version | TensorRT Inference Resnet50-v1.5 | |
Operating System | Ubuntu 20.04 LTS | |
GPU | NVIDIA H100-PCIe-80GB (310W) | NVIDIA A100-PCIe-80GB (300W) |
Driver | CUDA 11.8 | CUDA 11.8 |
Conclusion
The PowerEdge R750xa supports up to four NVIDIA H100 PCIe adaptor GPUs and is available with new orders or as a customer upgrade kit for existing deployments.
Legal Disclosure
- Based on October 2022 Dell labs testing subjecting the PowerEdge R750xa 4x NVIDIA H100 PCIe Adaptor GPU configuration and the PowerEdge R750xa 4x NVIDIA A100 PCIe adaptor GPU configuration to TensorRT Inference Resnet50-v1.5 testing. Actual results will vary.