Home > Integrated Products > vSAN Ready Nodes > White Papers > SQL Server 2019 on PowerEdge R640 vSAN Ready Nodes: Using VMware vSAN 7 and Red Hat Enterprise Linux 8 > Scalability results
Scalability results
-
Transactions per minute
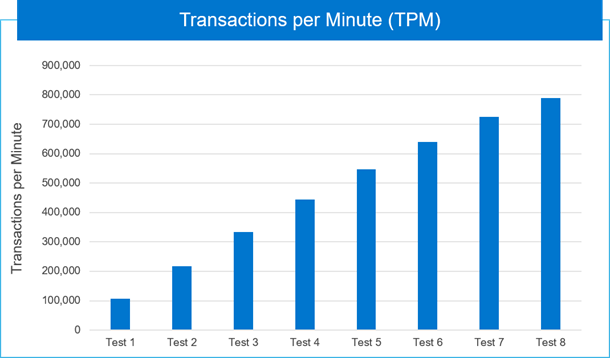
Transactions per minute (TPM) is an indicator that database performance professionals use to measure database activity during testing and operations for platforms such as Microsoft SQL Server. HammerDB measures the TPM for TPC-C benchmark runs. The following figure shows the cumulation of TPM as incremental VMs are tested. When eight VMs were benchmarked, we saw 7.42 times TPM value demonstrating linear scale, as shown in the following figure:

Figure 6. Cumulation of transactions per minute as VMs are added
New orders per minute
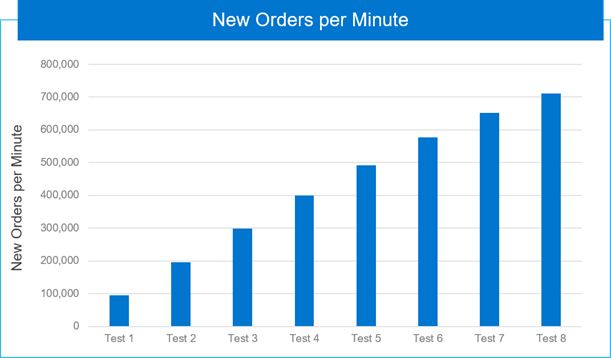
The most frequent transaction that terminal operators run against a database consists of entering a new order. In TPC-C, throughput is defined as how many new orders per minute (NOPM) a system generates while the system runs four other transactions types (Payment, Order-Status, Delivery, and Stock-Level). HammerDB measures the NOPM for TPC-C benchmark runs. The following figure shows the cumulation of NOPM as incremental VMs are tested. When eight VMs were benchmarked, we saw 7.43 times NOPM value demonstrating linear scale, as shown in the following figure:

Figure 7. Cumulation of new orders per minute as VMs are added
Batch requests per second
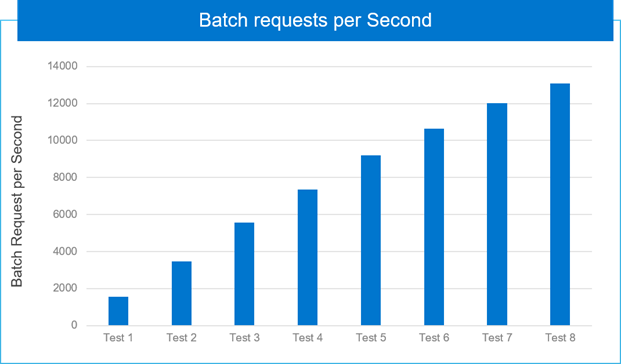
Batch requests per second is a performance counter for the number of T-SQL command batches received by the server per second. Monitoring the number of query compilations and recompilations and the number of batches received by an instance of SQL Server provides an indication of how quickly SQL Server is processing user queries and how effectively the query optimizer is processing the queries. A high number or batch requests illustrates good throughput. A script was created and used to measure batch requests per second from the SQL Server operating system counters during the TPC-C benchmark runs. The following figure captures the cumulation of batch requests per seconds as incremental VMs are tested. When eight VMs were benchmarked, we saw 8.41 times batch requests per seconds value demonstrating linear scale, as shown in the following figure:

Figure 8. Cumulation of batch requests per second as incremental VMs are added
Input Output per second (IOPs)
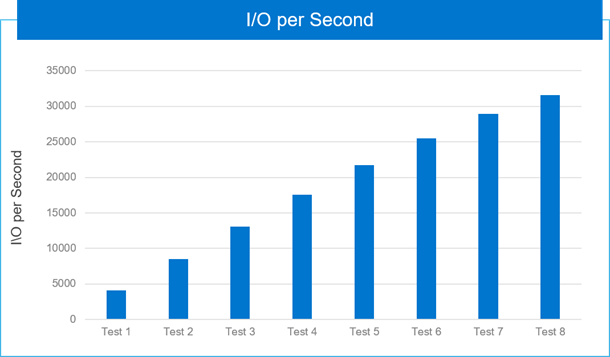
We used iostat to measure the transfers per second during the TPC-C benchmark runs. This parameter captures the I/O requests that were issued to the device. The following figure captures the cumulation IOPs as incremental VMs are tested. When eight VMs were benchmarked, we saw 7.61 times batch requests per seconds value demonstrating linear scale, as shown in the following figure:

Figure 9. Cumulation of IOPs as incremental VMs are added
