
OLTP 32 K is an 100 percent random workload – consisting of 70 percent reads and 30 percent writes – that is reflective of real-world online transactional processing data center workloads. Rather than picking a singular application to get results, this test can apply to virtually any application workload that shares a similar workload profile.
The chart below shows that an OLTP 32 K workload benefits from the increase in available network bandwidth. Peak IOPS for the cluster increased 78 percent from 256 K to 455 K, with a substantial 49 percent drop in latency from 2.59 to 1.32 millisecond. However, few environments can run any resource at peak load by choice for a sustained period.
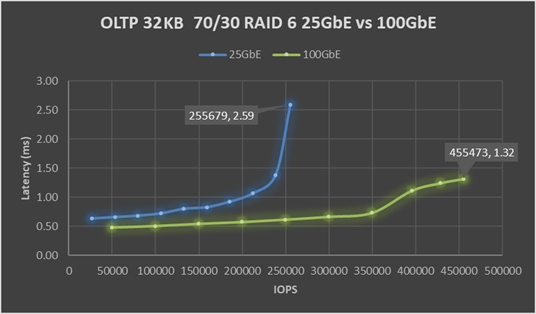
The blue 25 GbE line shows that once the workload goes above 212 K IOPS, latency increases sharply from 1.07 to 2.59 millisecond. While this final tail of performance delivers an additional 20 percent of performance or 44 K IOPS, it does come at the price of increased latency. As a best practice, when sizing a cluster for a workload, keep resources at 70 to 80 percent of maximum potential. This best practice allows headroom for unexpected spikes in demand, or a drop in resource availability during planned or unplanned node downtime.
Reviewing the performance at 70 to 80 percent of maximum potential, consider the performance results at these data points:
- At 70 percent of maximum, IOPS for the cluster performance increased 88 percent from 186 K to 350 K with a 20 percent drop in latency from 0.92 to 0.73 millisecond.
- On a per node basis, as performance scales nearly linear, approximately two nodes of similarly configured VxRail with ESA using 25 GbE perform as much output as the 100 GbE nodes.
- At 80 percent of maximum, IOPS for the cluster performance increased 86 percent from 212 K to 395 K with a 4 percent increase in latency from 1.07 to 1.11 millisecond.
High performance must be delivered with consistent and predictable latency. The green 100 GbE line shows an almost flat latency of 0.48 millisecond at 50 K IOPS to 0.73 millisecond at 350 K IOPS, which starkly contrats the blue 25 GbE line that shows a sharp rise in latency.
As mentioned, the only difference between the two test environments was the network configuration. Deploying ESA with 25 GbE networking will only limit the performance potential of an ESA cluster. By using 100 GbE networking, the full potential of ESA can be delivered with high performance and with low, consistent, and predictable latency. If you choose to deploy 25 GbE networking in the future, high performance will be required. Thus, you must choose will between purchasing additional VxRail nodes or a disruptive upgrade to 100 GbE networking.