
Performance metrics
Performance metrics
-
The Metric Interval column is added to the More Actions drop-down menu, enabling you to click Change Metric Granularity. This feature enables you to change volumes and Virtual Volumes performance metrics from the 20 second granularity to the 5 second granularity. You can also select multiple objects and click Compare Performance Metrics from the same menu to compare up to 12 resources of the same type. This option enables you to efficiently troubleshoot anomalies or contention on the system.
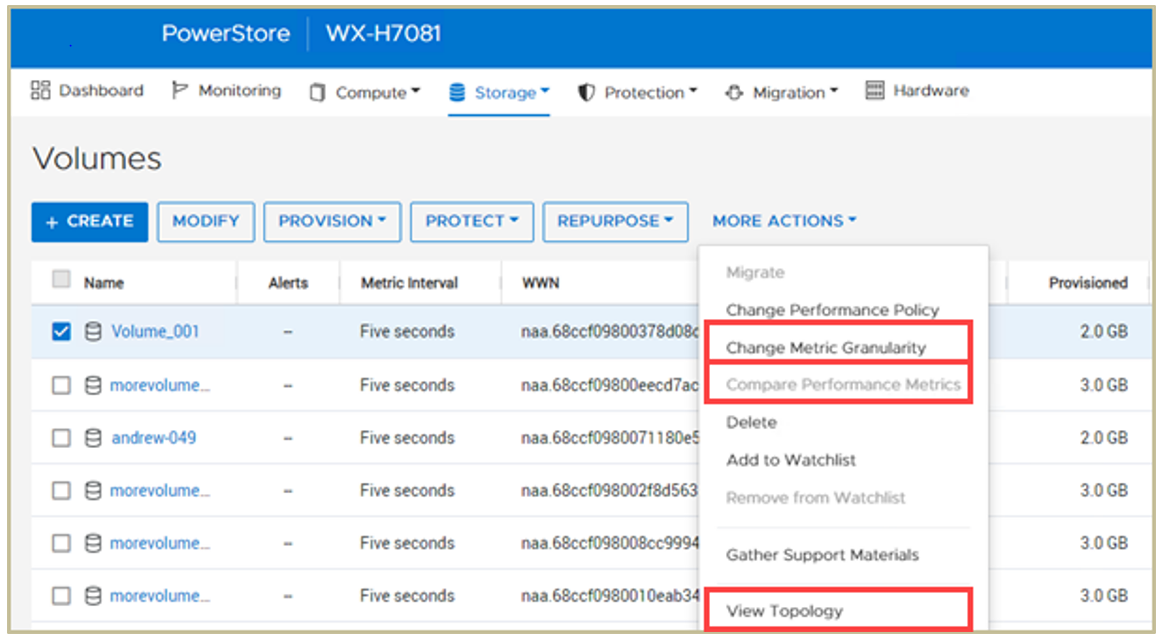
Figure 4. Storage > Volumes
The following figure shows an example of the topology for the selected Volume_001. The volume has four snapshots created under the Snapshots icon. There is also a clone created from snap5. In the panes on the right side, click the objects in the topology to view more information such as details, capacity, and hosts that the volume is mapped to. For objects in the topology, you can collapse and expand them with the minus and plus signs, and you can drag the objects around to meet your needs. Any changes that you make to the view persist by user and remain intact even after a logout. You can also use the search box to search for specific items. This new view enables you to understand impacts to your actions and avoid errors.
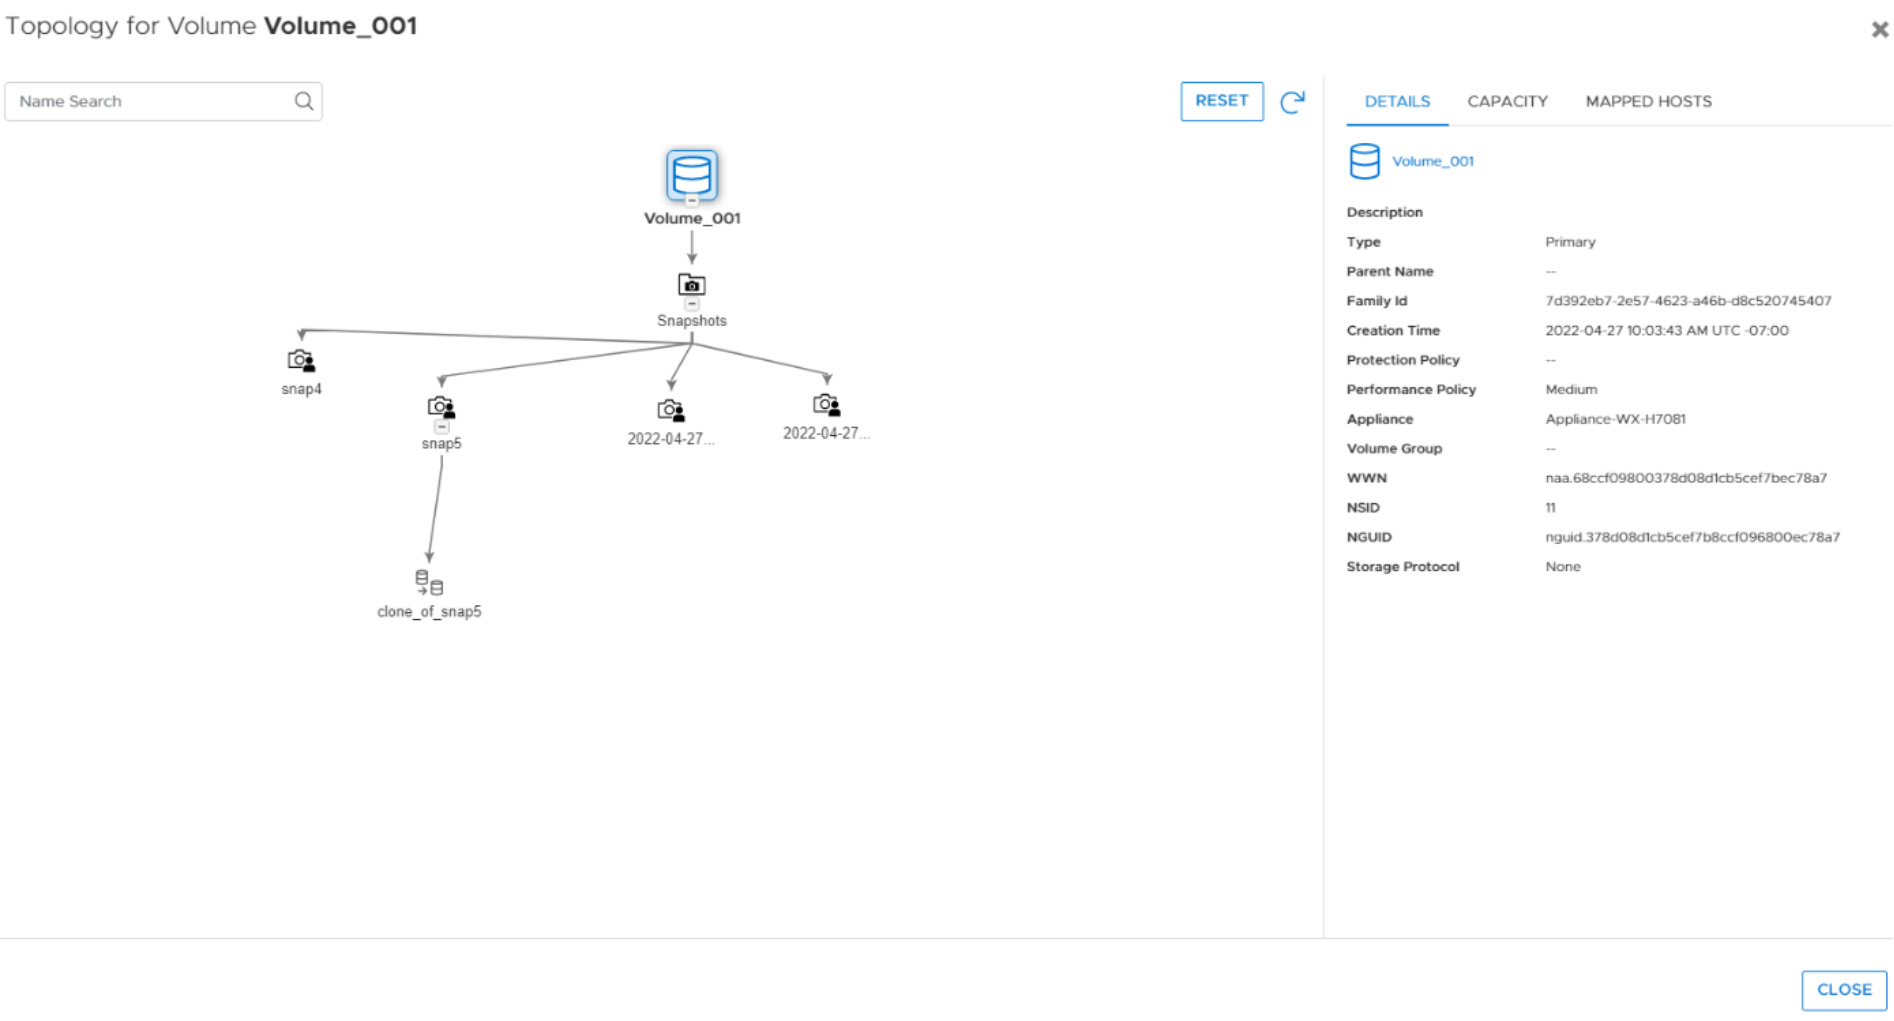
Figure 5. Storage > Volumes > Topology