Home > Storage > PowerMax and VMAX > Storage Admin > Dell PowerMax 2500 and 8500: Data Reduction > Overview
Overview
-
Managing and monitoring can be achieved using Unisphere for PowerMax or Solutions Enabler for PowerMax, or both. With both the Unisphere for PowerMax UI and the Solutions Enabler CLI, you can view, manage, plan, and report on data reduction savings, capacity, and system resource usage.
Unisphere for PowerMax
Unisphere for PowerMax provides system-level information about capacity usage, data reduction, and system resources in the Capacity dashboard. From the Capacity dashboard, you can go to screens that display information about effective and provisioned capacity, snapshot capacity, and data reduction, as well as system resources.
Capacity dashboard
Unisphere for PowerMax includes multiple displays that provide information related to capacity usage.
The main dashboard displays an interactive graph that shows the effective capacity usage and data reduction over time. This display shows the history of effective capacity usage and how the data reduction ratio relates to effective capacity. This information can be used to monitor and track trends of effective capacity usage relative to the data reduction ratio being shown. PowerMax 2500 or 8500 systems can be configured with FBA and CKD emulation within the same storage resource pool, but the historical graph is specific to the emulation view selected.
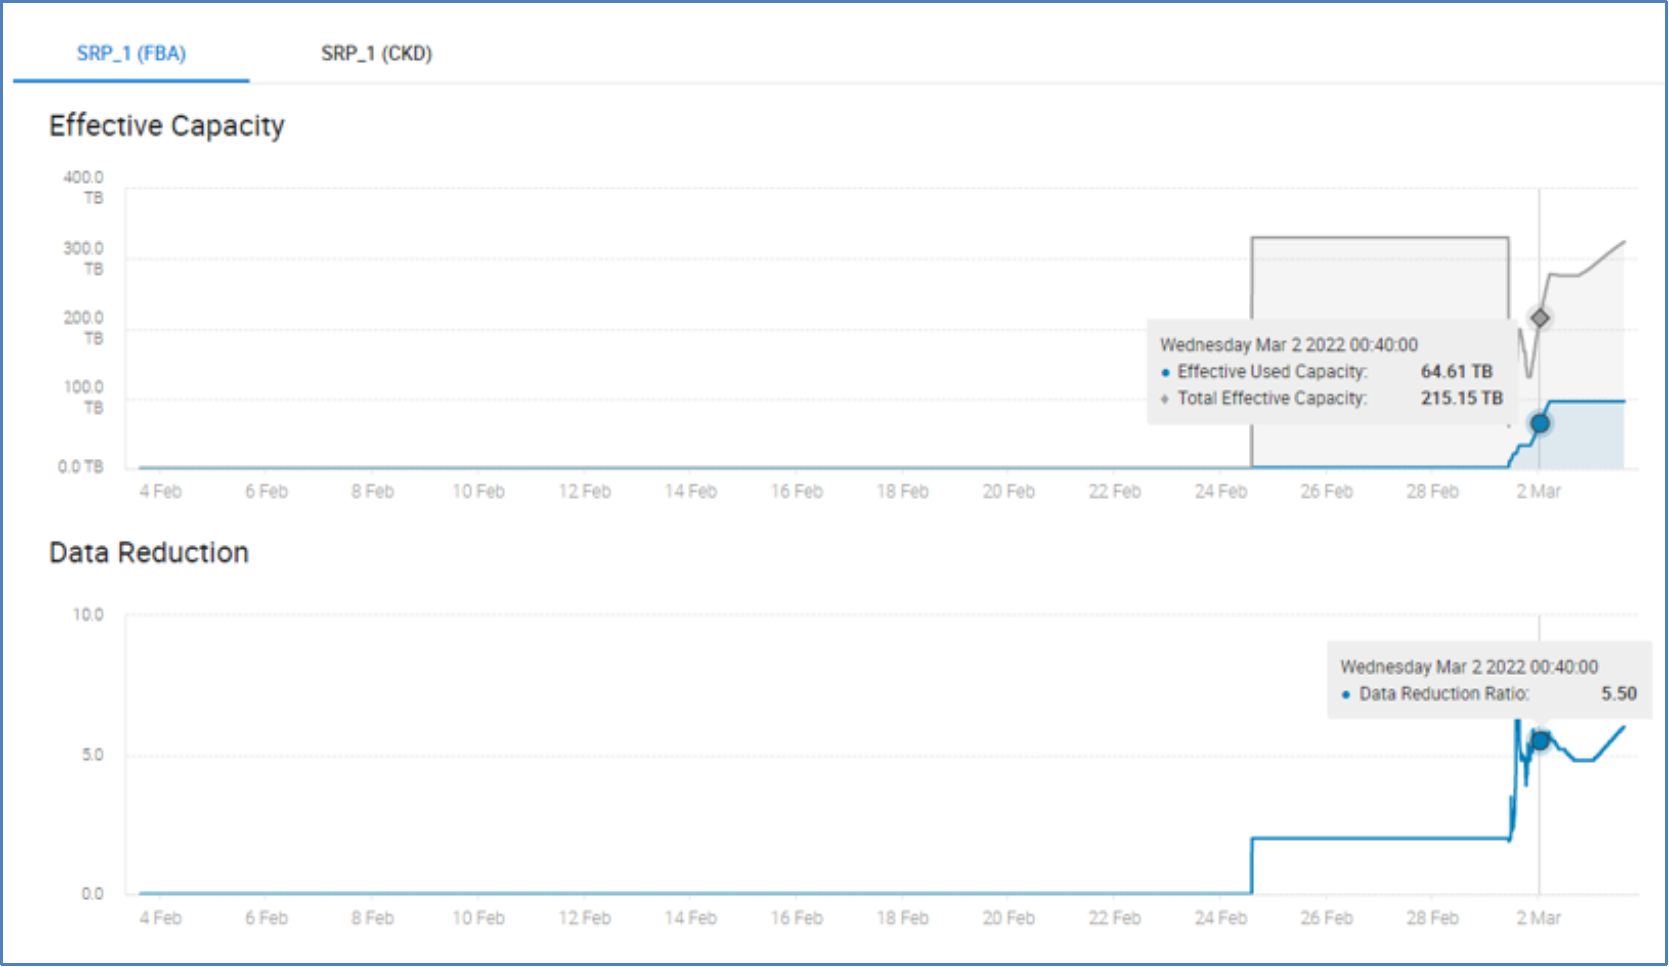
Figure 2. Capacity dashboard historical graph (in Unisphere) showing effective capacity and data reduction for FBA emulation
The main dashboard also offers data in the form of bar graphs for provisioned capacity, effective capacity, snapshot usage, and data reduction. Each section can be expanded to show more granular data for each item.
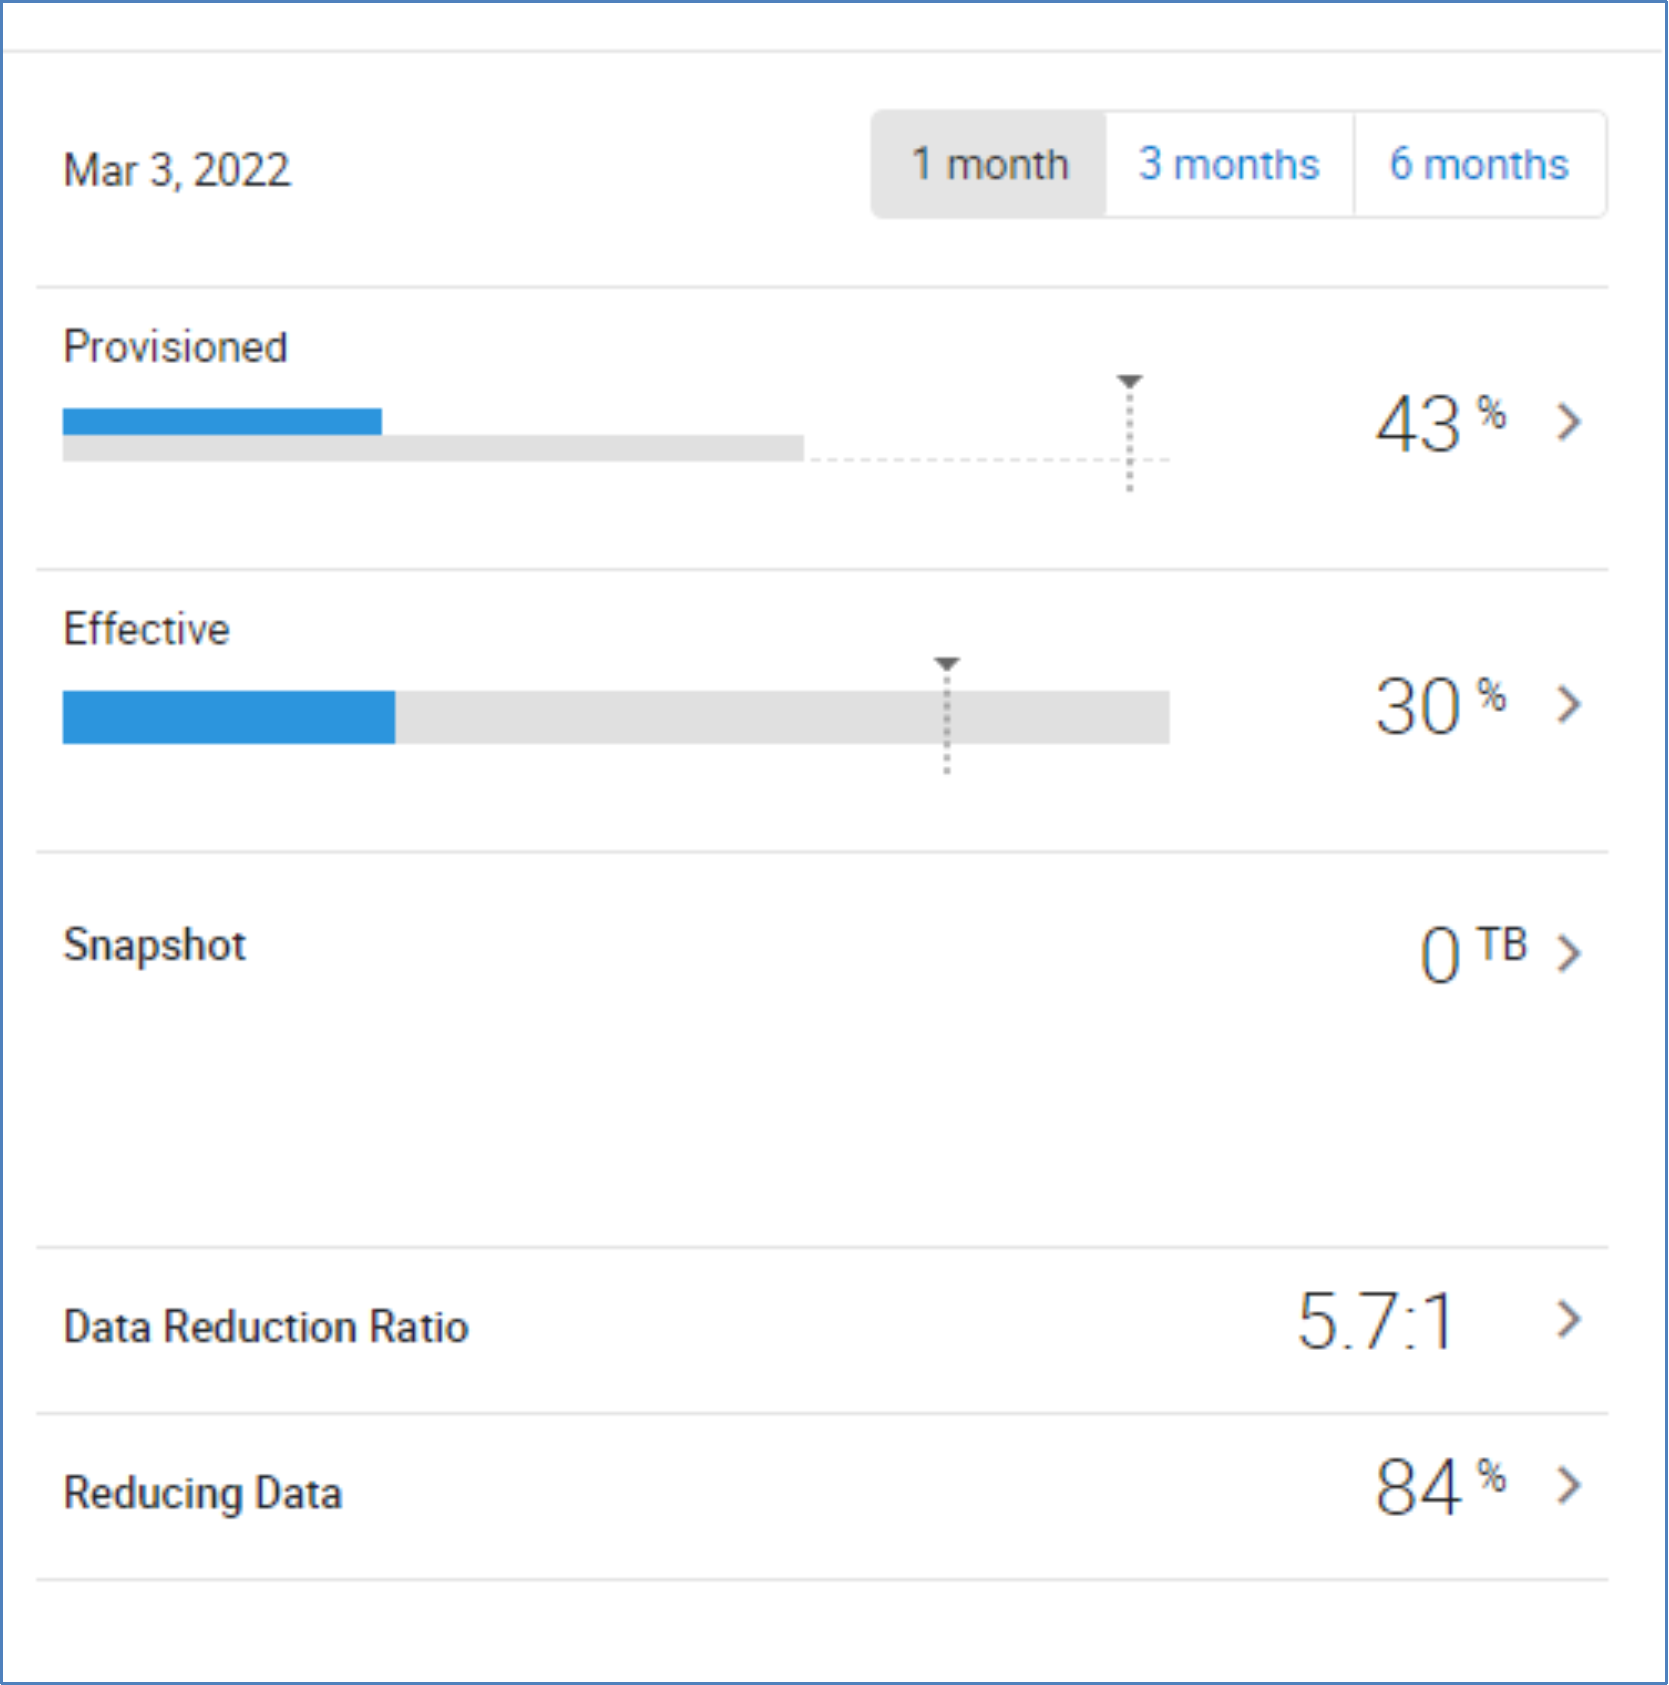
Figure 4. Capacity dashboard bar graphs (in Unisphere) for provisioned capacity, effective capacity, snapshot usage, and data reduction
Provisioned capacity
Provisioned capacity is the amount of capacity that is provisioned in the form of devices. Provisioned capacity is presented to hosts and applications as available capacity, and it is tracked through the following two metrics:
- SRP Capacity shows the amount of capacity provisioned as a value of TB provisioned and the available amount of effective capacity. The amount of effective SRP capacity is initially based on a default data reduction savings of 4:1 (3:1 for CKD emulation). This amount is calculated using the amount of physical capacity configured in the system. As users create devices, provisioned capacity increases. The percentage value shown is the subscription percent and is calculated using the amount provisioned and the amount of effective capacity.
- System Resources represents the amount of memory available to support provisioned capacity in the form of metadata. The total value presented will change only if cache is added to the system. The amount used represents just that. The Free amount is an indication of how much extra provisioned capacity the system can support. As users create devices, the amount used will increase. When there is a variation between the two values, memory resources are being used to support data reduction or other features that use memory, such as taking snapshots of existing devices.

Figure 5. System resource usage within the Provisioned Capacity display (in Unisphere)
Effective capacity
Effective capacity represents the amount of capacity available to the user based on an expectation of savings from the use of data reduction. Clicking the effective capacity link from the main capacity dashboard opens the Resources display. This provides a detailed view of the physical resources and effective resources available. This information is shown in three sections:
- Physical Capacity shows the amount of physical capacity available from the hard drives that are configured in the system. The amounts shown are the values after the formatting and RAID protection are applied. The value shown is the amount of capacity that the system can support for host data when data reduction is not being used.
- Effective Capacity Resources indicates the achievable values based on the current system resource usage. The values shown will adjust relative to the current data reduction savings and the physical and effective capacity usage.
- Effective Capacity Usage displays the current amount of effective capacity that is available based on the system resource usage and the current data reduction savings. The value displayed within the circular chart is the current available effective capacity. The values to the right of the chart show the current available effective capacity broken down into three categories—Snapshot Usage, User Used, and Free.
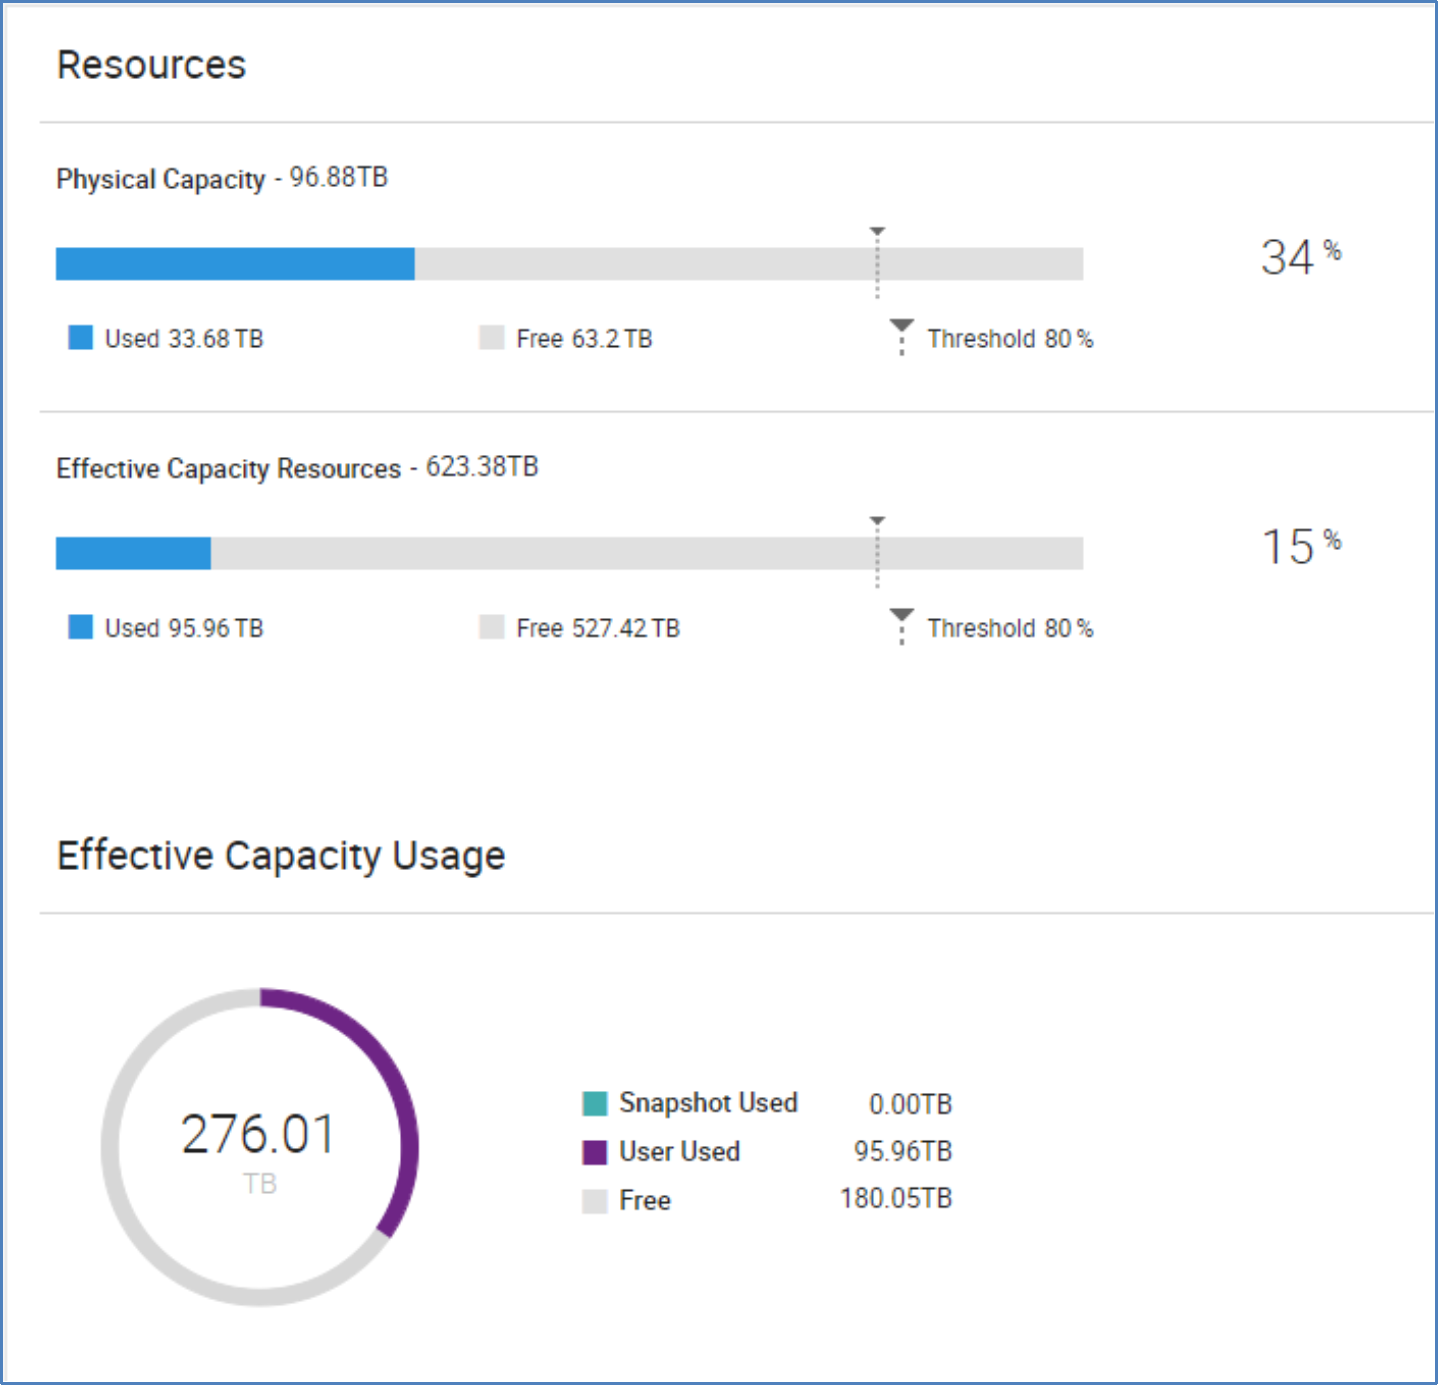
Figure 6. Resources display (in Unisphere) showing effective capacity
Snapshot
Back-end snapshot capacity might be significantly less than deltas per snapshot due to efficiency of features such as shared allocations and data reduction.
Hover over the Snapshot bar graph on the Capacity dashboard to see high-level details. The snapshot values are defined as follows:
- Used: Used effective capacity for snapshot change data
- Free: Remaining amount of snapshot change data based on amount used and remaining metadata
- Total: Used plus free capacity
- Threshold: Threshold for alerting about snapshot change data
Click the Effective and Snapshot bar graphs to go to the respective Effective Capacity and Snapshot Capacity dashboards.
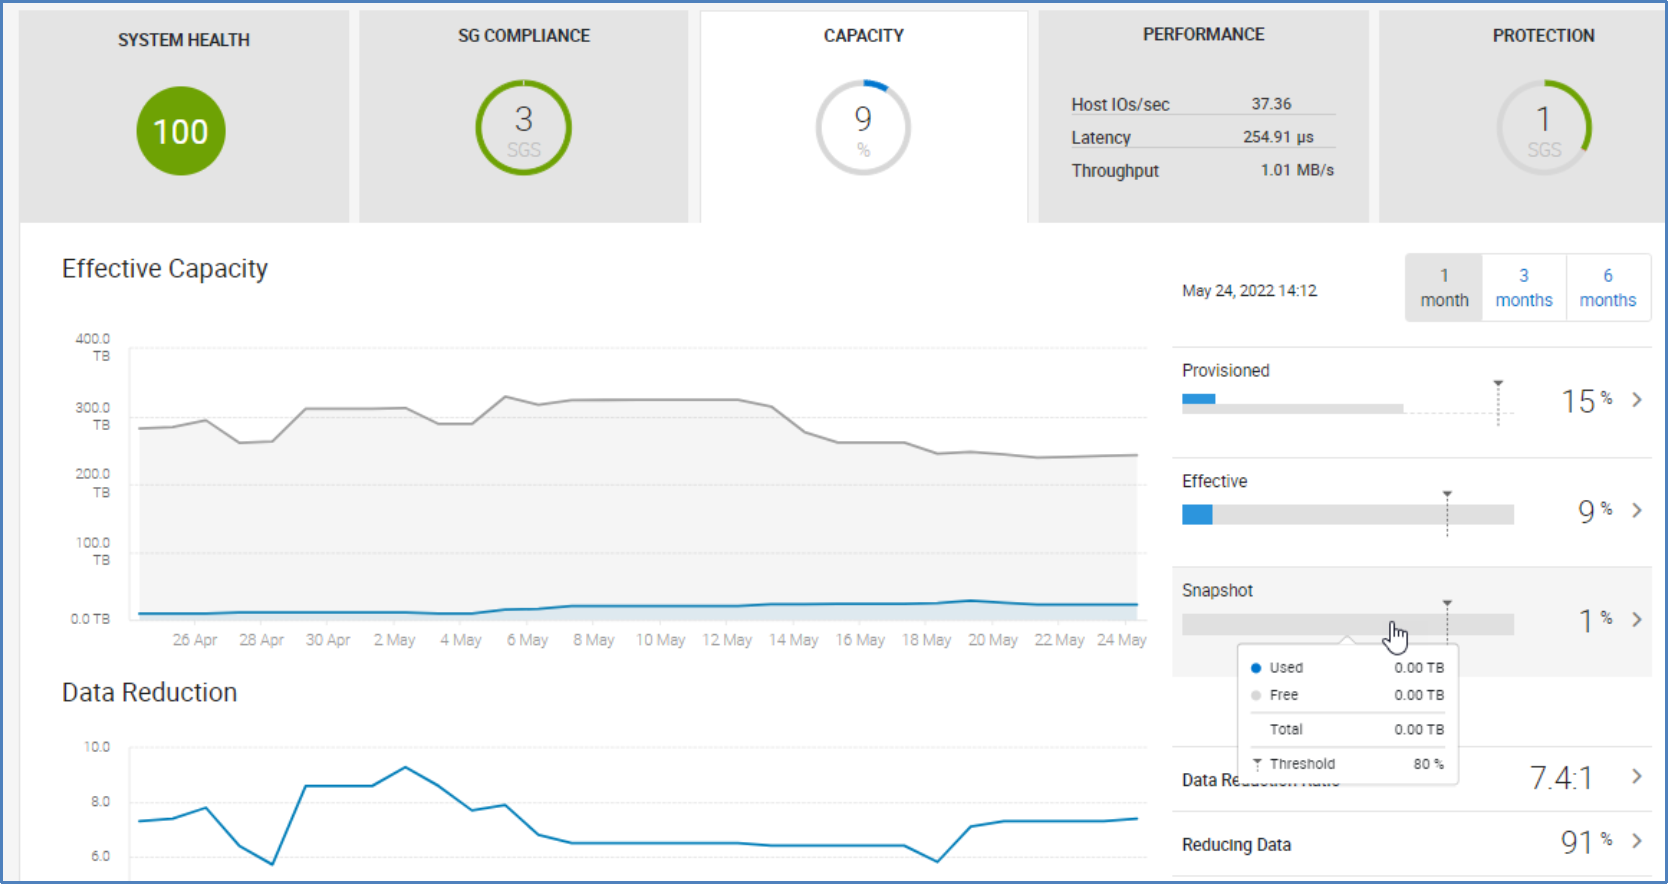
Figure 7. Capacity dashboard (in Unisphere)
On the Effective Capacity dashboard, Snapshot Used is the amount of effective capacity used by snapshot change data.
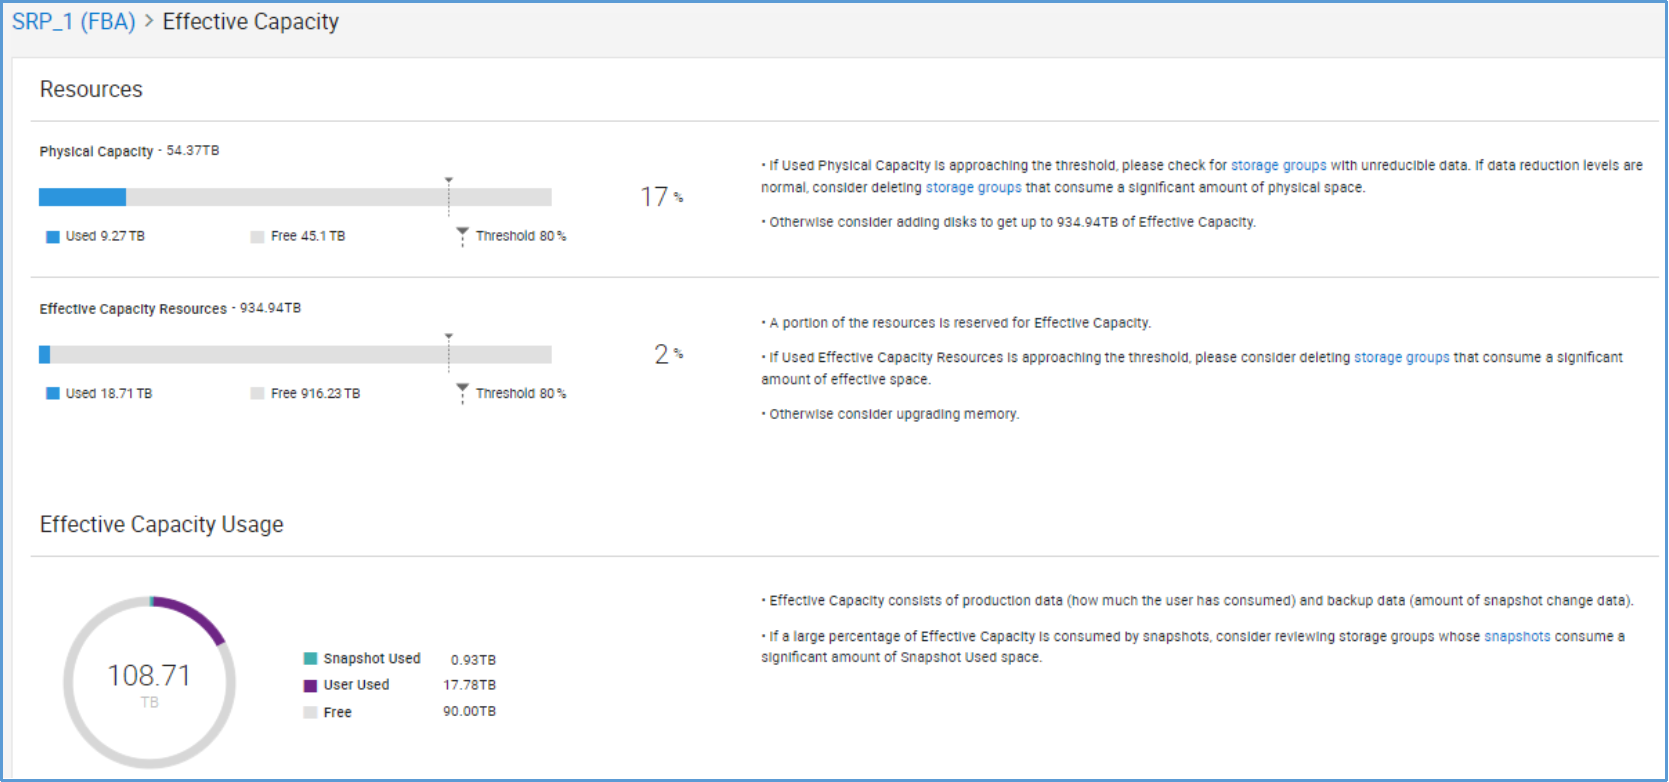
Figure 8. Effective Capacity dashboard (in Unisphere)
The values on the Snapshot Capacity page are defined as follows:
- Snapshot Effective Used: Percentage of effective capacity used by snapshot data for the SRP
- Snapshot Physical Used: Percentage of usable capacity consumed by snapshot data for the SRP
- Snapshot Resources: Percentage of snapshot metadata consumed for the entire system
- Snapshot Resources Used: Capacity used by snapshots as part of snapshot metadata capacity
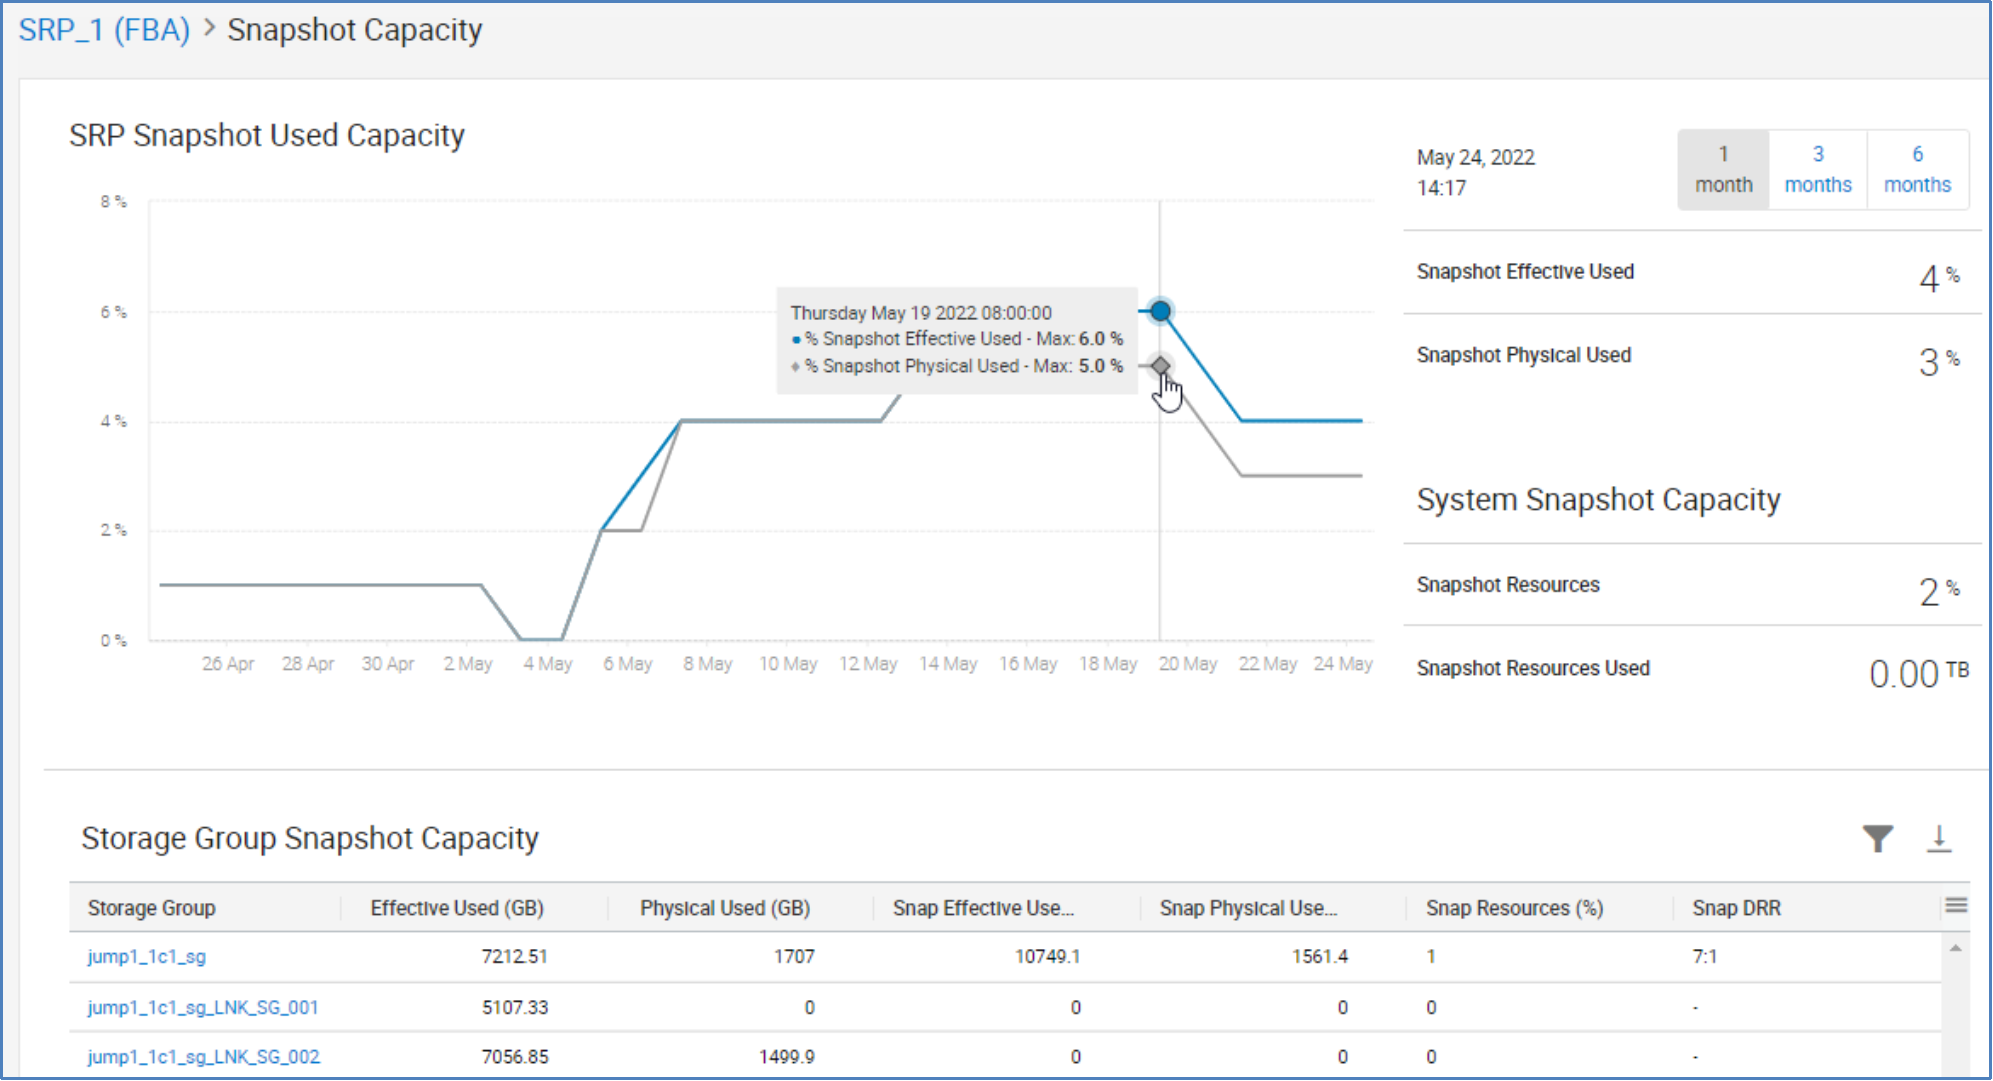
Figure 9. Snapshot Capacity (in Unisphere)
Data Reduction Ratio
The Data Reduction display provides a single location for viewing the data reduction efficiency. There are three sections: Data Reduction Ratio, a historical interactive graph, and a table of all storage groups. The data reduction ratio shown accounts for only enabled and reduced data written to the system.

Figure 10. Data Reduction display (in Unisphere)
Data Reduction Ratio is displayed as a graph that presents effective used capacity, the data reduction ratio, and physical used capacity. Physical Used refers to the actual amount of physical capacity that is being used. Data Reduction presents the savings as a ratio.
Effective Used represents data written to the system before any savings are achieved when data reduction is applied. All values shown represent the full size of the data as it was written by the host or application. Written data is placed into one of two categories, Enabled or Disabled.
- Enabled indicates that the data being accounted for is data reduction enabled and subject to the data reduction process and the activity-based reduction function. When data reduction is enabled, data is further categorized as Reducible, Unreducible, or Unevaluated.
- Reducible data is the amount of data written that the data reduction process has identified as data that can be reduced to use less physical capacity than was written to the system.
- Unreducible data is data that cannot be reduced.
- Unevaluated data is not yet evaluated by the data reduction process. It has not yet been determined if the data is reducible or unreducible.
- Disabled indicates that the data written to the system is not subject to any data reduction savings. All data identified as disabled will be shown as unreduced.
Physical Used represents data written to the system after it has been stored on disk. It accounts for all data enabled and disabled as well as all data reduced and unreduced. Two categories represent the data stored on disk: Enabled and Disabled.
- Enabled Indicates data that has gone through the data reduction process. This data is further categorized as Reduced, Unreducible, or Unevaluated.
- Reduced data has been sent through the data reduction process, which includes passing data through the data reduction hardware and then storing the data on disk. Reduced data stored on disk consumes less disk space than what was written by the host or application.
- Unreducible data has been sent through the data reduction process, including the data reduction hardware, but could not be reduced. Some unreducible data accounted for within the Physical Used section might contribute to the data reduction savings if it is data that is shared due to deduplication.
- Unevaluated data is data not yet evaluated by the data reduction process. Thus, it has not yet been determined if the data is reducible or unreducible.
- Disabled indicates that the data written to the system is not subject to any data reduction savings. All data identified as disabled will be shown as unreduced.
The interactive graph charting DRR Enabled and Reducing and Unreducible Data provides historical data and shows the effect of unreducible data on the data reduction ratio. This graph allows you to track and monitor the changes in the data reduction ratio that can be caused by unreducible data.
The Storage Group Data Reduction list provides capacity usage and data reduction information specific to each storage group in the system. When using the interactive graph to track changes to the data reduction ratio, you can use the storage group list to identify storage groups that have large amounts of unreducible data that are affecting the data reduction ratio.
Calculating efficiency ratios: The data required to calculate the data reduction ratio is available in a pop-up window in the Data Reduction graph.
- Data reduction ratio: The data reduction ratio is calculated using Enabled - Reducible from Effective Used and Enabled - Reduced from Physical Used.
Enabled Reducible ÷ Enabled Reduced
- Overall data reduction ratio: The overall system data reduction ratio is calculated using the total values from Effective Used and Physical Used
Effective Used total ÷ Physical Used total
Solutions Enabler
Solutions Enabler for PowerMax offers a wide range of CLI outputs to provide data so that you can monitor, manage, and plan, as with Unisphere for PowerMax. However, because it is a CLI, Solutions Enabler does not provide graphics or charts to view alongside the data.
You can monitor, manage, and plan for PowerMax systems with Solutions Enabler 10.0.1 or later by using three basic commands. Each output displays current information on data reduction, capacity usage, and resource usage, as well as the demand on the system and its resources.
Capacity
The output displayed by running the capacity command provides a breakdown of capacity usage categorized as Provisioned Capacity, Effective Capacity, and Snapshot Capacity. Under each category, the amount used and amount free are displayed. Within the Effective Capacity portion of the output, the capacity resources are shown. When monitoring and planning capacity usage, the most important metrics to watch are:
- Used (TB) under Provisioned Capacity
- Used (TB) under Physical Capacity (under Effective Capacity)
Symcfg -sid<NNN> list -capacity
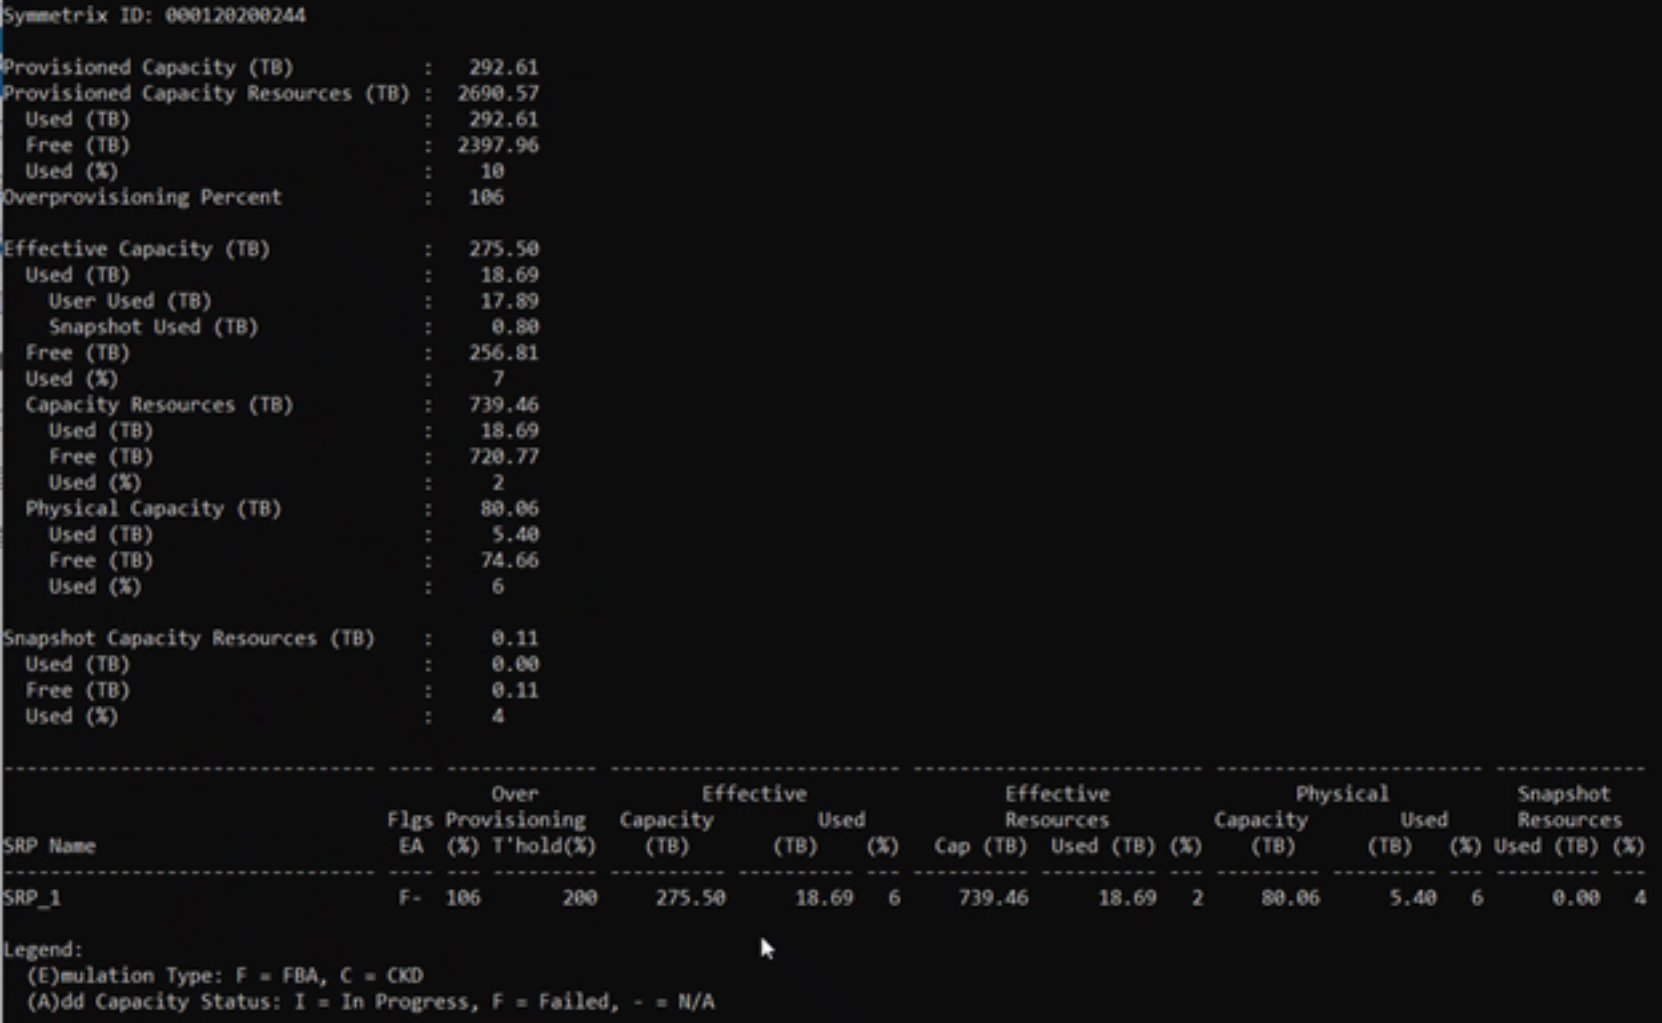
Figure 11. Solutions Enabler 10.0.1 capacity command output
Efficiency
The output displayed for the efficiency command provides high-level information about the features within the system that offer resource and capacity savings as a result of data reduction. It is important to note that the Data Reduction Ratio accounts for only data stored on the system capacity that has been reduced.
Symcfg -sid<NNN> list -efficiency -v

Figure 12. Solutions Enabler 10.0.1 efficiency command output
Demand
The storage group demand report output lists all the storage groups in the system and all volumes created that are not associated with a storage group. As with the efficiency command output, the Data Reduction Ratio reflects only data stored on capacity that has been reduced. It is important to note that when the data presented includes cascaded storage groups (a single parent storage group that has child storage groups), the allocations are accounted for in both items. As a result, a calculation of total allocations can result in a value that is greater than what is shown in the capacity output.
Symcfg -sid<NNN> -list -srp -demand -type sg -detail
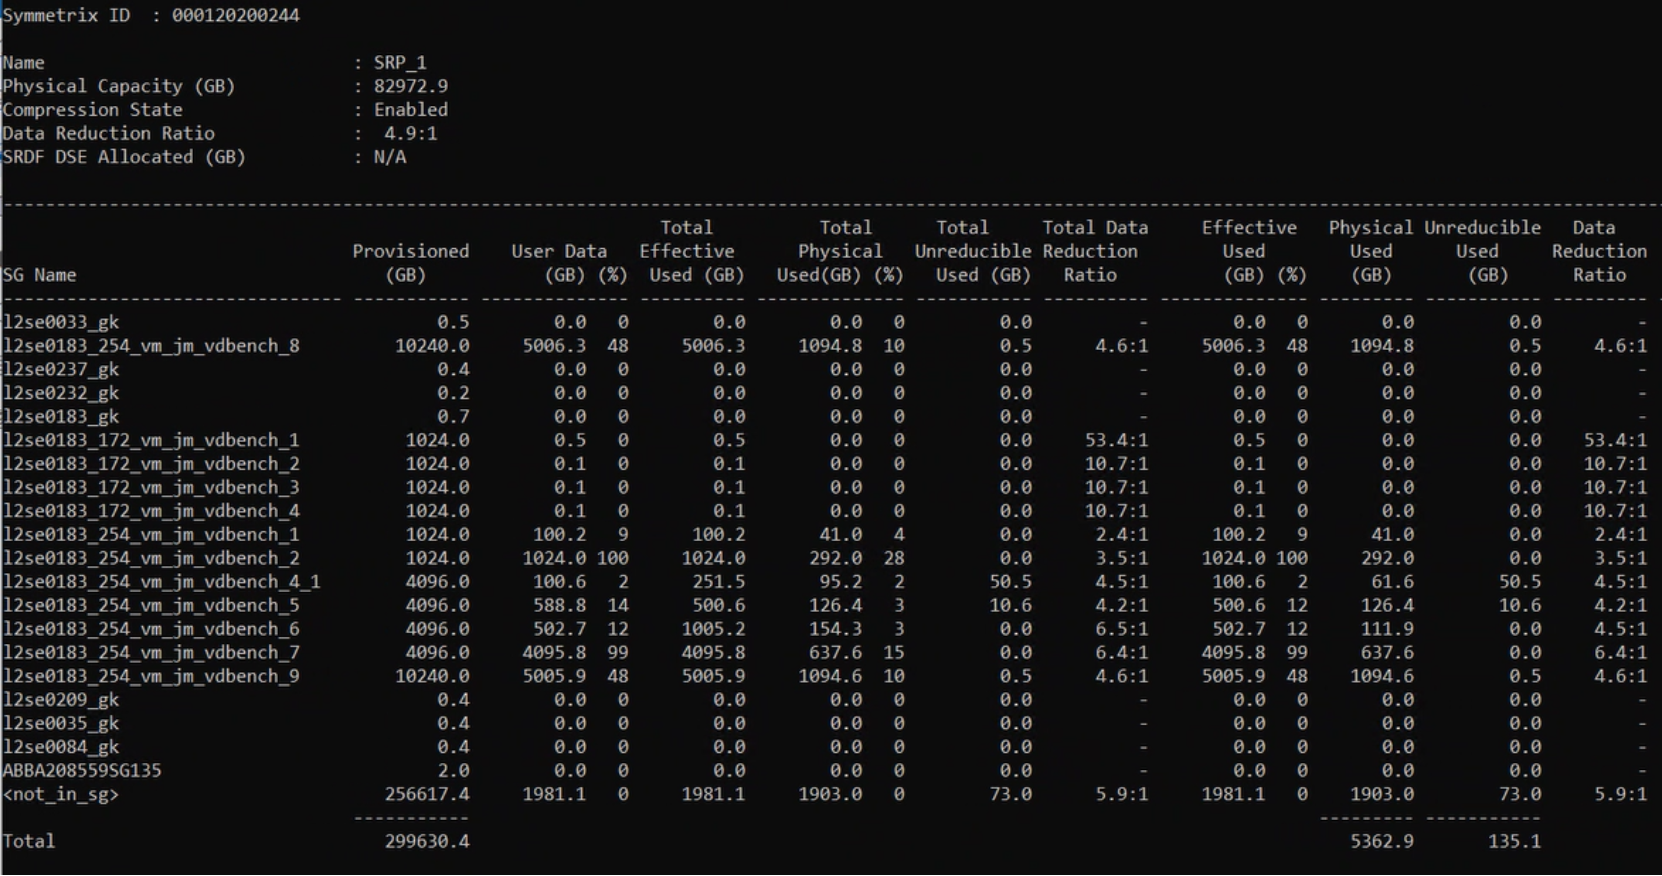
Figure 13. Solutions Enabler 10.0.1 demand command output
