
PowerMax data reduction
PowerMax data reduction
-
PowerMax compression and deduplication
The PowerMax storage system provides data reduction without compromising performance. The PowerMax data reduction is the combination of the following components:
- Hardware acceleration—Each PowerMax node is configured with a hardware compression module that handles data compression and decompression. These hardware modules are also capable of generating Hash IDs that enable deduplication.
- Activity Based Reduction (ABR)—Typically, the most recent data is the most active, creating an “access skew.” ABR relies on that skew to prevent constant compression and decompression of data extents that are frequently accessed. The ABR function uses machine language (ML) algorithms to mark the busiest 20 percent of all allocated data extents in the system to skip the data reduction workflow. Data extents that are highly active remain uncompressed, even if their storage group has data reduction enabled. As the data extents become less active, they are automatically compressed while newly active extents become part of the “hottest” 20 percent (if enough free storage capacity is available).
- Deduplication—Deduplication is a capacity-savings method that identifies identical copies of data and stores a single instance of each copy. During the data reduction and inline compression process, the hardware acceleration modules generate Hash IDs using the SHA-256 algorithm to 32 KB data blocks created by fine-grain data packing. These Hash IDs are then used in the deduplication process to help identify identical data. ABR affects the deduplication workflow similarly to compression.
- Fine-grain data packing—When PowerMax compresses data, each 128 KB track is split into four 32 KB buffers. All buffers are compressed in parallel. The total of the four buffers results in the final compressed size of the data. This process includes a zero reclaim function that prevents the allocation of buffers with all zeros and no actual data. For small-size write or read operations, only the necessary buffers participate.
- Compaction—Compaction is a process that performs data placement. It intuitively places reduced or unreduced data on disk in the best possible location available. The operation of storing data on disk uses write objects. Each object is 6 MB of contiguous back-end data device capacity across the drives configured in the system. Write objects are aligned on 1 KB boundaries and are consumed sequentially in a single use. Write objects are spread across full stripes for all supported RAID types to optimize writes. Each object supports reduced or unreduced data. An unreduced write object consists of 48 PowerMax tracks (128 KB each). A reduced write object consists of approximately 1,000 reduced tracks. Reduced entries for write objects range from 1 KB to 96 KB for open systems.
- Extended Data Compression (EDC)—If data that is already compressed is enabled for compression and has not been accessed for over 30 days, it is automatically compressed again. This additional compression increases storage efficiency even more.
Also, note that:
- Compression is enabled or disabled at an SG level, allowing ease of management. Generally, most databases can benefit from storage compression. Customers might decide not to enable compression if the database is fully encrypted or if an SG contains data that is continuously overwritten (such as database transaction logs).
- When compression is enabled, all new writes benefit from inline compression based on ML algorithms. If the SG already contains data when compression is enabled, it goes through background compression with low priority (relative to application I/Os).
- When new SGs are created in Unisphere, data reduction is enabled by default for these SGs.
For more information about PowerMax data reduction, see Dell PowerMax: Data Reduction inline compression and deduplication
Data reduction and deduplication example
While PowerMax local replications such as snapshots and clones natively benefit from efficient data reduction due to shared storage allocations and thin provisioning, when host-based copies are made, PowerMax deduplication comes into effect. Deduplication is especially effective for data copies that are aligned to the PowerMax track size, which is 128 KB. Therefore, it is recommended to format NTFS file systems with a 128 KB allocation unit.
In the following example, a Windows file copy is performed between two drives formatted with NTFS with a 128 KB allocation unit. Each drive is based on a PowerMax volume from an SG that has data reduction enabled.
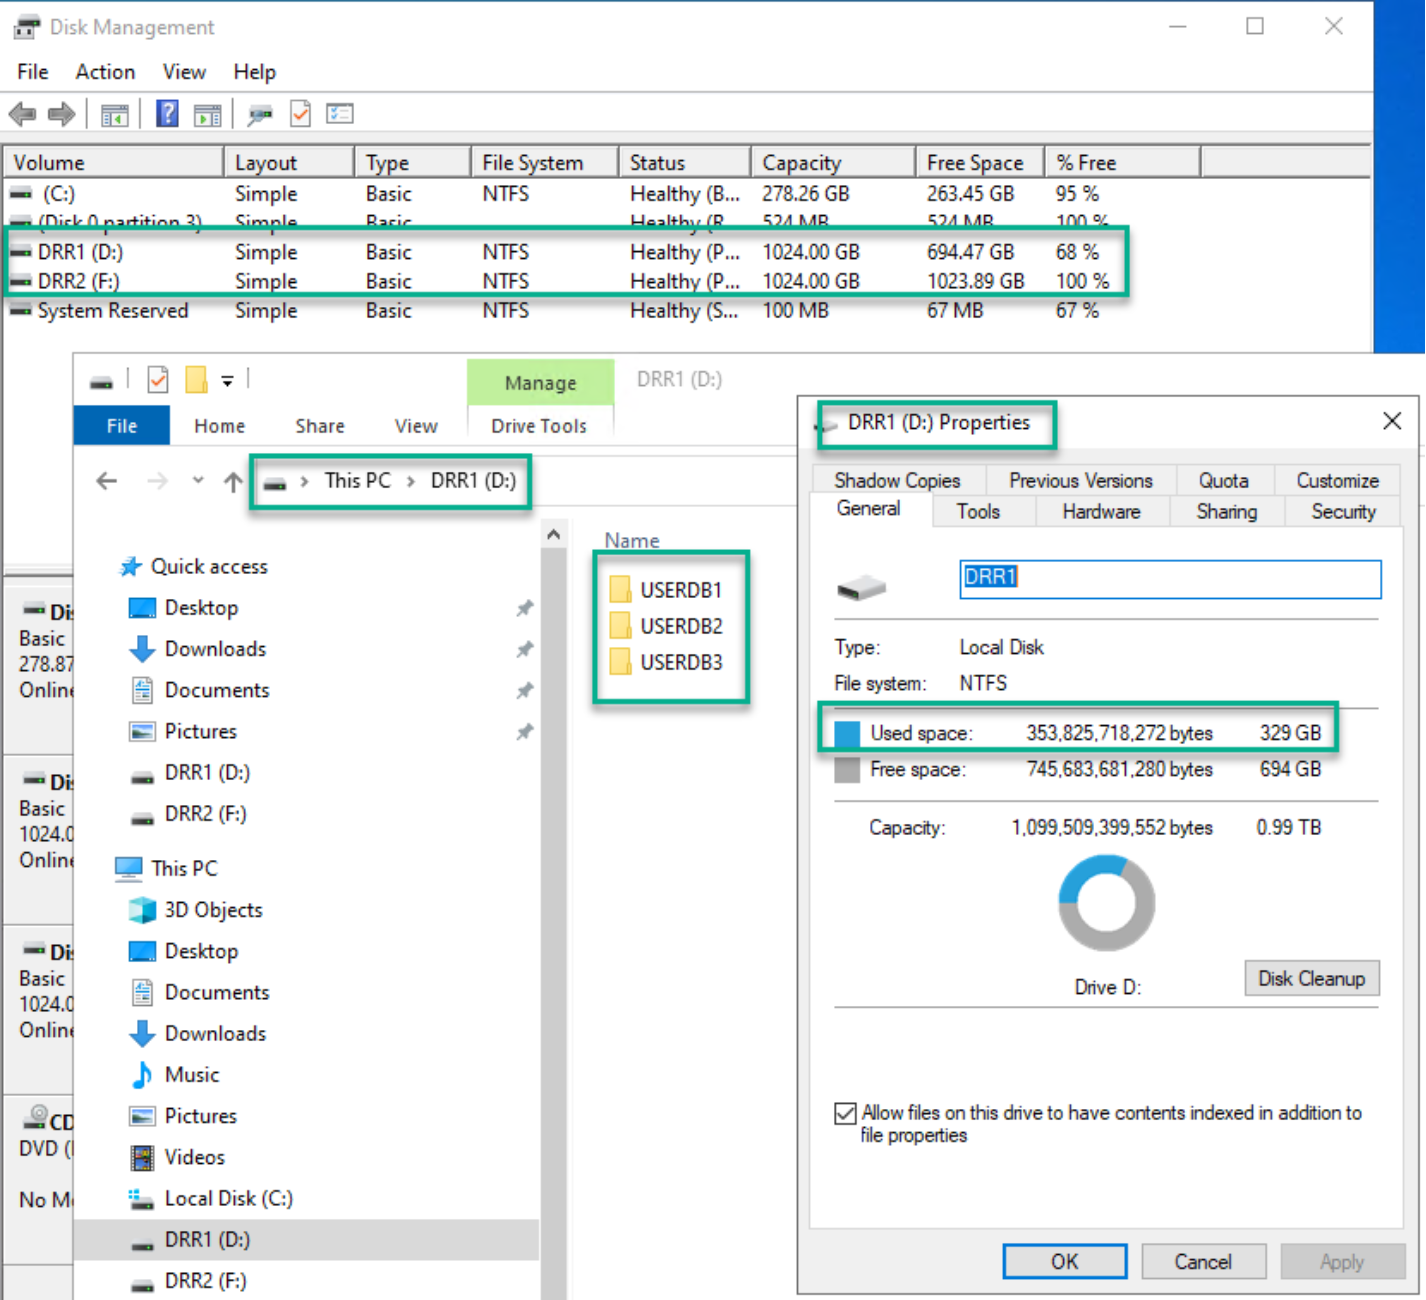
Figure 4. Deduplication test: Disks before copy
As seen in the preceding figure, drive D:\ has three user database directories with a total of 329 GB used space. Drive F:\ is 100 percent free (freshly formatted disk with 128 KB allocation units).
If we look at the storage metrics before the copy operation using the Solutions Enabler CLI, we see the SRP capacity showing 1637.7 GB used. The source volume reports 296.2 GB effective capacity used, but only 60.1 GB physical capacity is actually taken. As a result, the Data Reduction Ratio (DRR) is 4.9:1. The target volume only has 0.1 GB effective capacity used, so we can ignore its DRR until after the copy.
# symcfg list -srp -detail -gb
STORAGE RESOURCE POOLS
Symmetrix ID : 000120200305
C A P A C I T Y
-------------------------------- --- --------------------------------------------
Flg Physical Physical Physical Provisioned
Name DRR (GB) Used (GB) Free (GB) (GB)
-------------------------------- --- ---------- ---------- ---------- -----------
SRP_1 BXO 74682.7 1637.7 73045.0 24334.5
---------- ---------- ---------- -----------
Total 74682.7 1637.7 73045.0 24334.5
# symcfg list -sg_compression -all | egrep 'Flags|Devices|DRR'
Flags Number Effective Physical Estimated
Storage Group Name C Devices Used (GB) Used (GB) Ratio
WinDRR1 X 1 296.2 60.1 1.7:1
WINDRR2 X 1 0.1 0.0 26.9:1
# symcfg list -srp -demand -type sg | egrep 'Effective|Used|DRR'
Effective Snapshot Snapshot Data
Provisioned Used Effective Resources Reduction
SG Name (GB) (GB) (%) Used (GB) Used (%) Ratio
WinDRR1 1024.0 296.2 28 0.0 0.0 4.9:1
WINDRR2 1024.0 0.1 0 0.0 0.0 179.9:1
Next, we copy the three user database directories in Windows File Explorer from drive D:\ to drive F:\. When the copy is finished, we can use the Solutions Enabler CLI to view the storage metrics.
The SRP-used capacity increased by 128.4 GB (1766.1 – 1637.7). The target volume shows 291.5 GB effective capacity used and 139.3 GB physical capacity used, with only 2.1:1 DRR.
# symcfg list -srp -detail -gb
STORAGE RESOURCE POOLS
Symmetrix ID : 000120200305
C A P A C I T Y
-------------------------------- --- --------------------------------------------
Flg Physical Physical Physical Provisioned
Name DRR (GB) Used (GB) Free (GB) (GB)
-------------------------------- --- ---------- ---------- ---------- -----------
SRP_1 BXO 74682.7 1766.1 72916.6 24334.4
---------- ---------- ---------- -----------
Total 74682.7 1766.1 72916.6 24334.4
# symcfg list -sg_compression -all | egrep 'Flags|Devices|DRR'
Flags Number Effective Physical Estimated
Storage Group Name C Devices Used (GB) Used (GB) Ratio
WinDRR1 X 1 296.2 49.7 1.7:1
WINDRR2 X 1 291.5 139.3 1.7:1
# symcfg list -srp -demand -type sg | egrep 'Effective|Used|DRR'
Effective Snapshot Snapshot Data
Provisioned Used Effective Resources Reduction
SG Name (GB) (GB) (%) Used (GB) Used (%) Ratio
WinDRR1 1024.0 296.2 28 0.0 0.0 6.0:1
WINDRR2 1024.0 291.5 28 0.0 0.0 2.1:1
Why did we not get an immediate 100 percent deduplication rate?
There are two reasons:
- The first reason is ABR. Because this copy operation is the “hottest” activity in the test storage system, the data extents are not immediately compressed and deduplicated.
- The second reason is that HammerDB generates data that is mostly random. Note that the 1.7:1 estimated (compression) ratio in the output, which is very low. The PowerMax ML algorithms detect the ratio and as a result, defer the data reduction to allow for best performance.
Typically, customer data is more compressible and there is ample other activity in the system besides copying three directories. In this particular test environment, we wait 30 minutes to view the metrics again, as shown in the following example:
# symcfg list -srp -detail -gb
STORAGE RESOURCE POOLS
Symmetrix ID : 000120200305
C A P A C I T Y
-------------------------------- --- --------------------------------------------
Flg Physical Physical Physical Provisioned
Name DRR (GB) Used (GB) Free (GB) (GB)
-------------------------------- --- ---------- ---------- ---------- -----------
SRP_1 BXO 74682.7 1637.7 73045.0 24334.5
---------- ---------- ---------- -----------
Total 74682.7 1637.7 73045.0 24334.5
# symcfg list -sg_compression -all | egrep 'Flags|Devices|DRR'
Flags Number Effective Physical Estimated
Storage Group Name C Devices Used (GB) Used (GB) Ratio
WinDRR1 X 1 296.2 31.1 1.7:1
WINDRR2 X 1 291.5 29.0 1.7:1
# symcfg list -srp -demand -type sg | egrep 'Effective|Used|DRR'
Effective Snapshot Snapshot Data
Provisioned Used Effective Resources Reduction
SG Name (GB) (GB) (%) Used (GB) Used (%) Ratio
WinDRR1 1024.0 296.2 28 0.0 0.0 9.5:1
WINDRR2 1024.0 291.5 28 0.0 0.0 10.1:1
We see that the SRP-used capacity went back to 1637.6 GB, which is the same capacity as before the copy and demonstrates a 100 percent deduplication rate.
We also see that the physical capacity of both source and target devices is much lower compared to the effective used capacity, resulting in DRR of 9.5:1 (296.2 / 31.1) and 10.1:1 (291.5 / 29.0).