Home > Storage > ObjectScale and ECS > Industry Solutions and Verticals > Dell ECS App for Splunk Enterprise > Installation and configuration steps
Installation and configuration steps
-
Create an index to store ECS data
An existing Splunk index can be used to store the incoming data from ECS. However, we recommend creating a new one. The index can be a SmartStore or Non-SmartStore index.
Note: If using a Heavy Forwarder, you must create the same index name on it.
See this document to create a SmartStore index with ECS.
Install the Dell ECS Splunk Technology Add-on
The TA is installed on both the Heavy Forwarder and Search Head. It can be installed through the UI or by unpacking it from the CLI.
Install from the UI
- Log in to Splunk Web, and go to Apps > Manage Apps.
- Click install app from file.
- Click Choose file, and select the Dell ECS Add-on installation file.
- Click Upload.
- Restart Splunk.
Install from the CLI
- Transfer the TA package to the Heavy Forwarder and Search Head.
- SSH to the server.
- Use the following command to unpack the file:
tar xvzf <name of ECS TA package> -C /$SPLUNK_HOME/etc/apps/
- Restart Splunk.
Configure the Dell ECS Splunk Technology Add-on
When Splunk has restarted, log in to the Heavy Forwarder UI to configure the Add-on.
Note: Configuration of the TA is only performed on the Heavy Forwarder or indexer. No configuration is necessary on the Search Head.
Configuration tab
- Click the Configuration tab next to the Inputs tab.
- Click the Add button to add the information for an ECS VDC.
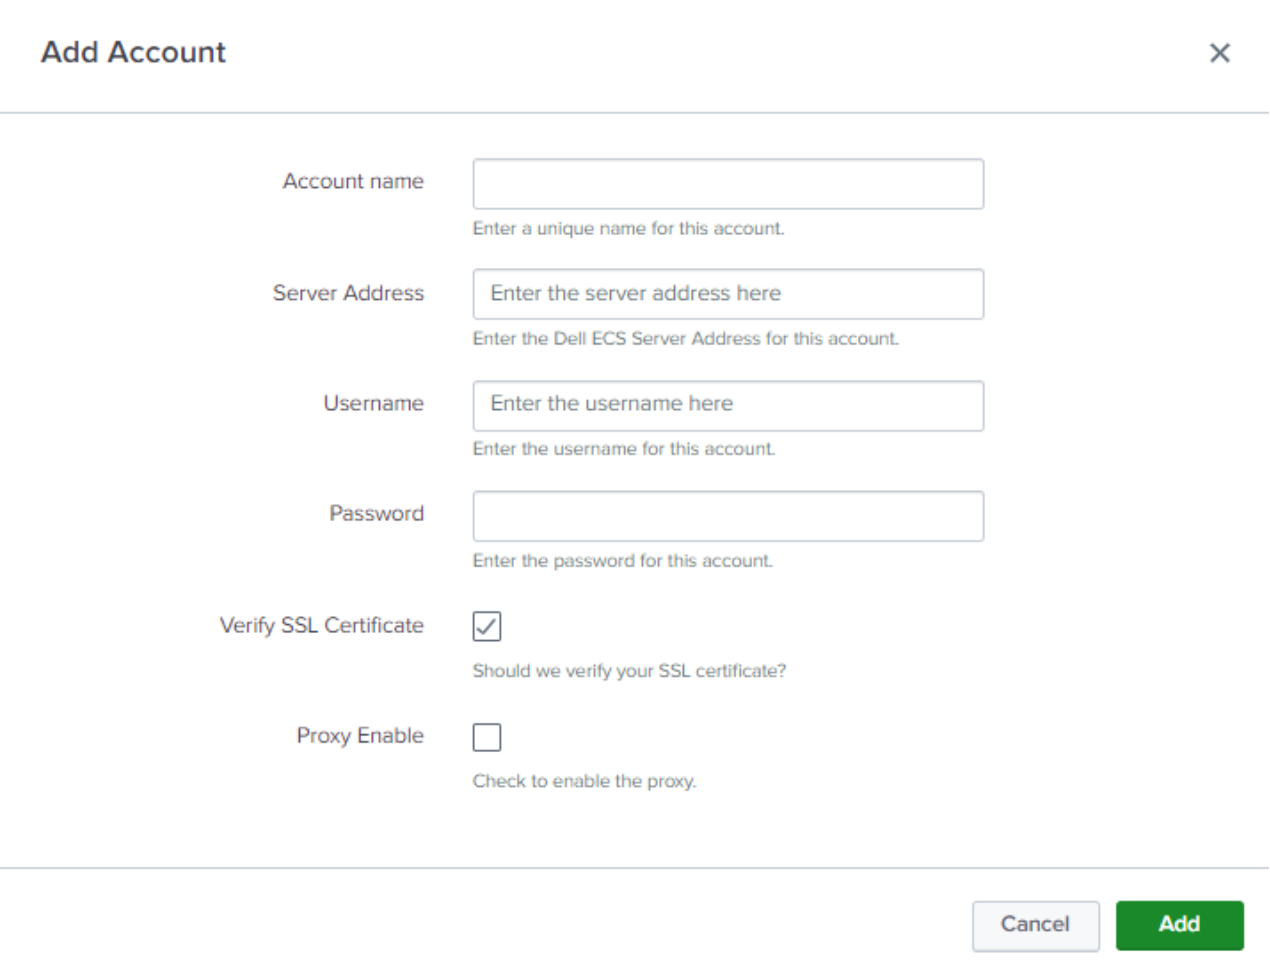
Account Name: Enter a unique name for the ECS VDC.
Server Address: Enter the IP of one of the ECS Nodes. Do not use a Virtual IP.
Username: Enter the ECS Management user. An existing user can be used, or a new one can be created specifically for the Splunk App for ECS.
Password: Enter the password for the ECS Management User.
Verify SSL Certificate: Verify the ECS management API SSL certificate.
Proxy Enable: Details for the proxy (host, port) must be entered if the checkbox is enabled.
Note: If Verify SSL Certificate is enabled, you must append the certificate to the $SPLUNK_HOME/etc/apps/TA-dellecs/ta_dell_ecs/requests/cacert.pem file. For safety purposes, take a backup of cacert.pem before appending the SSL certificate.
Create an account for each ECS VDC.
Inputs tab
- Click the Create New Input button from the Inputs tab.
- Multiple inputs are required for each ECS VDC.
- Dell ECS Input indexes all the data into the Splunk except Namespace and Bucket data.
- Dell ECS Namespace Input indexes Namespace data only.
- Dell ECS Buckets Input indexes Buckets data only.
Note: If multiple inputs are created using the same global account, there will be duplicate events in the Splunk index.
The individual inputs control how often to collect information from ECS. For instance, if there are several namespaces, you can set the interval in the Dell ECS Namespace Input to once per day to limit the number of API calls that are performed.
- Create each input for each ECS VDC.
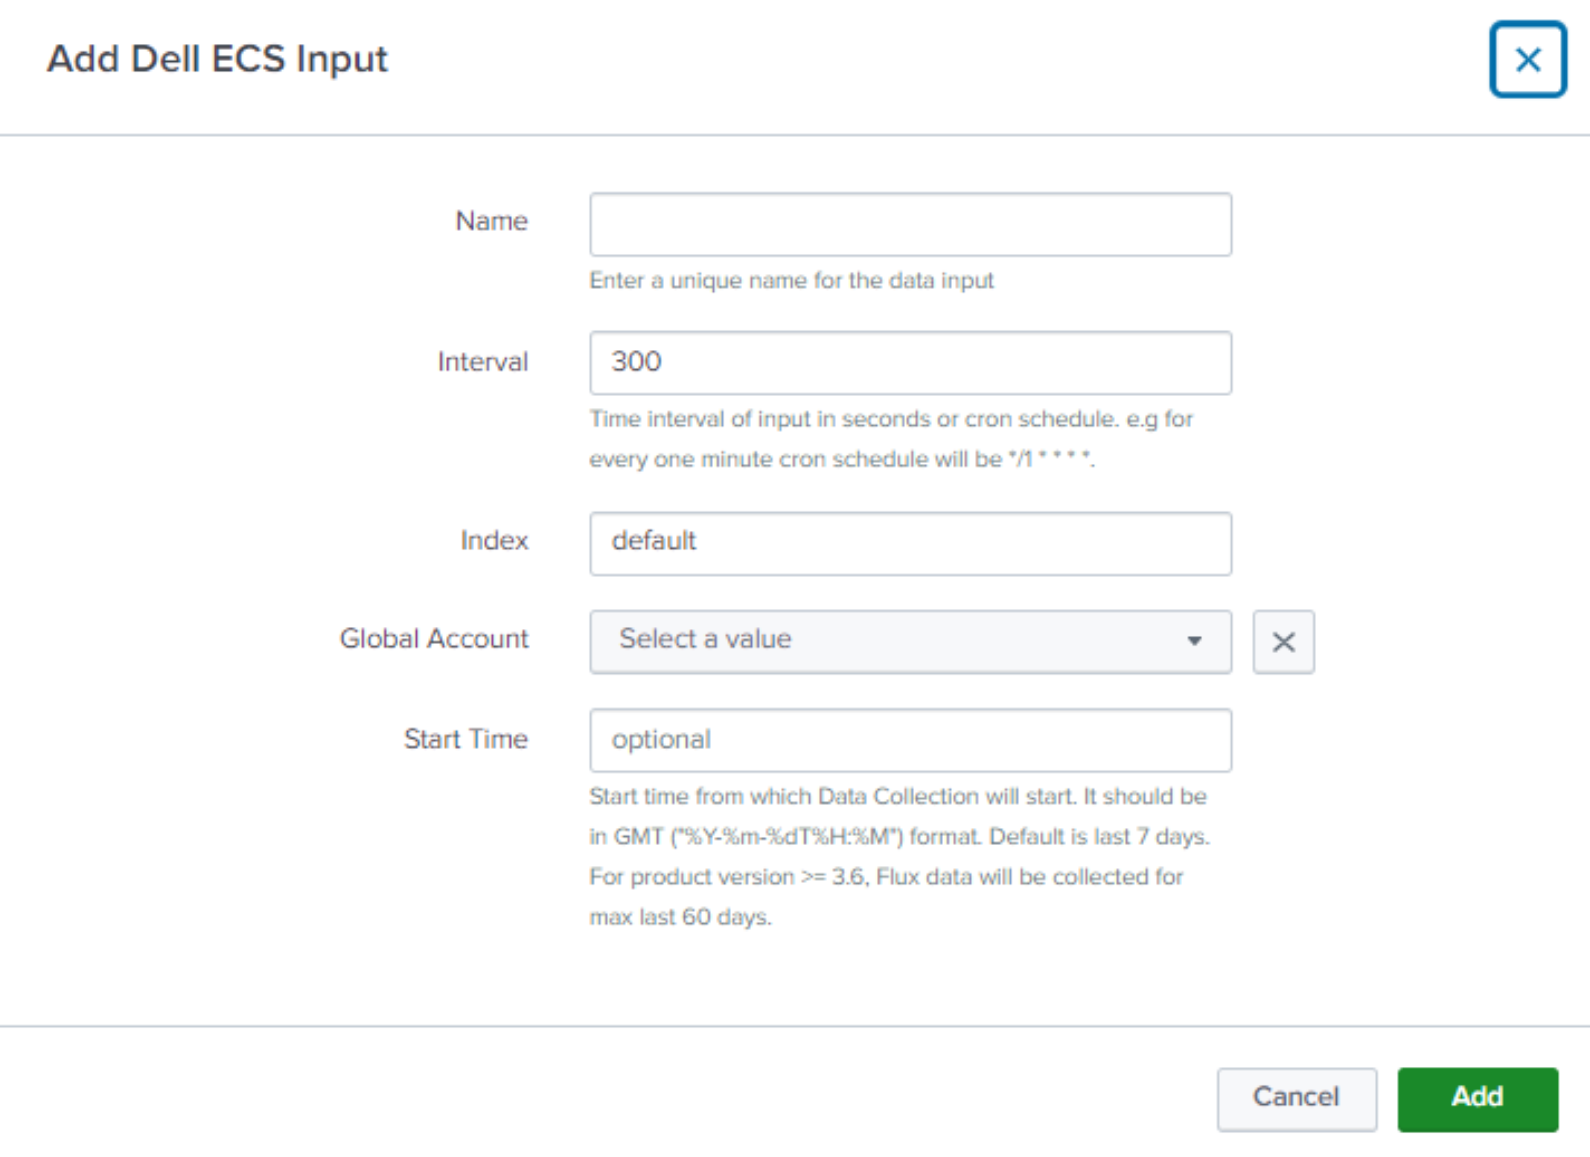
Name: Enter a unique name for the Input (VDC1, VDC1_Namespace, VDC1_Buckets).
Interval: Keep the default or enter a new interval.
Index: Select the index to store the ECS data (use the index created in Create an index to store ECS data).
Global Account: This should correspond to the VDC that is created in the Configuration tab.
Start Time: (Optional) Specify when Data Collection should start.
Start Time: (Optional) Specify when Data Collection should start.
Note: For ECS version 3.6 and later, the maximum number of days of historical data that can be collected is 60.
Configure data inputs to receive syslog and access data from the ECS VDCs
Create Data Inputs on the Heavy Forwarder to receive syslog and data access logs from ECS.
Syslog Forwarding
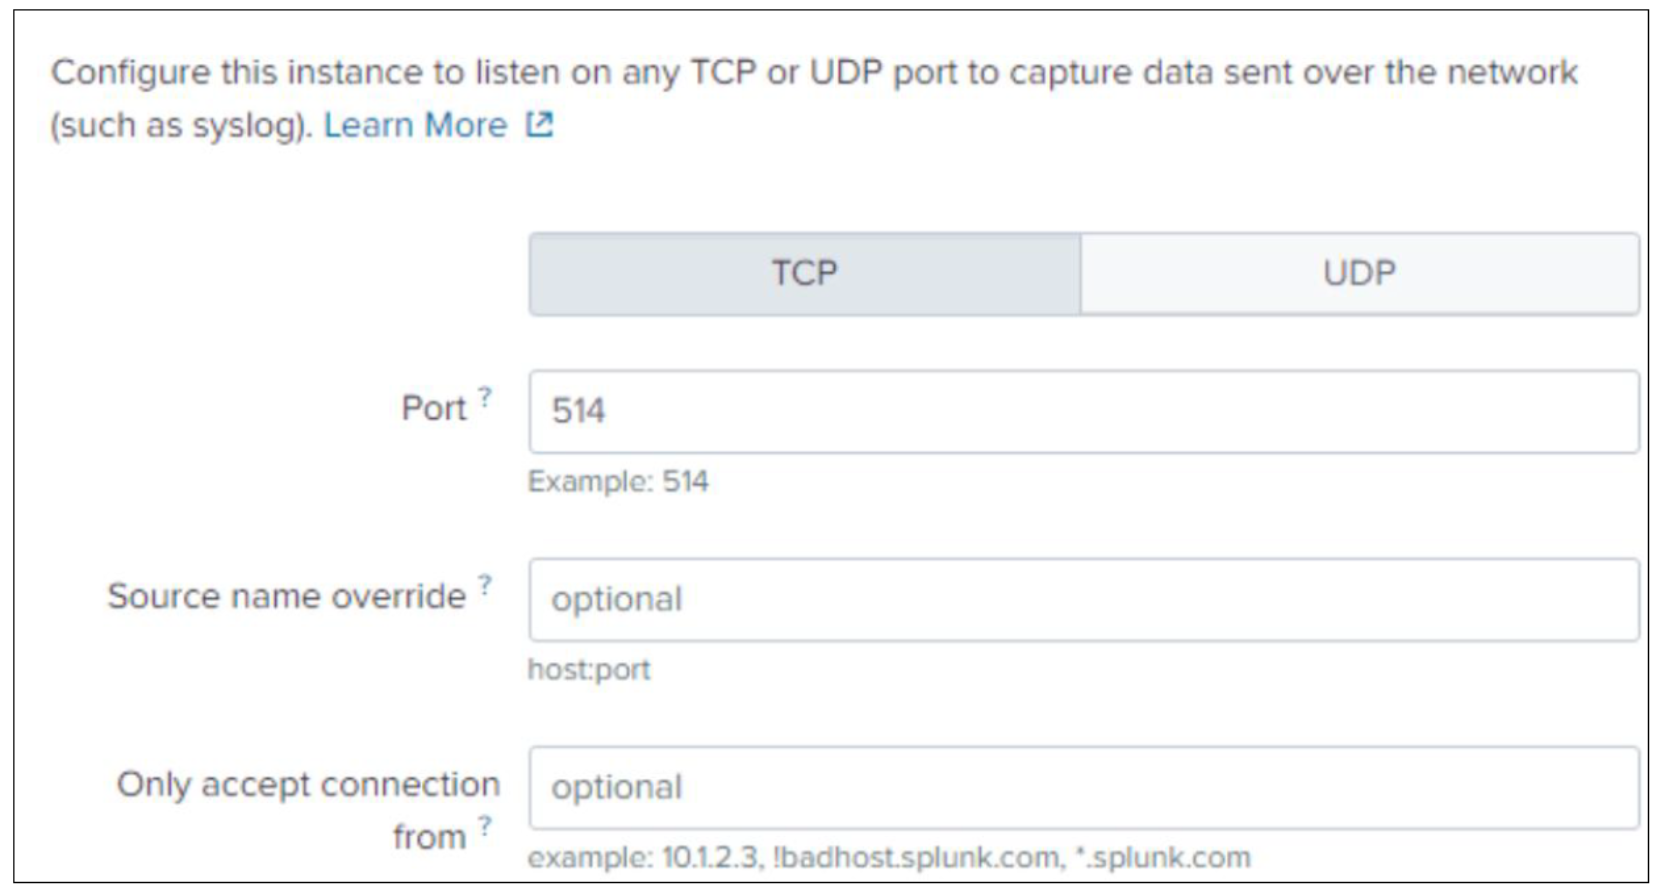
The following example configures a Data Input to receive syslog data from ECS to the Heavy Forwarder using the TCP protocol.
- Click TCP from the Data Inputs menu.
- Click the New Local TCP button at the top-right corner of the page.
- Enter the port on which the forwarder will be listening and optionally override the source name (default will be tcp:<port>) and connections to accept. Click Next.
- Click Next.
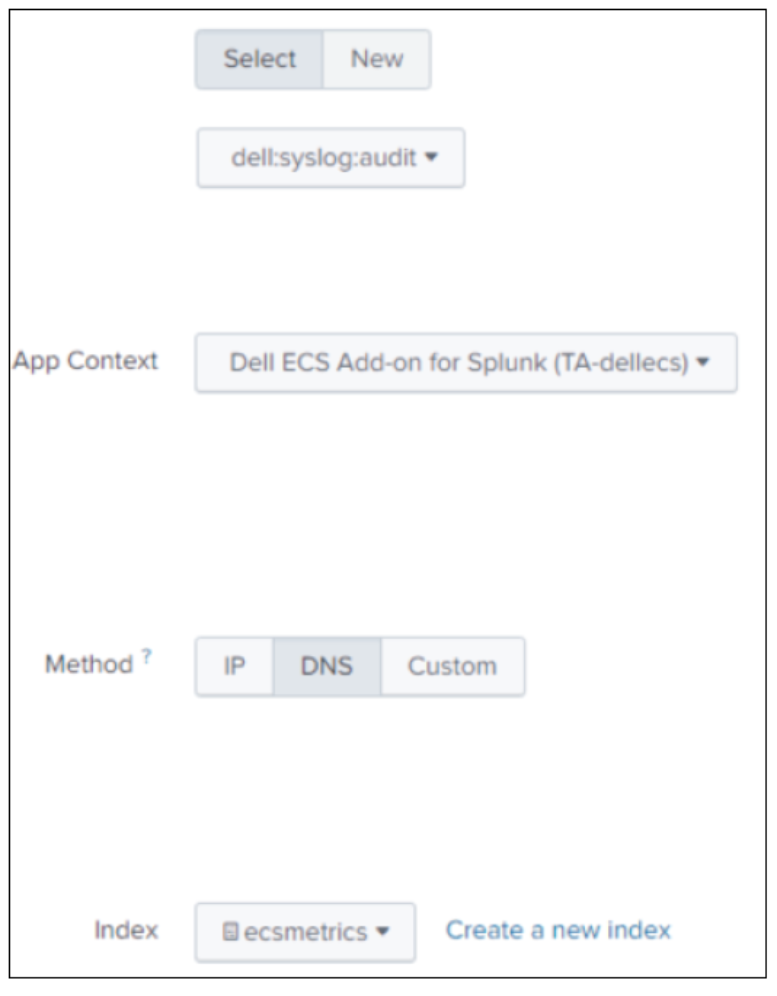
- For Source Type click Select and choose Custom>dell:syslog:audit.
- App Context: Dell ECS Add-on for Splunk (TA-Dellecs).
- Method: Choose the host value to display in searches.
- Index: Choose the index. This should be the same index the collector is using to store ECS data.
- Click the Review button to review the setup, and click Submit.
Access Log Forwarding
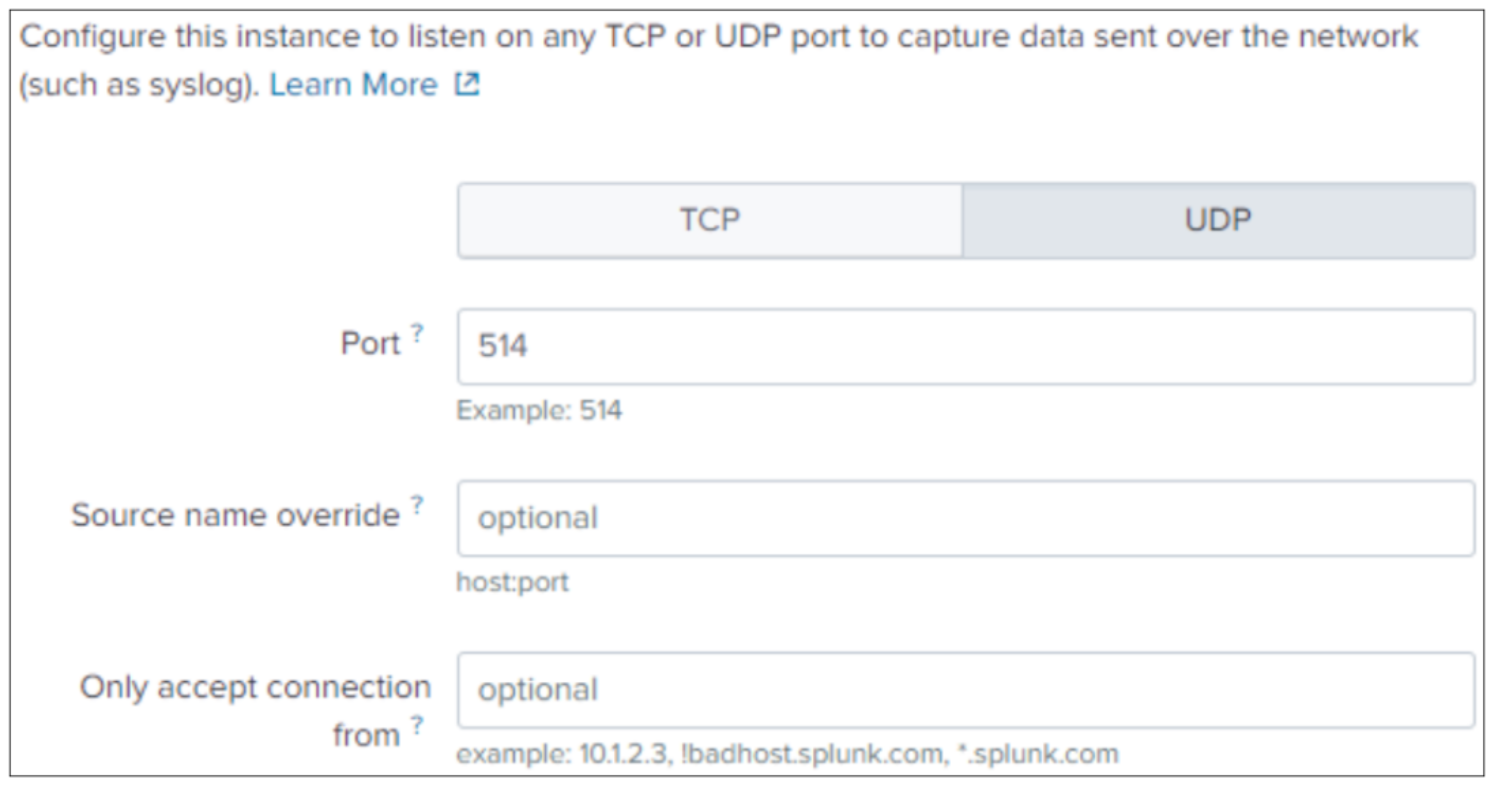
The following example configures a Data Input to receive access logs from ECS to the Heavy Forwarder using the UDP protocol.
- Click UDP from the Data Inputs menu.
- Click the New Local UDP button at the top-right corner of the page.
- Enter the port on which the forwarder will be listening, and optionally override the source name (default will be udp:<port>) and connections to accept. Click Next.
- For Source Type, click Select, and choose Custom>dell:accesslog.
- App Context: Dell ECS Add-on for Splunk (TA-Dellecs).
- Method: Choose the host value to display in searches.
- Index: Choose the index. This should be the same index the TA is using to store ECS data.
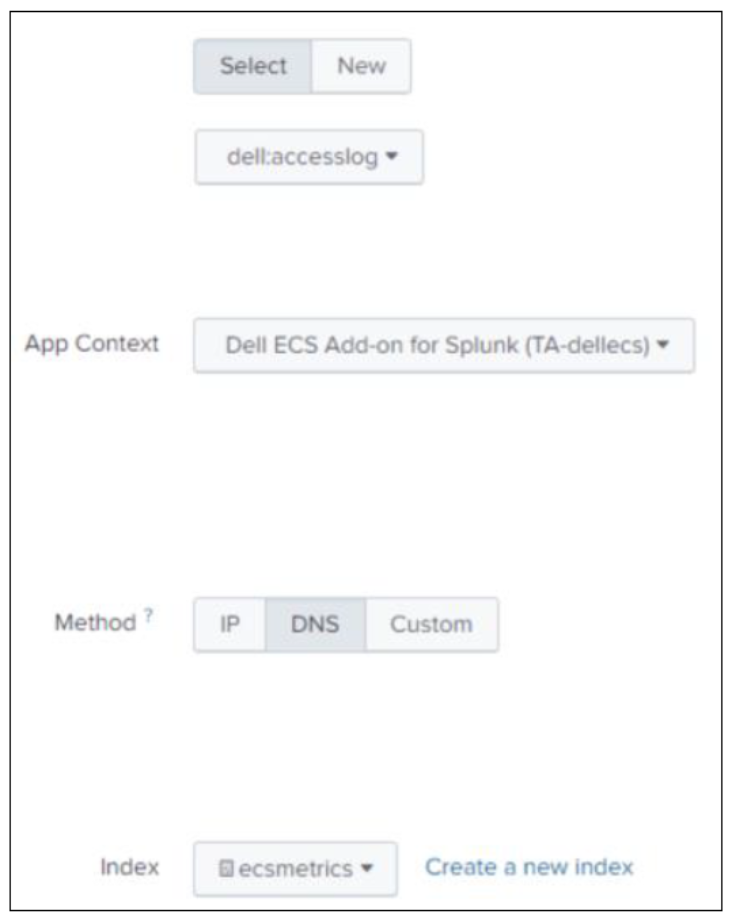
- Click the Review button to review the setup, and click Submit'
Configure syslog and rsyslog on the ECS VDCs
Configure ECS to forward syslogs to the Heavy Forwarder
- Log in to the ECS Web Portal, and go to Settings > Event Notifications > Syslog.
- Click the New Server button.
- Select the Protocol (must match the protocol defined in the Splunk Data input that was previously created).
- Enter the FQDN or IP of the Heavy Forwarder.
- Enter the port number to forward data to (must match the port number defined in the Splunk Data Input that was previously created).
- Enter the severity.
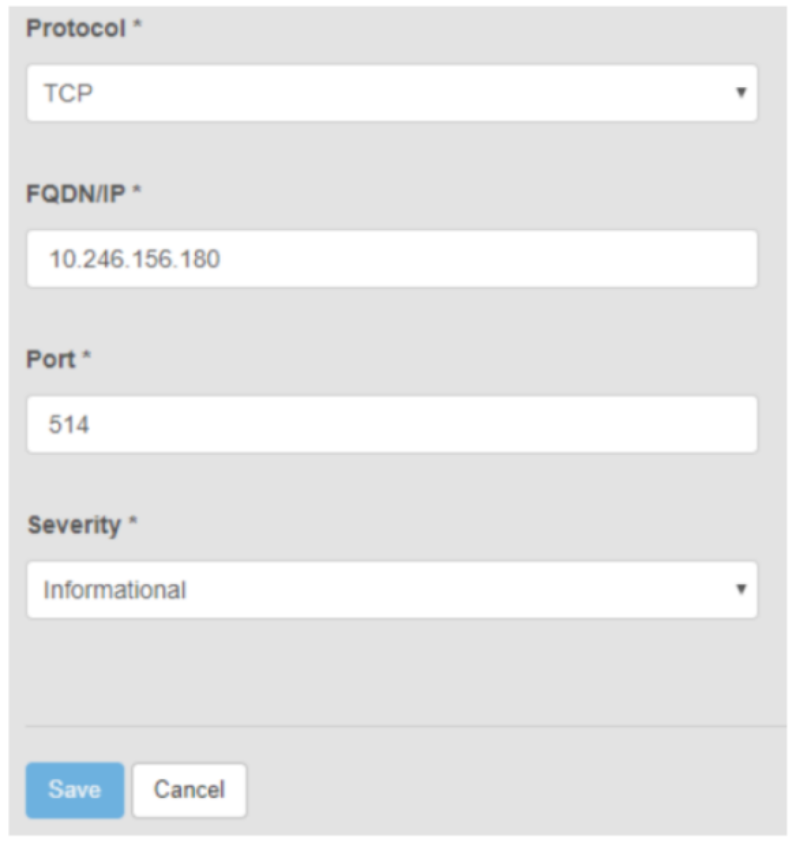
- Click Save.
Configure ECS to forward Data Access logs to the Heavy Forwarder
Note: For ECS 3.4 and earlier, you must request an RPQ to configure data access forwarding on the ECS VDC. Contact your local account team to submit the RPQ.
Forwarding of the data access logs can be self-configured when using ECS 3.5 and later. See the knowledge base article ECS How to Export ECS access logs to external SYSLOG target for instructions.
The Port and Protocol must match the Data Input which was created to receive data access logs. The Target is the IP or FQDN of the Heavy Forwarder or indexers.
Note: These changes may not persist after operating system upgrades. It is advised that the settings are verified after an upgrade.
Install and configure the Dell ECS App for Splunk
The App is installed on the Search Head. It can be installed through the UI or by unpacking it from the CLI.
Install from the UI
- Log in to Splunk Web, and go to Apps > Manage Apps.
- Click install app from file.
- Click Choose file, and select the Dell ECS App installation file.
- Click Upload.
- Restart Splunk.
Install from the CLI
- Transfer the App package to the Search Head.
- SSH to the server.
- Use the following command to unpack the file:
tar xvzf <name of ECS App Package> -C /$SPLUNK_HOME/etc/apps/
- Restart Splunk.
Configure the Base value
- Go to Apps > Manage Apps.
- Select the filter for Dell ECS App for Splunk, and click Actions > Set up.
- Set up the base value, and click Save.
For example, If the base value is 2, 1024 bytes will be converted to 1 KiB. If the base value is 10, 1000 Bytes will be converted to 1 KB.
Configure the index name for the Macro
- Go to Settings > Advanced search > Search macros.
- Select the filter for Dell_ECS_index, and click Dell_ECS_index under the name.
- Edit the macro definition (index = <index name>).
Note: This index should be the same index that was created in Create an index to store ECS data and used to configure the Technology Add-on.
- Click Save.
Validate that data is getting collected
To view the data that is logged by the Dell ECS Add-on for Splunk, click the Search tab, and search for the Dell_ECS_index macro.
Go to the Splunk App for ECS on the Splunk Search Head where the app was installed, and click the application.

Verify that each VDC that was configured is displayed in the VDC drop-down menu.
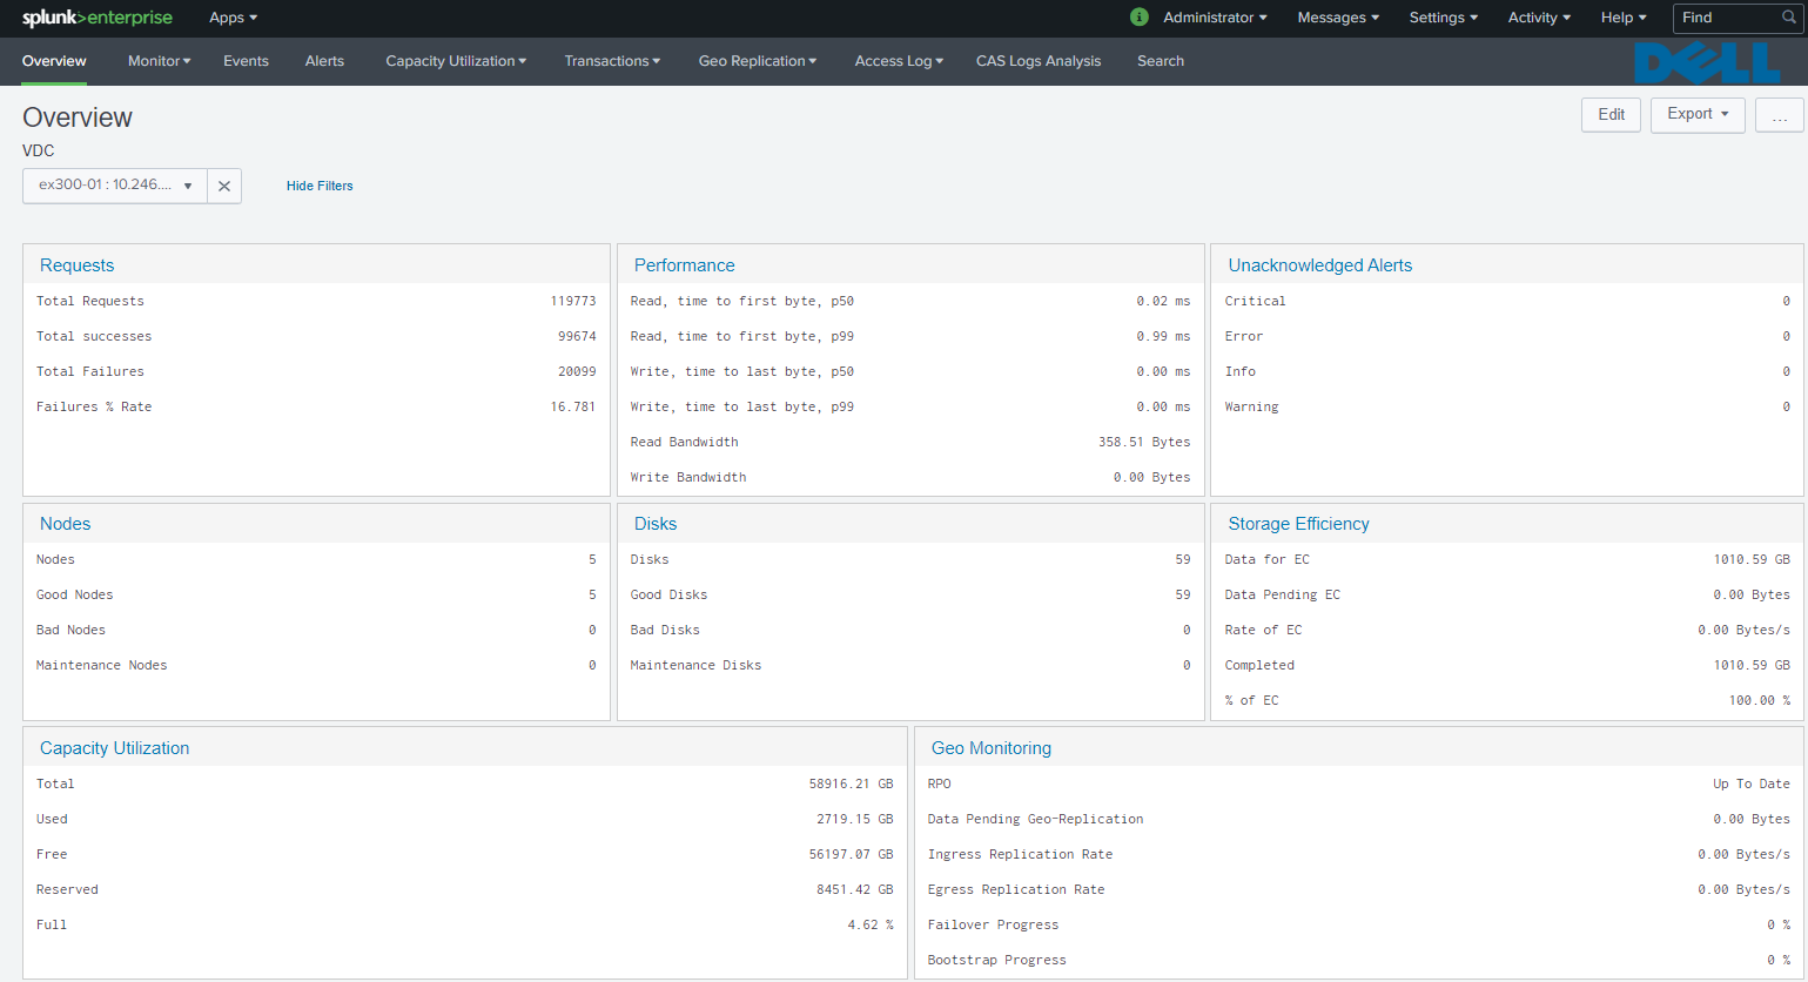
Note: Because Data Collection for the overview page looks back 24 hours, data may not be displayed immediately.
If dashboards are not populated, go to the search field, go to Settings > Searches, Reports, and Alerts, and run the dell_vdc_list saved search.
