PowerEdge system details – Performance
PowerEdge system details – Performance
-
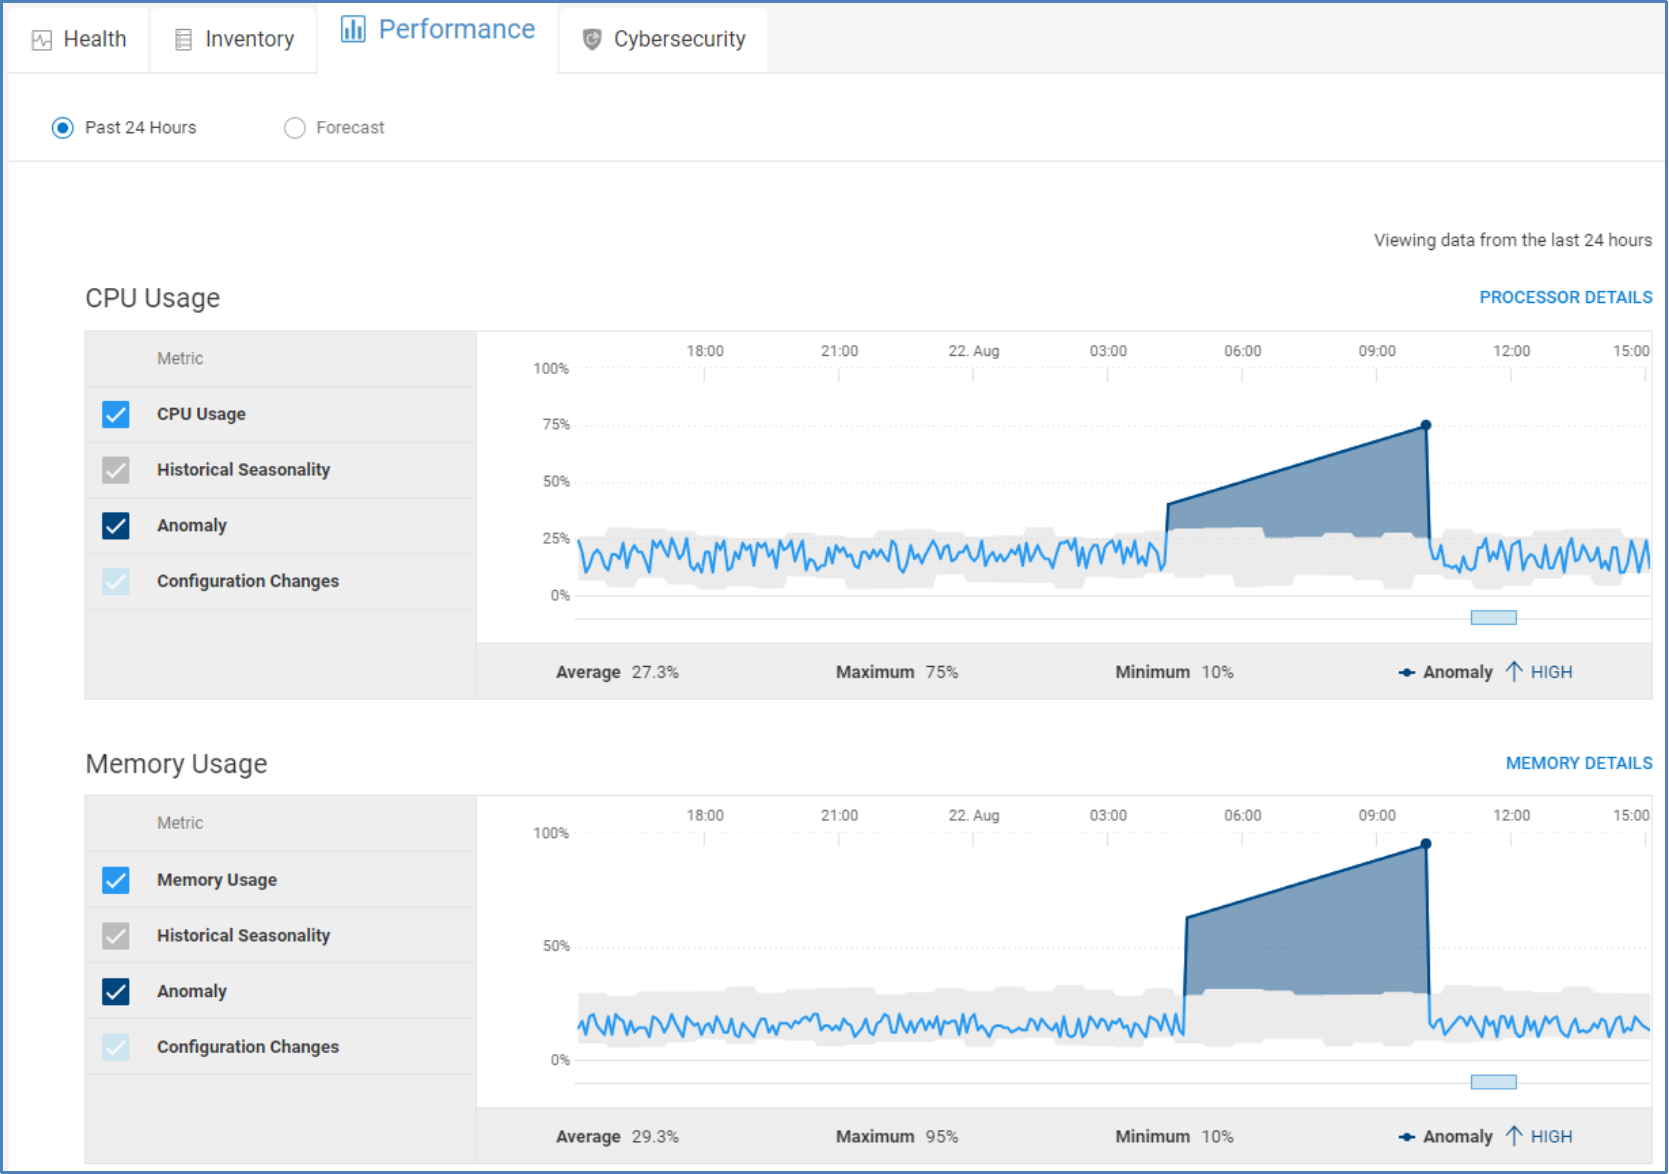
The Performance tab provides 24-hour charts for key performance metrics including:
- CPU Usage
- Memory Usage
- SYS Usage
- System Board IO Usage
- CPU Temperature
- System Inlet Temperature
- System Net Airflow
- Power Consumption
Each chart provides the average, minimum and maximum values of the metric during the time period. Performance anomalies are highlighted in the charts as dark blue shaded areas. Configuration changes are identified with blue rectangles along the X-axis. Clicking the rectangle opens a window that provides details about the configuration change. The following is an example of the CPU and Memory Usage chart.
Note: Available metrics vary based on license type, hardware, and firmware levels. See the CloudIQ section of the OpenManage Portfolio Software Licensing Guide for additional details.
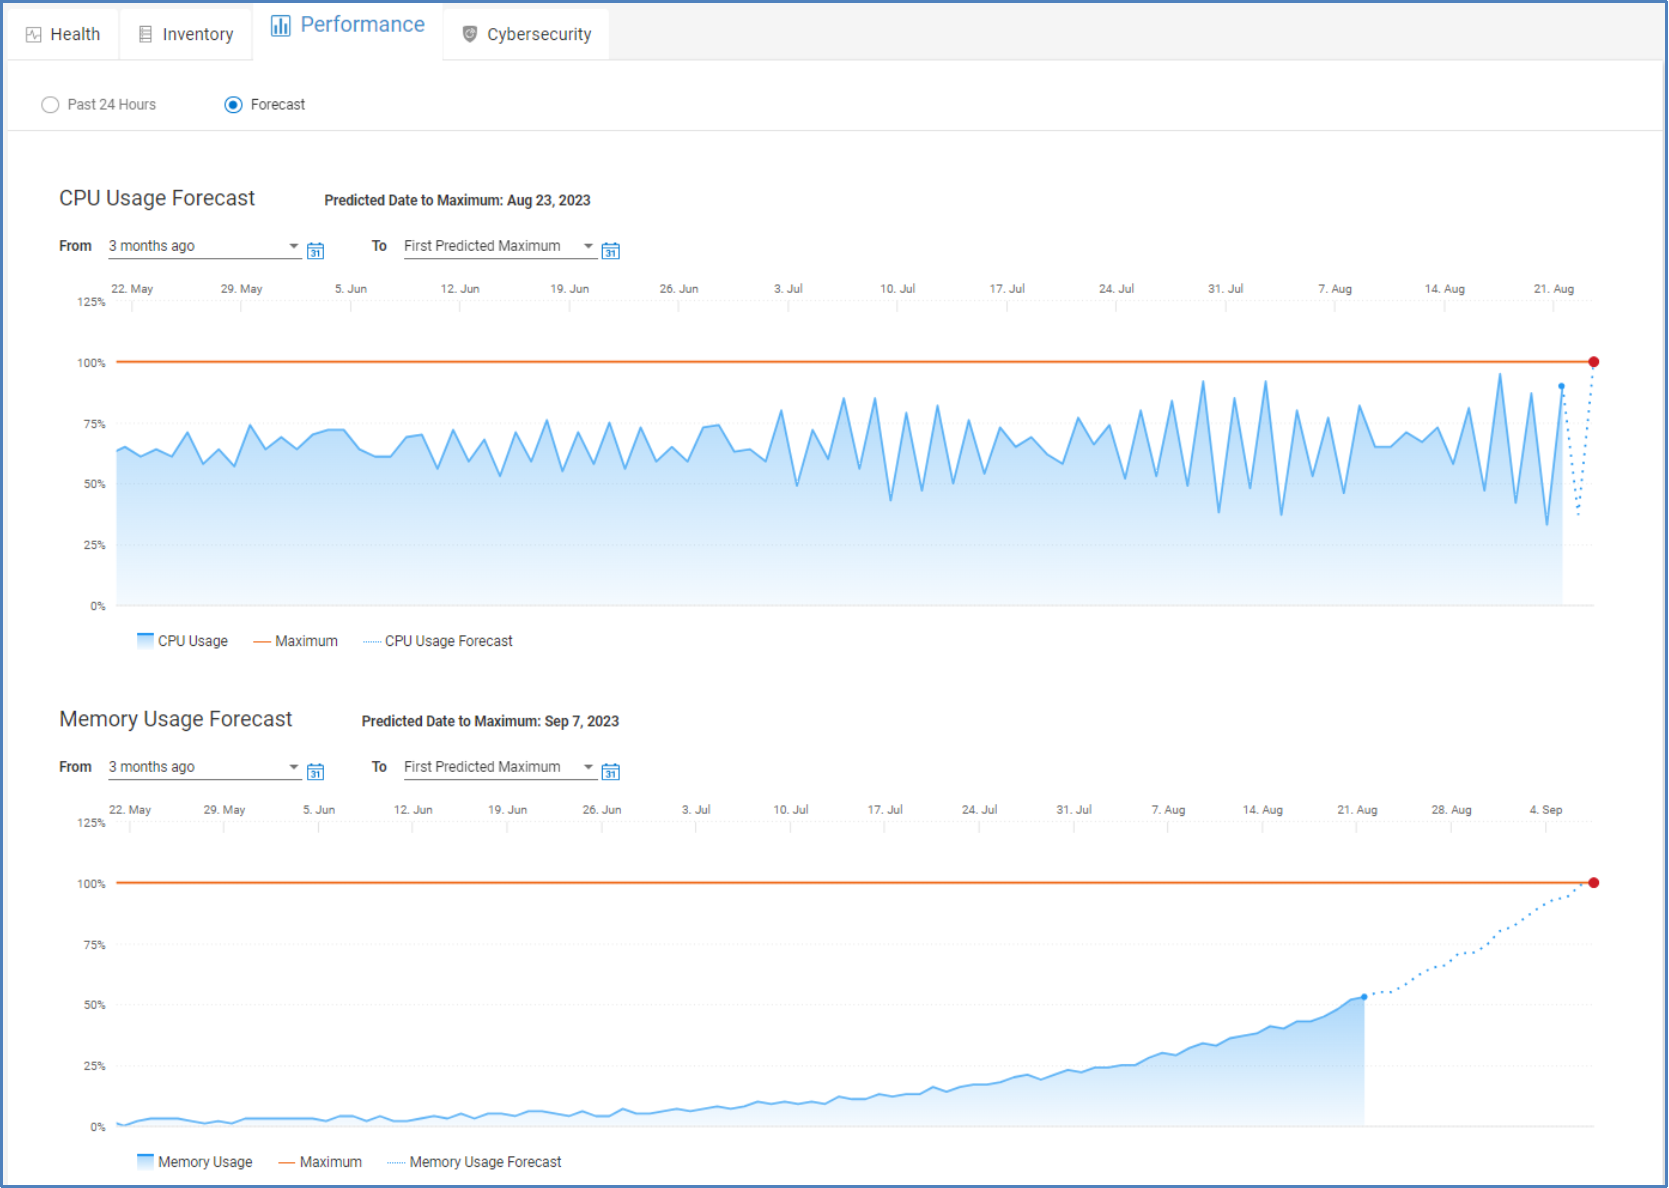
CloudIQ also provides performance forecasting charts for PowerEdge. The forecasting charts are available for:
- CPU Usage
- Memory Usage
- System Usage
- IO Usage
CloudIQ uses predictive analytics to understand the historical trends and usage and determine when these resources will reach their maximum value. By identifying when a resource will be fully utilized, CloudIQ helps with workload planning, allowing users to plan to add additional resources to a server or migrate certain workloads to lesser utilized systems.