


Comparison of Top Accelerators from Dell Technologies’ MLPerf™ Inference v3.0 Submission
Fri, 21 Apr 2023 21:43:39 -0000
|Read Time: 0 minutes
Abstract
Dell Technologies recently submitted results to MLPerfTM Inference v3.0 in the closed division. This blog highlights the NVIDIA H100 PCIe GPU and compares the results to the NVIDIA A100 PCIe GPU with the PCIe form factor held constant.
Introduction
MLPerf Inference v3.0 submission falls under the benchmarking pillar of the MLCommonsTM consortium with the objective to make fair comparisons across server configurations. Submissions that are made to the closed division warrant an equitable comparison of the systems.
This blog highlights the closed division submissions Dell Technologies made with the NVIDIA A100 GPU using the PCIe (peripheral component interconnect express) form factor. The PCIe form factor is an interfacing standard for connecting various high-speed components in hardware such as a computer or a server. Servers include a certain number of PCIe slots in which to insert GPUs or other additional cards. Note that there are different physical configurations for the slots to indicate the number of lanes for data to travel to and from the PCIe card. The NVIDIA H100 GPU is truly the latest and greatest GPU with NVIDIA AI Enterprise included; it is a dual-slot air cooled PCIe generation 5.0 GPU. This GPU runs at a memory bandwidth speed of over 2,000 megabits per second and up to seven Multi-Instance GPUs at 10 gigabytes each. The NVIDIA A100 80 GB GPU is a dual-slot PCIe generation 4.0 GPU that runs at a memory bandwidth speed of over 2,000 megabits per second.
NVIDIA H100 PCIe GPU and NVIDIA A100 PCIe GPU comparison
In addition to making a submission with the NVIDIA A100 GPU, Dell Technologies made a submission with the NVIDIA H100 GPU. To make a fair comparison, the systems were identical and the PCIe form factor was held constant.
Platform | Dell PowerEdge R750xa (4x A100-PCIe-80GB, TensorRT) | Dell PowerEdge R750xa (4x H100-PCIe-80GB, TensorRT) |
Round | V3.0 | |
MLPerf System ID | R750xa_A100_PCIe_80GBx4_TRT | R750xa_H100_PCIe_80GBx4_TRT |
Operating system | CentOS 8.2 | |
CPU | Intel Xeon Gold 6338 CPU @ 2.00 GHz | |
Memory | 1 TB | 1 TB |
GPU | NVIDIA A100-PCIe-80GB | NVIDIA H100-PCIe-80GB |
GPU form factor | PCIe | |
GPU memory configuration | HBM2e | |
GPU count | 4 | |
Software stack | TensorRT 8.6 CUDA 12.0 cuDNN 8.8.0 Driver 525.85.12 DALI 1.17.0 | TensorRT 8.6 CUDA 12.0 cuDNN 8.8.0 Driver 525.60.13 DALI 1.17.0 |
Table 1: Software stack of submissions made on NVIDIA A100 PCIe and NVIDIA H100 PCIe GPUs for MLPerf Inference v3.0 on the Dell PowerEdge R750xa server
In the following figure, the per card numbers are normalized over the NVIDIA A100 GPU results to show a readable comparison of the GPUs on the same system. Across object detection, medical image segmentation, and speech to text and natural language processing, the latest NVIDIA H100 GPU outperforms its predecessor in all categories. Note the outstanding performance of the Dell PowerEdge R750xa server with NVIDIA H100 GPUs with the BERT benchmark in the high accuracy mode. With the advancements in generative artificial intelligence, the Dell PowerEdge R750xa server is a versatile, reliable, and high performing platform.
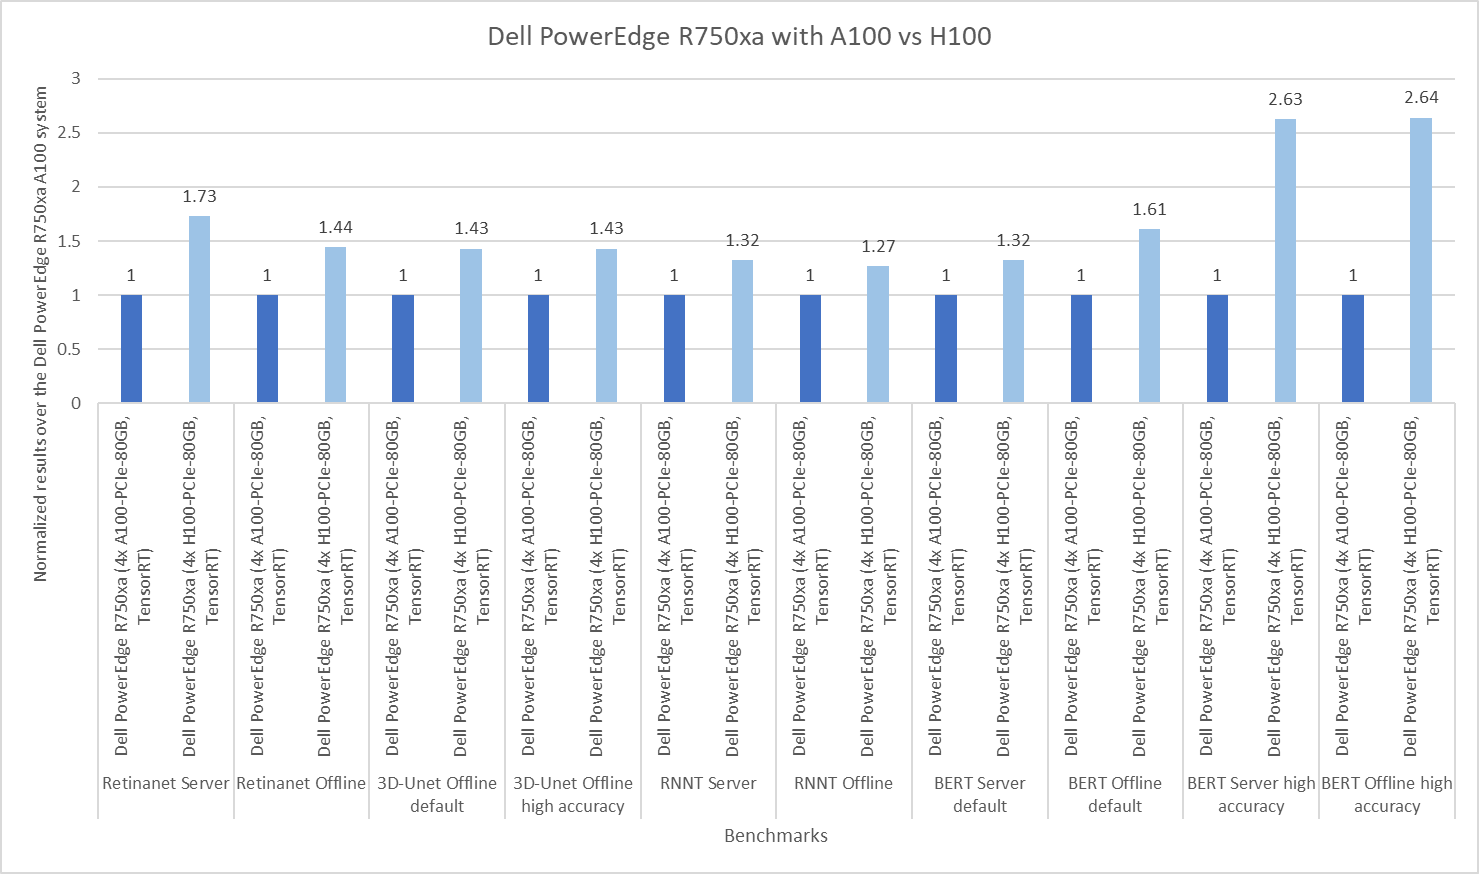
Figure 1: Normalized per GPU comparison of NVIDIA A100 and NVIDIA H100 GPUs on the Dell PowerEdge R750xa server
The following figures show absolute numbers for a comparison of the NVIDIA H100 and NVIDIA A100 GPUs.
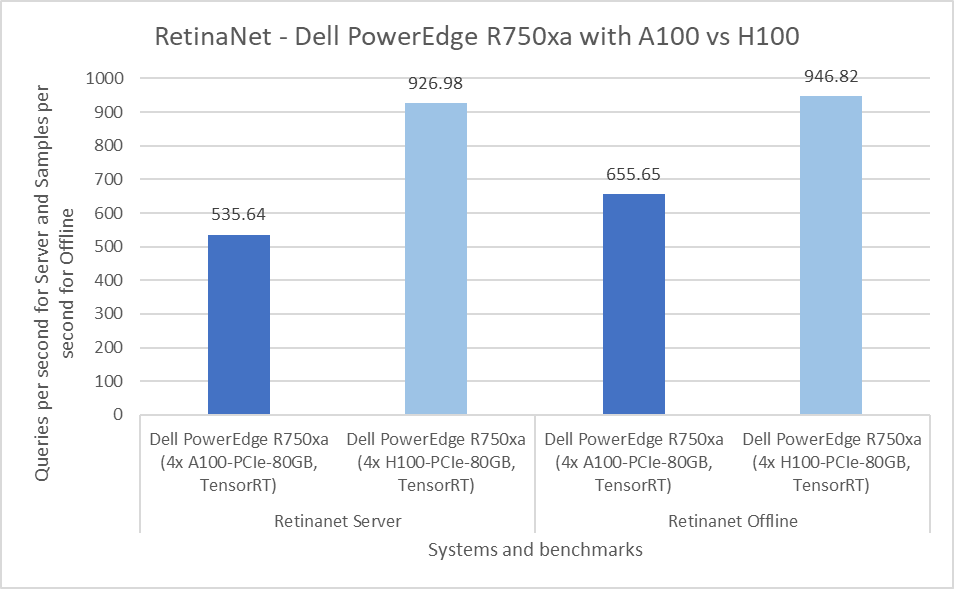
Figure 2: Per GPU comparison of NVIDIA A100 and NVIDIA H100 GPUs for RetinaNet on the PowerEdge R750xa server
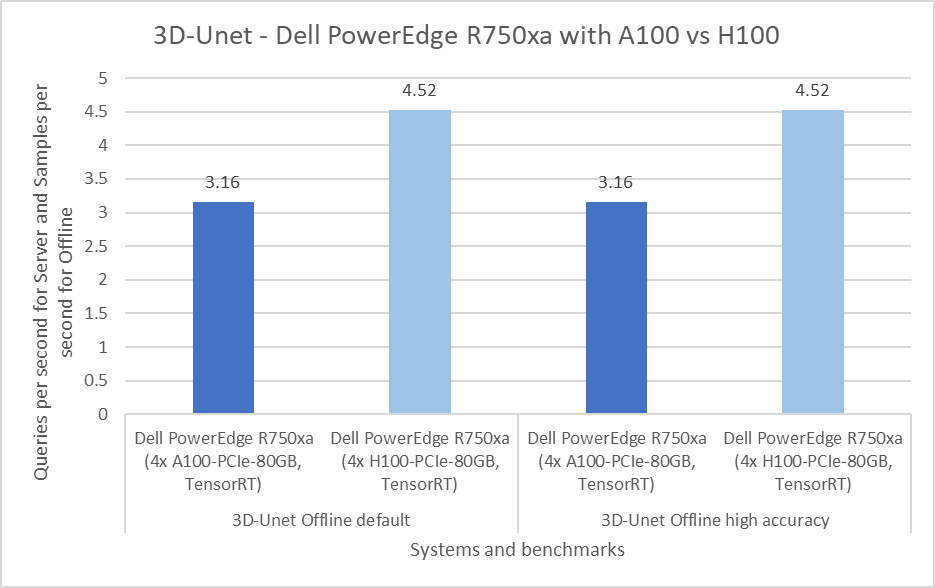
Figure 3: Per GPU comparison of NVIDIA A100 and NVIDIA H100 GPUs for 3D-Unet on the PowerEdge R750xa server
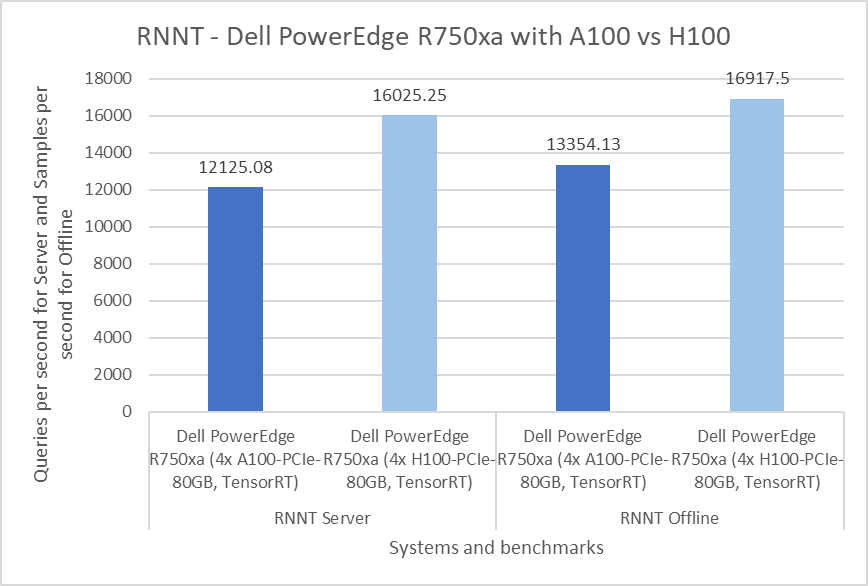
Figure 4: Per GPU comparison of NVIDIA A100 and NVIDIA H100 GPUs for RNNT on the PowerEdge R750xa server
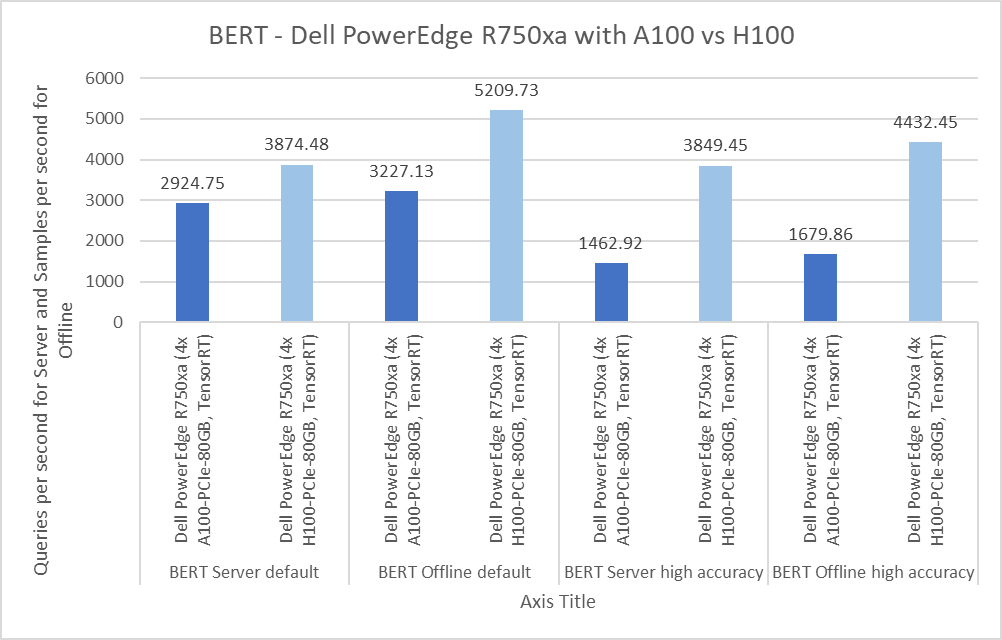
Figure 5: Per GPU comparison of NVIDIA A100 and NVIDIA H100 GPUs for BERT on the PowerEdge R750xa server
These results can be found on the MLCommons website.
Submissions made with the NVIDIA A100 PCIe GPU
In this round of submissions, Dell Technologies submitted results on the PowerEdge R750xa server packaged with four NVIDIA A100 80 GB PCIe GPUs. In previous rounds, the PowerEdge R750xa server showed outstanding performance across all the benchmarks. For a deeper dive of a previous round's submission, check out our blog from MLPerf Inference v2.0. From the previous round of MLPerf Inference v2.1 submissions, Dell Technologies submitted results on an identical system. However, across the two rounds of submissions, the main difference is the upgrades in the software stack, as described in the following table:
Platform | Dell PowerEdge R750xa (4x A100-PCIe-80GB, TensorRT) | Dell PowerEdge R750xa (4x A100-PCIe-80GB, TensorRT) |
Round | V3.0 | V2.1 |
MLPerf System ID | R750xa_A100_PCIe_80GBx4_TRT | |
Operating system | CentOS 8.2 | |
CPU | Intel Xeon Gold 6338 CPU @ 2.00 GHz | |
Memory | 512 GB | |
GPU | NVIDIA A100-PCIe-80GB | |
GPU form factor | PCIe | |
GPU memory configuration | HBM2e | |
GPU count | 4 | |
Software stack | TensorRT 8.6 CUDA 12.0 cuDNN 8.8.0 Driver 525.85.12 DALI 1.17.0 | TensorRT 8.4.2 CUDA 11.6 cuDNN 8.4.1 Driver 510.39.01 DALI 0.31.0 |
Table 2: Software stack for submissions made on the NVIDIA A100 PCIe GPU in MLPerf Inference v3.0 and v2.1
Comparison of PowerEdge R750xa NVIDIA A100 results from Inference v3.0 and v2.1
Object detection
The RetinaNet benchmark falls under the object detection category and uses the OpenImages dataset. The results from Inference v3.0 show a less than 0.05 percent difference in the Server scenario and a 21.53 percent difference in the Offline scenario. A potential reason for this result might be NVIDIA’s optimizations, as outlined in their technical blog.
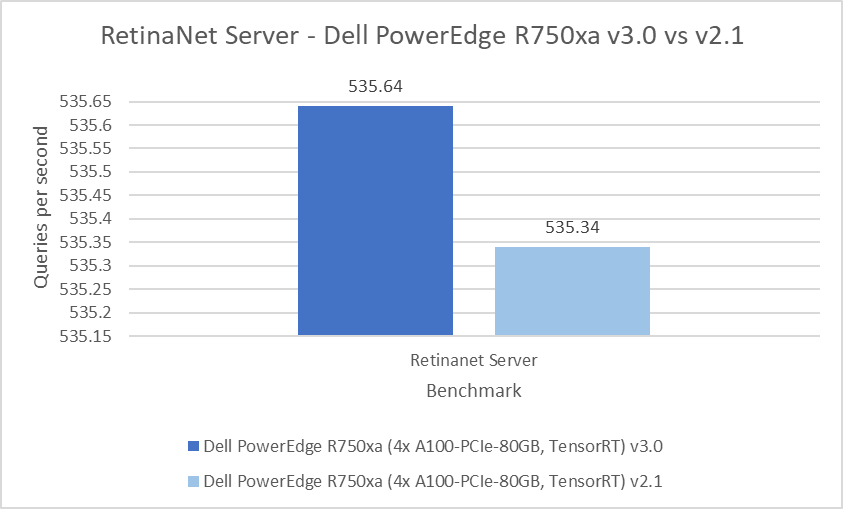
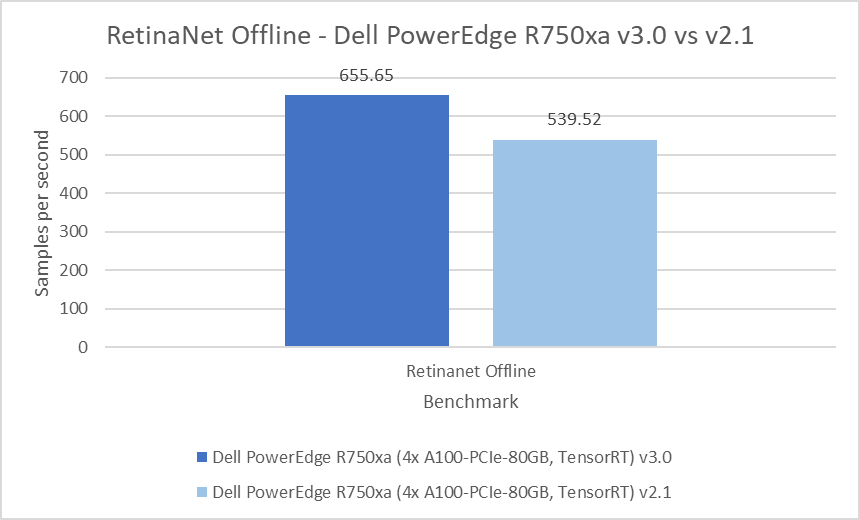
Figure 6: RetinaNet Server and Offline results on the PowerEdge R750xa server from Inference v3.0 and Inference v2.1
Medical image segmentation
The 3D-Unet benchmark performs the KiTS 2019 kidney tumor segmentation task. Across the two rounds of submission, the PowerEdge R750xa server performed consistently well with a 0.3 percent difference in both the default and high accuracy modes.
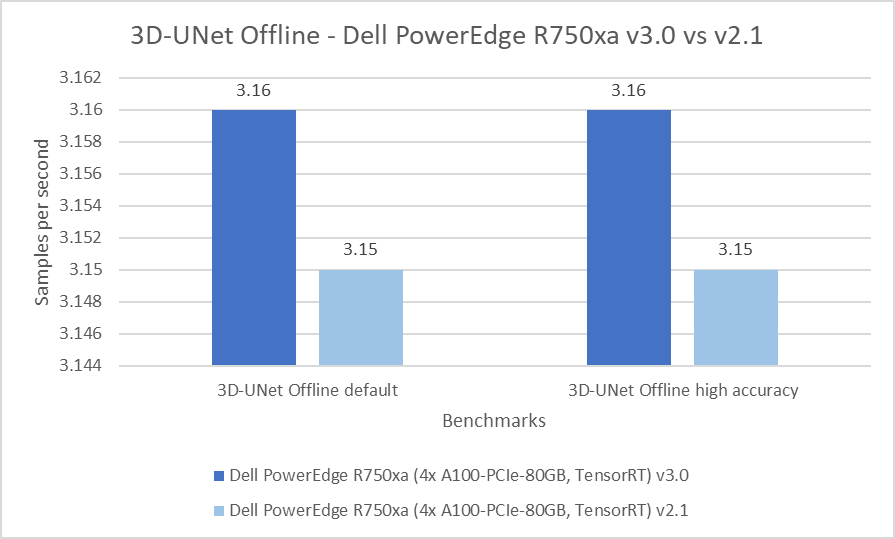
Figure 7: 3D-UNet Offline results on the PowerEdge R750xa server from Inference v3.0 and v2.1
Speech to text
The Recurrent Neural Network Transducers (RNNT) model falls under the speech recognition category. This benchmark accepts raw audio samples and produces the corresponding character transcription. In the Server scenario, the results are within a 2.25 percent difference and 0.41 percent difference in the Offline scenario.

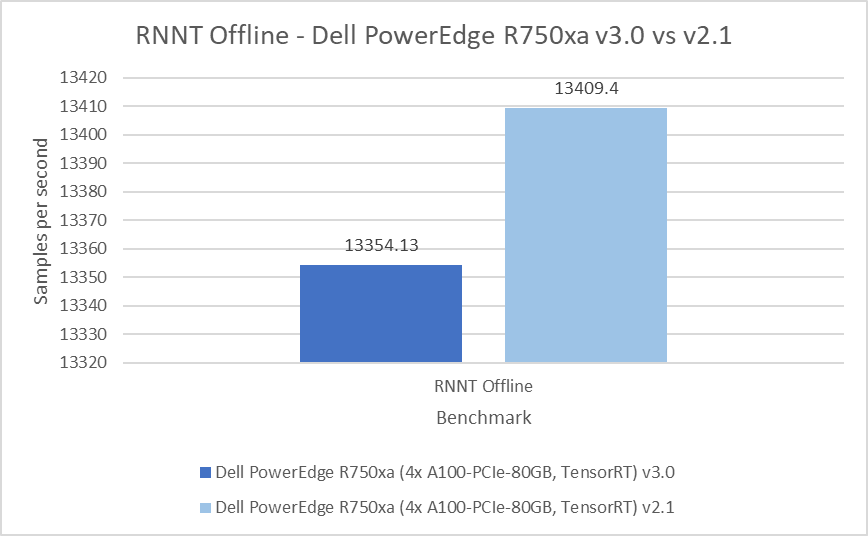
Figure 8: RNNT Server and Offline results on the Dell PowerEdge R750xa server from Inference v3.0 and v2.1
Natural language processing
Bidirectional Encoder Representation from Transformers (BERT) is a state-of-the-art language representational model for Natural Language Processing applications. This benchmark performs the SQuAD question answering task. The BERT benchmark consists of default and high accuracy modes for the Offline and Server scenarios. For the Server scenarios, the default mode results are within a 1.69 percent range and 3.12 percent range for the high accuracy mode. For the Offline scenarios, a similar behavior is noticeable in which the default mode results are within a 0.86 percent range and 3.65 percent range in the high accuracy mode.
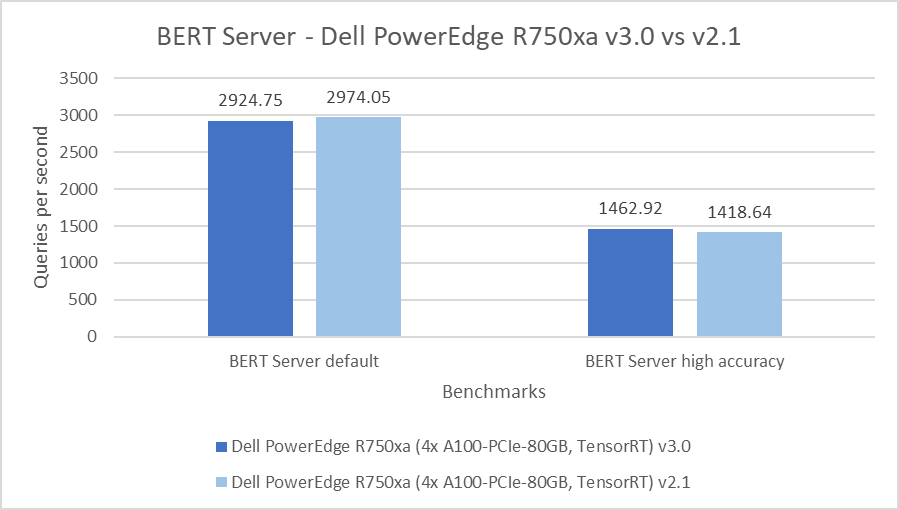
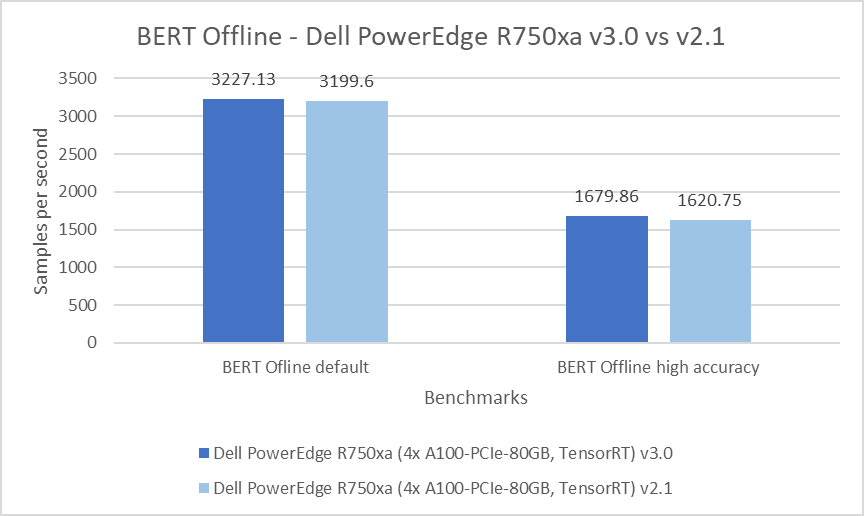
Figure 9: BERT Server and Offline results on the PowerEdge R750xa server from Inference v3.0 and v2.1
Conclusion
Across the various rounds of submissions to the MLPerf Inference benchmark suite, the PowerEdge R750xa server has been a consistent top performer for any machine learning tasks ranging from object detection, medical image segmentation, speech to text and natural language processing. The PowerEdge R750xa server continues to be an excellent server choice for machine learning inference workloads. Customers can take advantage of the diverse results submitted on the Dell PowerEdge R750xa server with the NVIDIA H100 GPU to make an informed decision for their specific solution needs.