


Performance of the Dell PowerEdge R750xa Server for MLPerf™ Inference v2.0
Thu, 21 Apr 2022 18:20:33 -0000
|Read Time: 0 minutes
Abstract
Dell Technologies recently submitted results to the MLPerf Inference v2.0 benchmark suite. The results provide information about the performance of Dell servers. This blog takes a closer look at the Dell PowerEdge R750xa server and its performance for MLPerf Inference v1.1 and v2.0.
We compare the v1.1 results with the v2.0 results. We show the performance difference between the software stack versions. We also use the PowerEdge R750xa server to demonstrate that the v1.1 results from all systems can be referenced for planning an ML workload on systems that are not available for MLPerf Inference v2.0.
PowerEdge R750xa server
Built with state-of-the-art components, the PowerEdge R750xa server is ideal for artificial intelligence (AI), machine learning (ML), and deep learning (DL) workloads. The PowerEdge R750xa server is the GPU-optimized version of the PowerEdge R750 server. It supports accelerators as 4 x 300 W DW or 6 x 75 W SW. The GPUs are placed in the front of the PowerEdge R750xa server allowing for better airflow management. It has up to eight available PCIe Gen4 slots and supports up to eight NVMe SSDs.
The following figures show the PowerEdge R750xa server (source):
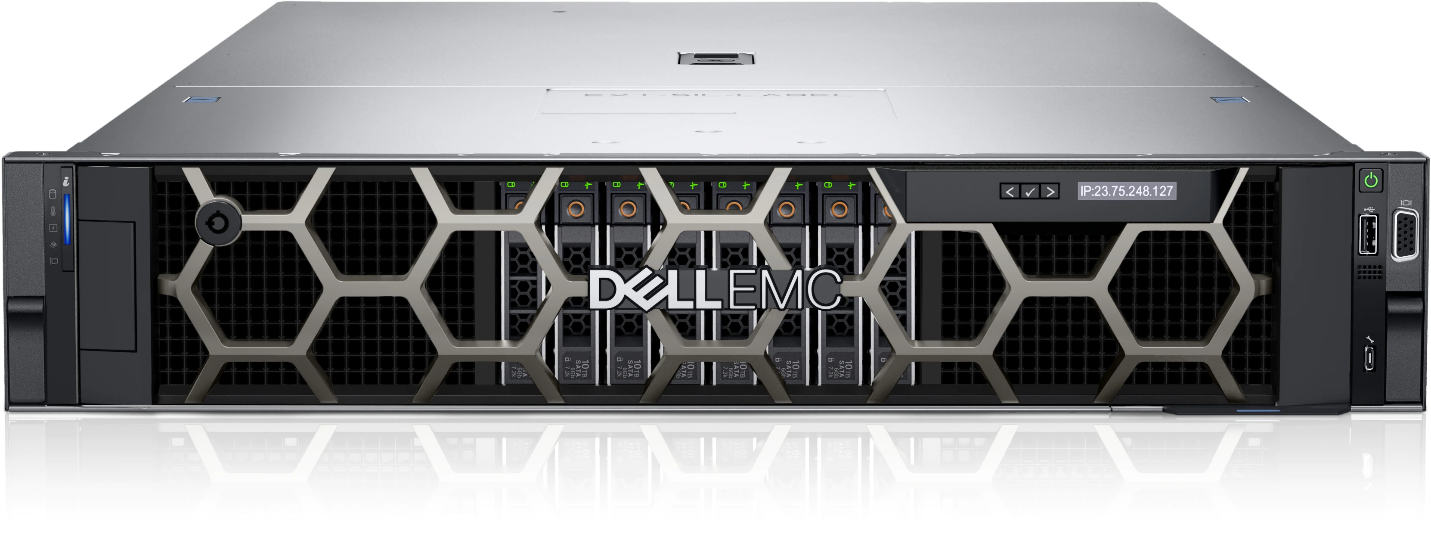
Figure 1: Front view of the PowerEdge R750xa server
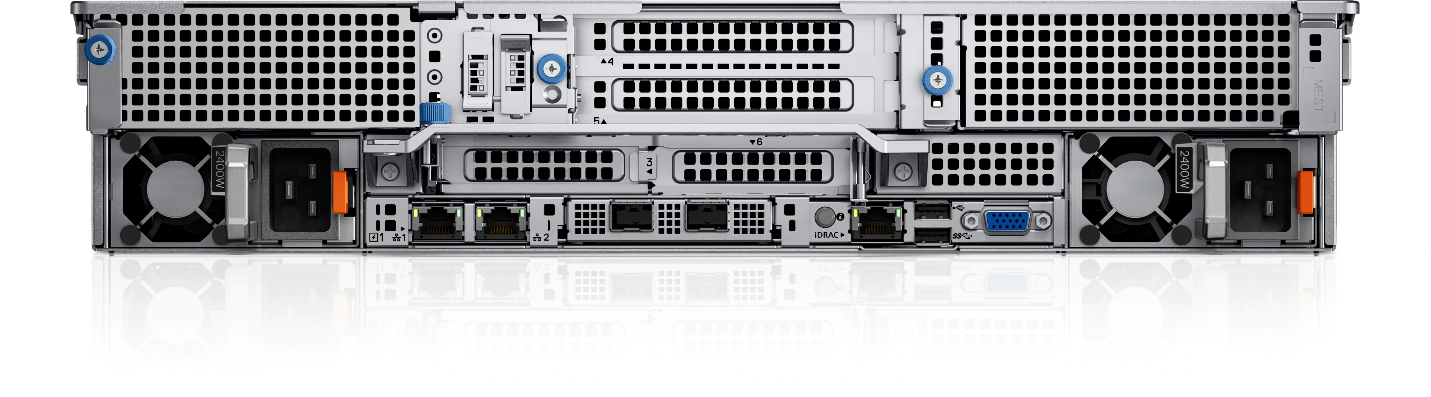
Figure 2: Rear view of the PowerEdge R750xa server
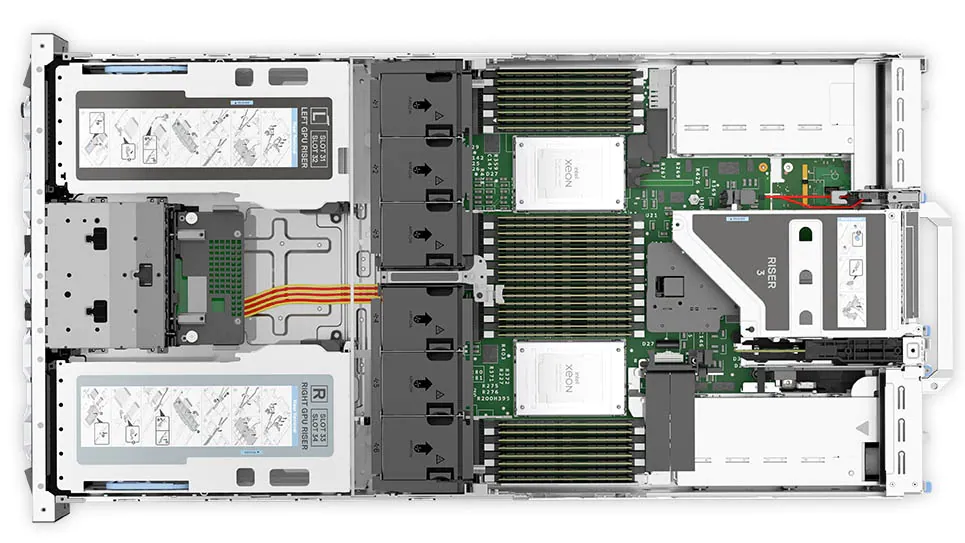
Figure 3: Top view of the PowerEdge R750xa server
Configuration comparison
The following table describes the software stack configurations from the two rounds of submission for the closed data center division:
Table 1: MLPerf Inference v1.1 and v2.0 software stacks
NVIDIA component | v1.1 software stack | v2.0 software stack |
TensorRT | 8.0.2 | 8.4.0 |
CUDA | 11.3 | 11.6 |
cuDNN | 8.2.1 | 8.3.2 |
GPU driver | 470.42.01 | 510.39.01 |
DALI | 0.30.0 | 0.31.0 |
Triton | 21.07 | 22.01 |
Although the software has been updated across the two rounds of submission, performance is consistent, if not better, for the v2.0 submission. For MLPerf Inference v2.0, Triton performance results can be extrapolated from MLPerf Inference v1.1 except for the 3D U-Net benchmark, which is due to a v2.0 dataset change.
The following table describes the System Under Test (SUT) configurations from MLPerf Inference v1.1 and v2.0 of data center inference submissions:
Table 2: MLPerf Inference v1.1 and v2.0 system configuration of the PowerEdge R750xa server
Component | v1.1 system configuration | v2.0 system configuration |
Platform | R750xa 4x A100-PCIE-80GB, TensorRT | R750xa 4xA100 TensorRT |
MLPerf system ID | R750xa_A100-PCIE-80GBx4_TRT | R750xa_A100_PCIE_80GBx4_TRT |
Operating system | CentOS 8.2 | |
CPU | Intel Xeon Gold 6338 CPU @ 2.00 GHz | |
Memory | 1 TB | |
GPU | NVIDIA A100-PCIE-80GB | |
GPU form factor | PCIe | |
GPU count | 4 | |
Software stack | TensorRT 8.0.2 | TensorRT 8.4.0 CUDA 11.6 cuDNN 8.3.2 Driver 510.39.01 DALI 0.31.0 |
In the v1.1 round of submission, Dell Technologies submitted four different configurations on the PowerEdge R750xa server. Although the GPU count of four was maintained, Dell Technologies submitted the 40 GB and the 80 GB versions of the NVIDIA A100 GPU. Additionally, Dell Technologies submitted Multi-Instance GPU (MIG) numbers using 28 instances of the one compute instance of the 10gb memory profile on the 80 GB A100 GPU. Furthermore, Dell Technologies submitted power numbers (MaxQ is a performance and power submission) for the 40 GB version of the A100 GPU and submitted with the Triton server on the 80 GB version of the A100 GPU. A discussion about the v1.1 submission by Dell Technologies can be found in this blog.
Performance comparison of the PowerEdge R70xa server for MLPerf Inference v2.0 and v1.1
ResNet 50
ReNet50 is a 50-layer deep convolution neural network that is made up of 48 convolution layers along with a single max pool and average pool layer. This model is used for computer vision applications including image classification, object detection, and object classification. For the ResNet 50 benchmark, the performance numbers from the v2.0 submission match and outperform in the server and offline scenarios respectively when compared to the v1.1 round of submission. As shown in the following figure, the v2.0 submission results are within 0.02 percent in the server scenario and outperform the previous round by 1 percent in the offline scenario:
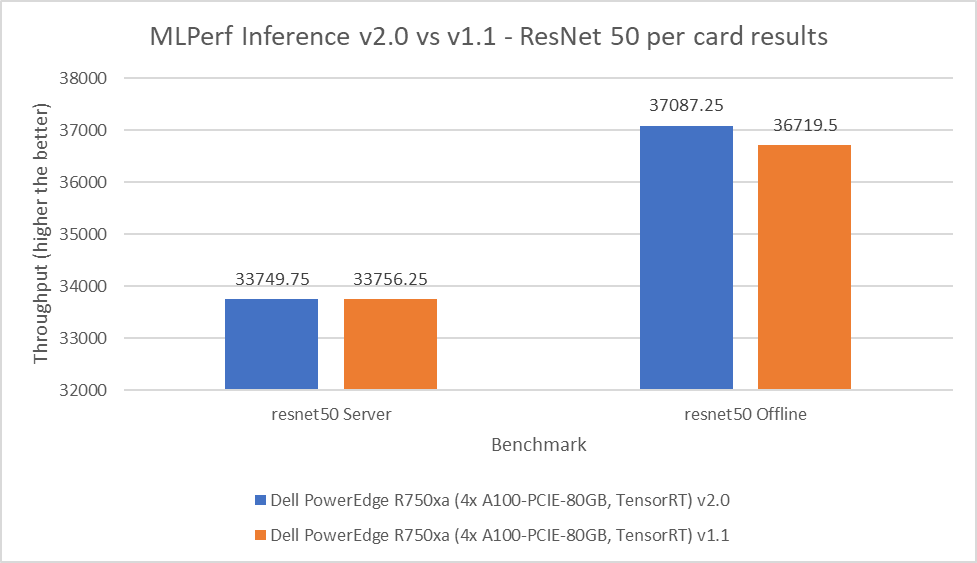
Figure 4: MLPerf Inference v2.0 compared to v1.1 ResNet 50 per card results on the PowerEdge R750xa server
BERT
Bidirectional Encoder Representation from Transformers (BERT) is a state-of-the-art language representational model for Natural Language Processing applications. This benchmark performs the SQuAD question answering task. The BERT benchmark consists of default and high accuracy modes for the offline and server scenarios. In the v2.0 round of submission, the PowerEdge R750xa server matched and slightly outperformed its performance from the previous round. In the default BERT server and offline scenarios, the extracted performance is within 0.06 and 2.33 percent respectively. In the high accuracy BERT server and offline scenarios, the extracted performance is within 0.14 and 1.25 percent respectively.
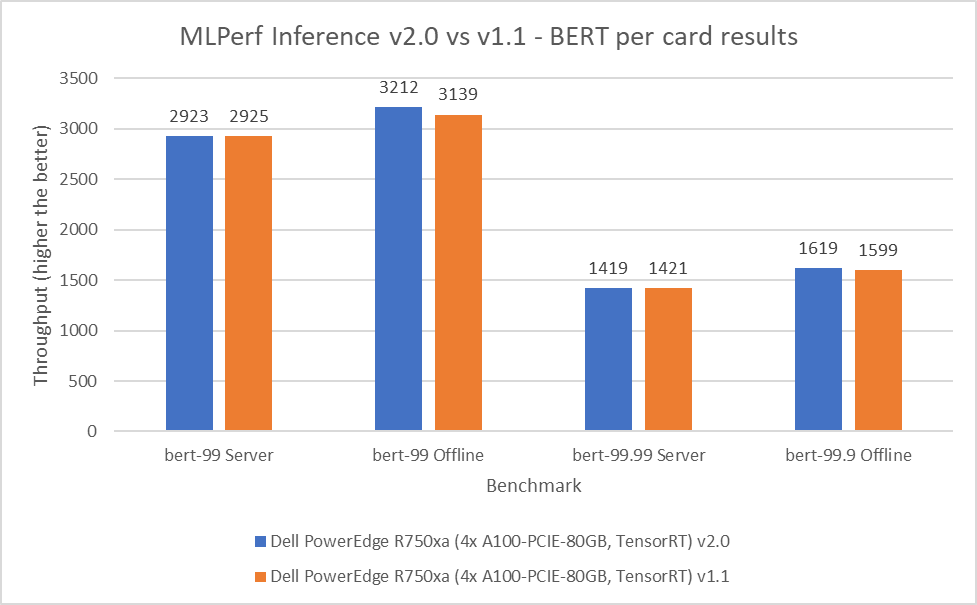
Figure 5: MLPerf Inference v2.0 compared to v1.1 BERT per card results on the PowerEdge R750xa server
SSD-ResNet 34
The SSD-ResNet 34 model falls under the computer vision category. This benchmark performs object detection. For the SSD-ResNet 34 benchmark, the results produced in the v2.0 round of submission are within 0.14 percent for the server scenario and show a 1 percent improvement in the offline scenario.
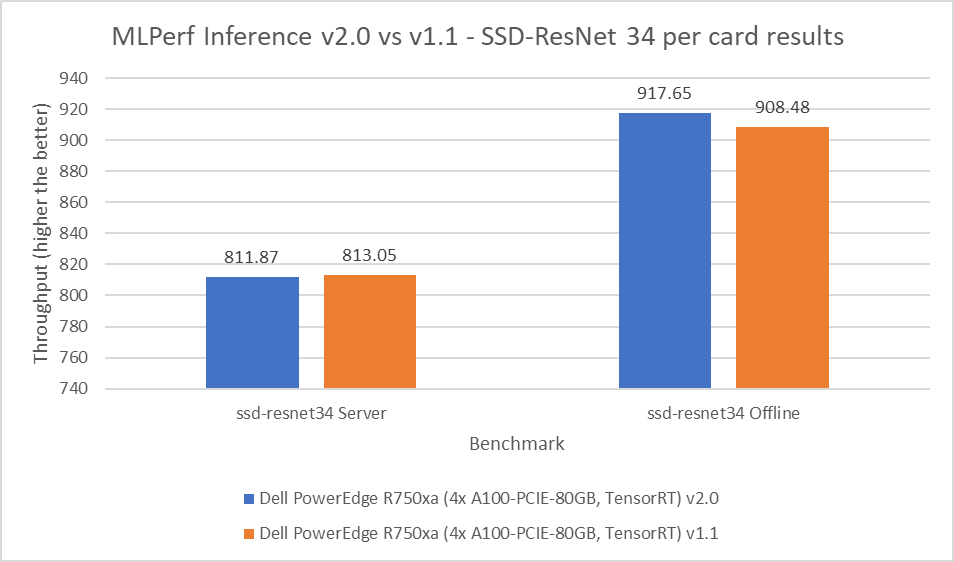
Figure 6: MLPerf Inference v2.0 compared to v1.1 SSD-ResNet 34 per card results on the PowerEdge R750xa server
DLRM
Deep Learning Recommendation Model (DLRM) is an effective benchmark for understanding workload requirements for building recommender systems. This model uses collaborative filtering and predicative analysis-based approaches to process large amounts of data. The DLRM benchmark consists of default and high accuracy modes, both containing the server and offline scenarios. For the server scenario in both the default and high accuracy modes, the v2.0 submissions results are within 0.003 percent. For the offline scenario across both modes, the PowerEdge R750xa server showed a 2.62 percent performance gain.
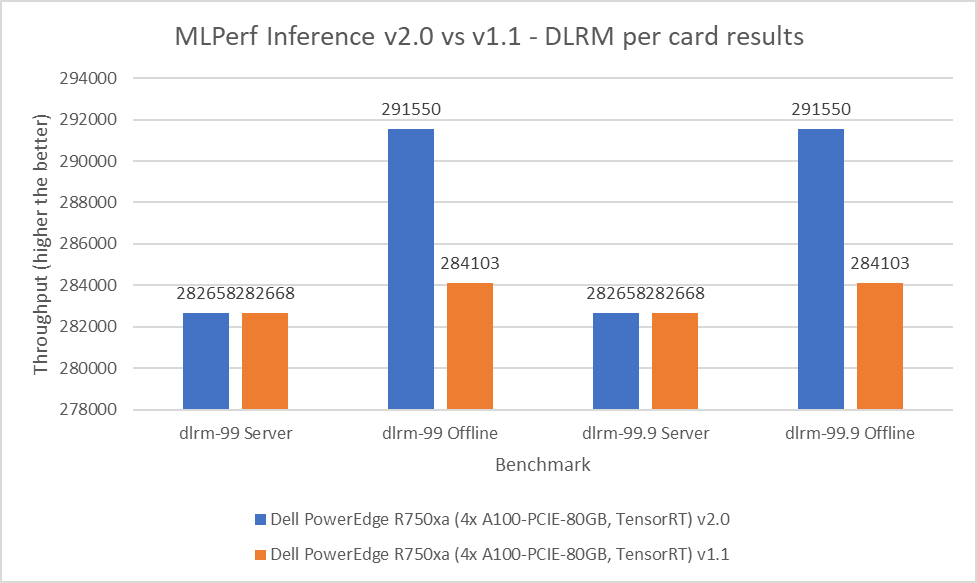
Figure 7: MLPerf Inference v2.0 compared to v1.1 DLRM per card results on the PowerEdge R750xa server
RNNT
The Recurrent Neural Network Transducers (RNNT) model falls under the speech recognition category. This benchmark accepts raw audio samples and produces the corresponding character transcription. For the RNNT benchmark, the PowerEdge R750xa server maintained similar performance behavior within 0.04 percent in the server mode and showing 1.46 percent performance gains in the offline mode.
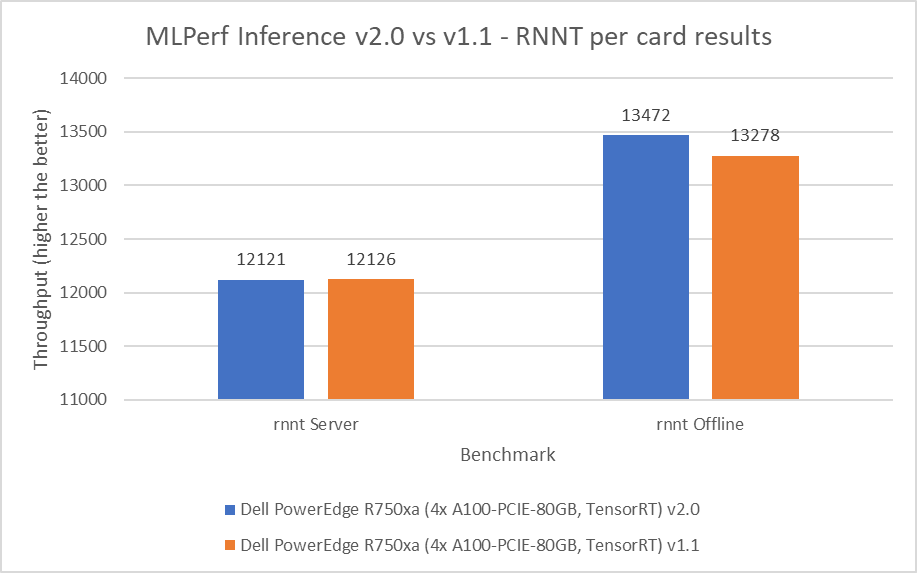
Figure 8: MLPerf Inference v2.0 compared to v1.1 RNNT per card results on the PowerEdge R750xa server
3D U-Net
The 3D U-Net performance numbers have changed in terms of scale and are not comparable in a bar graph because of a change to the dataset. The new dataset for this model is the Kitts 2019 Kidney Tumor Segmentation set. However, the PowerEdge R750xa server yielded Number One results among the PCIe form factor systems that were submitted. This model falls under the computer vision category, but it specifically deals with medical image data.
Results summary
Figure 1 through Figure 8 show the consistent performance of the PowerEdge R750xa server across both rounds of submission.
The following figure shows that in the offline scenarios for the benchmarks there is a small but noticeable performance improvement:
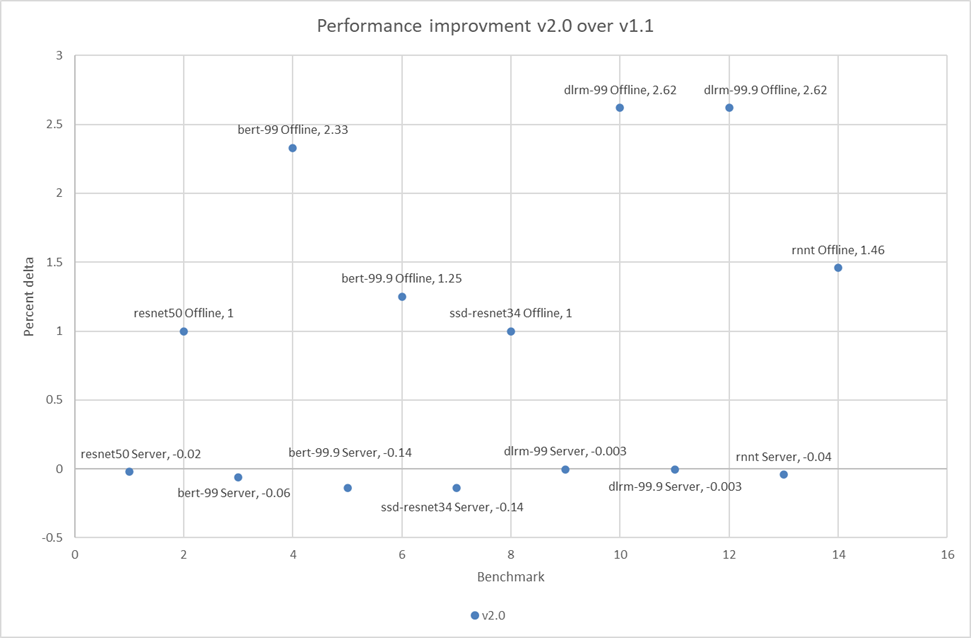
Figure 9: Performance improvement in percentage of the PowerEdge R750xa server across MLPerf Inference v2.0 and v1.1
The small percentage delta in the server scenarios can be a result of noise and are consistent with the previous round of submission.
Conclusion
This blog confirms the consistent performance of the Dell PowerEdge R750xa server across the MLPerf Inference v1.1 and MLPerf Inference v2.0 submissions. Because an identical system from round v1.1 performed at a consistent level for MLPerf Inference v2.0, we see that the software stack upgrades had minimal impact on performance. Therefore, the optimal results from the v1.1 round of submission can be used for making informed decisions about server performance for a specific ML workload. Because Dell Technologies submitted a diverse set of configurations in the v1.1 round of submission, customers can take advantage of many results.
Related Blog Posts

Unveiling the Power of the PowerEdge XE9680 Server on the GPT-J Model from MLPerf™ Inference
Tue, 16 Jan 2024 18:30:32 -0000
|Read Time: 0 minutes
Abstract
For the first time, the latest release of the MLPerf™ inference v3.1 benchmark includes the GPT-J model to represent large language model (LLM) performance on different systems. As a key player in the MLPerf consortium since version 0.7, Dell Technologies is back with exciting updates about the recent submission for the GPT-J model in MLPerf Inference v3.1. In this blog, we break down what these new numbers mean and present the improvements that Dell Technologies achieved with the Dell PowerEdge XE9680 server.
MLPerf inference v3.1
MLPerf inference is a standardized test for machine learning (ML) systems, allowing users to compare performance across different types of computer hardware. The test helps determine how well models, such as GPT-J, perform on various machines. Previous blogs provide a detailed MLPerf inference introduction. For in-depth details, see Introduction to MLPerf inference v1.0 Performance with Dell Servers. For step-by-step instructions for running the benchmark, see Running the MLPerf inference v1.0 Benchmark on Dell Systems. Inference version v3.1 is the seventh inference submission in which Dell Technologies has participated. The submission shows the latest system performance for different deep learning (DL) tasks and models.
Dell PowerEdge XE9680 server
The PowerEdge XE9680 server is Dell’s latest two-socket, 6U air-cooled rack server that is designed for training and inference for the most demanding ML and DL large models.
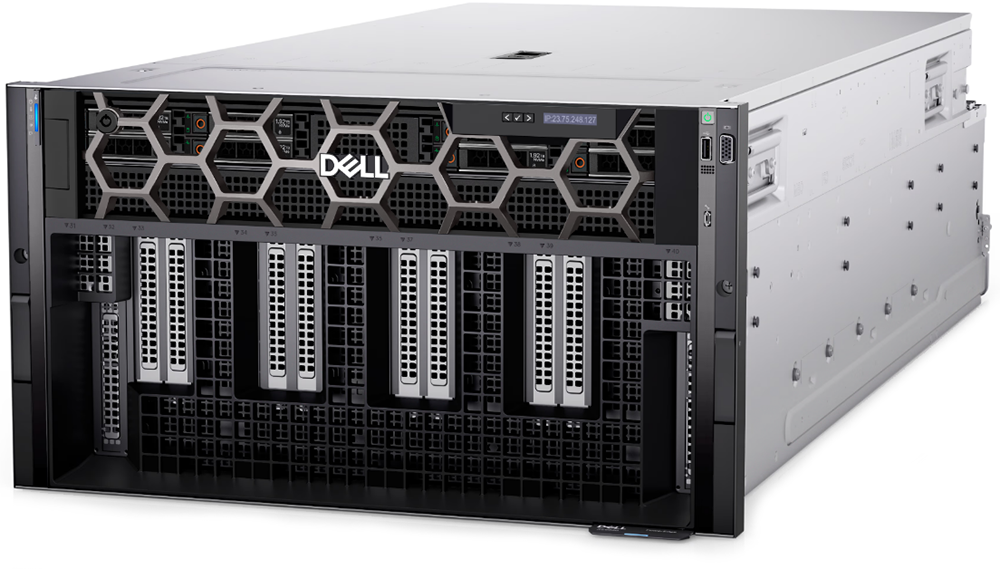
Figure 1. Dell PowerEdge XE9680 server
Key system features include:
- Two 4th Gen Intel Xeon Scalable Processors
- Up to 32 DDR5 DIMM slots
- Eight NVIDIA HGX H100 SXM 80 GB GPUs
- Up to 10 PCIe Gen5 slots to support the latest Gen5 PCIe devices and networking, enabling flexible networking design
- Up to eight U.2 SAS4/SATA SSDs (with fPERC12)/ NVMe drives (PSB direct) or up to 16 E3.S NVMe drives (PSB direct)
- A design to train and inference the most demanding ML and DL large models and run compute-intensive HPC workloads
The following figure shows a single NVIDIA H100 SXM GPU:
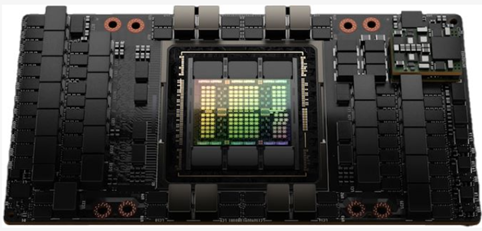
Figure 2. NVIDIA H100 SXM GPU
GPT-J model for inference
Language models take tokens as input and predict the probability of the next token or tokens. This method is widely used for essay generation, code development, language translation, summarization, and even understanding genetic sequences. The GPT-J model in MLPerf inference v3.1 has 6 B parameters and performs text summarization tasks on the CNN-DailyMail dataset. The model has 28 transformer layers, and a sequence length of 2048 tokens.
Performance updates
The official MLPerf inference v3.1 results for all Dell systems are published on https://mlcommons.org/benchmarks/inference-datacenter/. The PowerEdge XE9680 system ID is ID 3.1-0069.
After submitting the GPT-J model, we applied the latest firmware updates to the PowerEdge XE9680 server. The following figure shows that performance improved as a result:
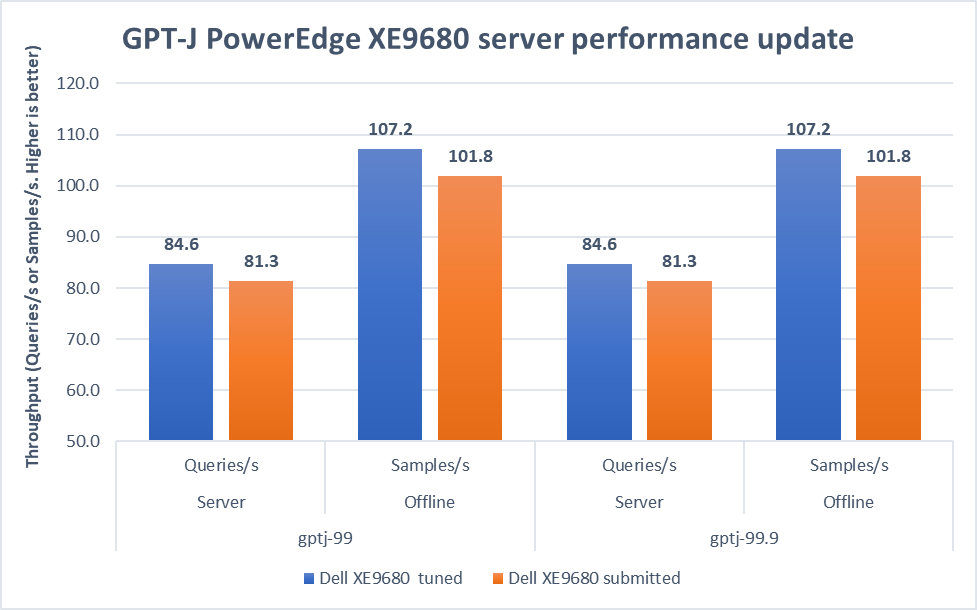
Figure 3. Improvement of the PowerEdge XE9680 server on GPT-J Datacenter 99 and 99.9, Server and Offline scenarios [1]
In both 99 and 99.9 Server scenarios, the performance increased from 81.3 to an impressive 84.6. This 4.1 percent difference showcases the server's capability under randomly fed inquires in the MLPerf-defined latency restriction. In the Offline scenarios, the performance saw a notable 5.3 percent boost from 101.8 to 107.2. These results mean that the server is even more efficient and capable of handling batch-based LLM workloads.
Note: For PowerEdge XE9680 server configuration details, see https://github.com/mlcommons/inference_results_v3.1/blob/main/closed/Dell/systems/XE9680_H100_SXM_80GBx8_TRT.json
Conclusion
This blog focuses on the updates of the GPT-J model in the v3.1 submission, continuing the journey of Dell’s experience with MLPerf inference. We highlighted the improvements made to the PowerEdge XE9680 server, showing Dell's commitment to pushing the limits of ML benchmarks. As technology evolves, Dell Technologies remains a leader, constantly innovating and delivering standout results.
[1] Unverified MLPerf® v3.1 Inference Closed GPT-J. Result not verified by MLCommons Association.
The MLPerf name and logo are registered and unregistered trademarks of MLCommons Association in the United States and other countries. All rights reserved. Unauthorized use is strictly prohibited. See www.mlcommons.org for more information.

Comparison of Top Accelerators from Dell Technologies’ MLPerf™ Inference v3.0 Submission
Fri, 21 Apr 2023 21:43:39 -0000
|Read Time: 0 minutes
Abstract
Dell Technologies recently submitted results to MLPerfTM Inference v3.0 in the closed division. This blog highlights the NVIDIA H100 PCIe GPU and compares the results to the NVIDIA A100 PCIe GPU with the PCIe form factor held constant.
Introduction
MLPerf Inference v3.0 submission falls under the benchmarking pillar of the MLCommonsTM consortium with the objective to make fair comparisons across server configurations. Submissions that are made to the closed division warrant an equitable comparison of the systems.
This blog highlights the closed division submissions Dell Technologies made with the NVIDIA A100 GPU using the PCIe (peripheral component interconnect express) form factor. The PCIe form factor is an interfacing standard for connecting various high-speed components in hardware such as a computer or a server. Servers include a certain number of PCIe slots in which to insert GPUs or other additional cards. Note that there are different physical configurations for the slots to indicate the number of lanes for data to travel to and from the PCIe card. The NVIDIA H100 GPU is truly the latest and greatest GPU with NVIDIA AI Enterprise included; it is a dual-slot air cooled PCIe generation 5.0 GPU. This GPU runs at a memory bandwidth speed of over 2,000 megabits per second and up to seven Multi-Instance GPUs at 10 gigabytes each. The NVIDIA A100 80 GB GPU is a dual-slot PCIe generation 4.0 GPU that runs at a memory bandwidth speed of over 2,000 megabits per second.
NVIDIA H100 PCIe GPU and NVIDIA A100 PCIe GPU comparison
In addition to making a submission with the NVIDIA A100 GPU, Dell Technologies made a submission with the NVIDIA H100 GPU. To make a fair comparison, the systems were identical and the PCIe form factor was held constant.
Platform | Dell PowerEdge R750xa (4x A100-PCIe-80GB, TensorRT) | Dell PowerEdge R750xa (4x H100-PCIe-80GB, TensorRT) |
Round | V3.0 | |
MLPerf System ID | R750xa_A100_PCIe_80GBx4_TRT | R750xa_H100_PCIe_80GBx4_TRT |
Operating system | CentOS 8.2 | |
CPU | Intel Xeon Gold 6338 CPU @ 2.00 GHz | |
Memory | 1 TB | 1 TB |
GPU | NVIDIA A100-PCIe-80GB | NVIDIA H100-PCIe-80GB |
GPU form factor | PCIe | |
GPU memory configuration | HBM2e | |
GPU count | 4 | |
Software stack | TensorRT 8.6 CUDA 12.0 cuDNN 8.8.0 Driver 525.85.12 DALI 1.17.0 | TensorRT 8.6 CUDA 12.0 cuDNN 8.8.0 Driver 525.60.13 DALI 1.17.0 |
Table 1: Software stack of submissions made on NVIDIA A100 PCIe and NVIDIA H100 PCIe GPUs for MLPerf Inference v3.0 on the Dell PowerEdge R750xa server
In the following figure, the per card numbers are normalized over the NVIDIA A100 GPU results to show a readable comparison of the GPUs on the same system. Across object detection, medical image segmentation, and speech to text and natural language processing, the latest NVIDIA H100 GPU outperforms its predecessor in all categories. Note the outstanding performance of the Dell PowerEdge R750xa server with NVIDIA H100 GPUs with the BERT benchmark in the high accuracy mode. With the advancements in generative artificial intelligence, the Dell PowerEdge R750xa server is a versatile, reliable, and high performing platform.
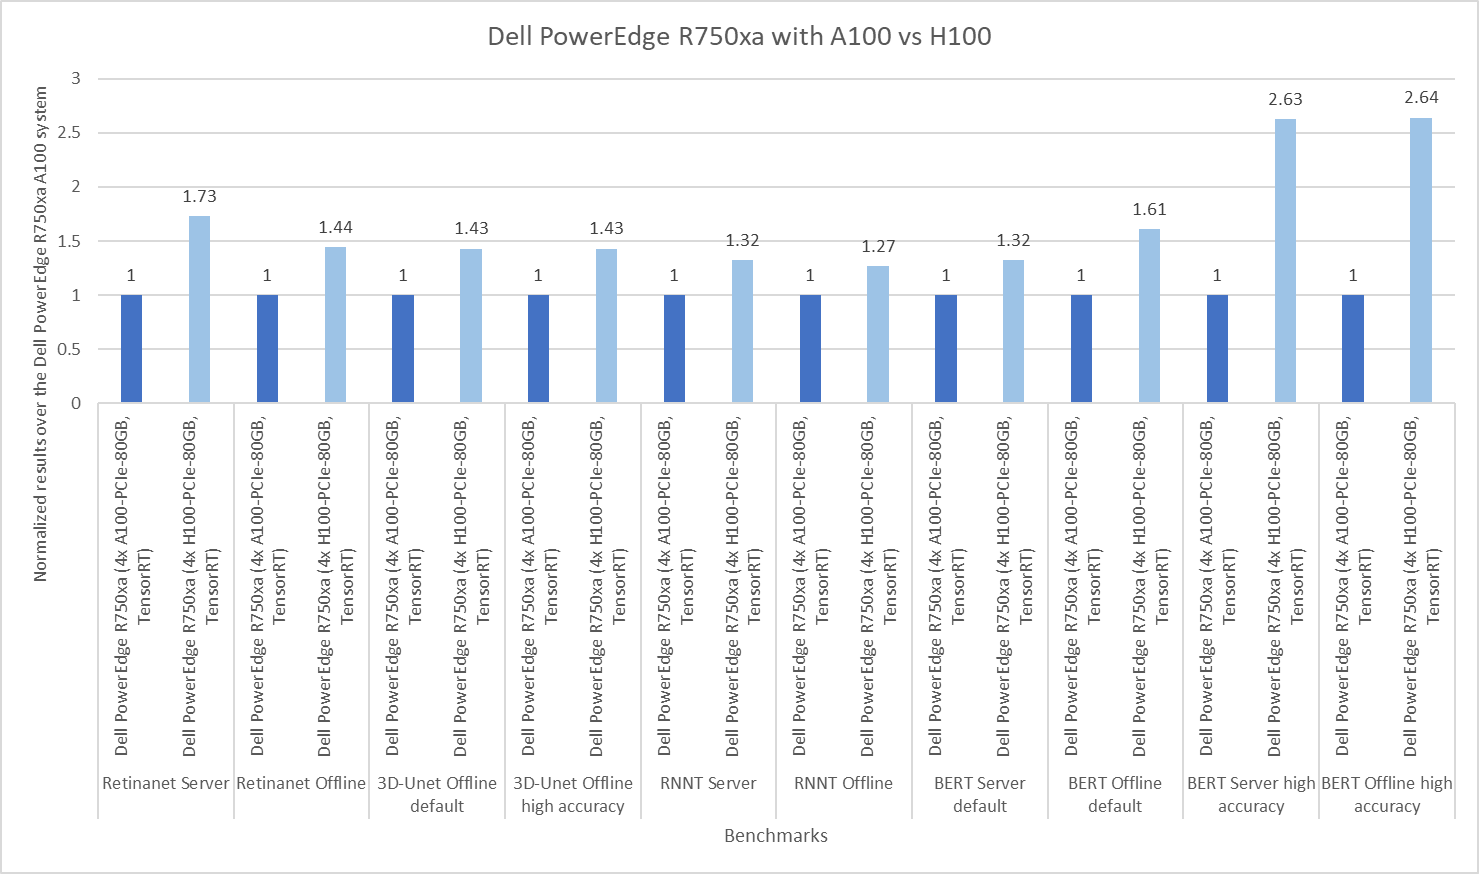
Figure 1: Normalized per GPU comparison of NVIDIA A100 and NVIDIA H100 GPUs on the Dell PowerEdge R750xa server
The following figures show absolute numbers for a comparison of the NVIDIA H100 and NVIDIA A100 GPUs.
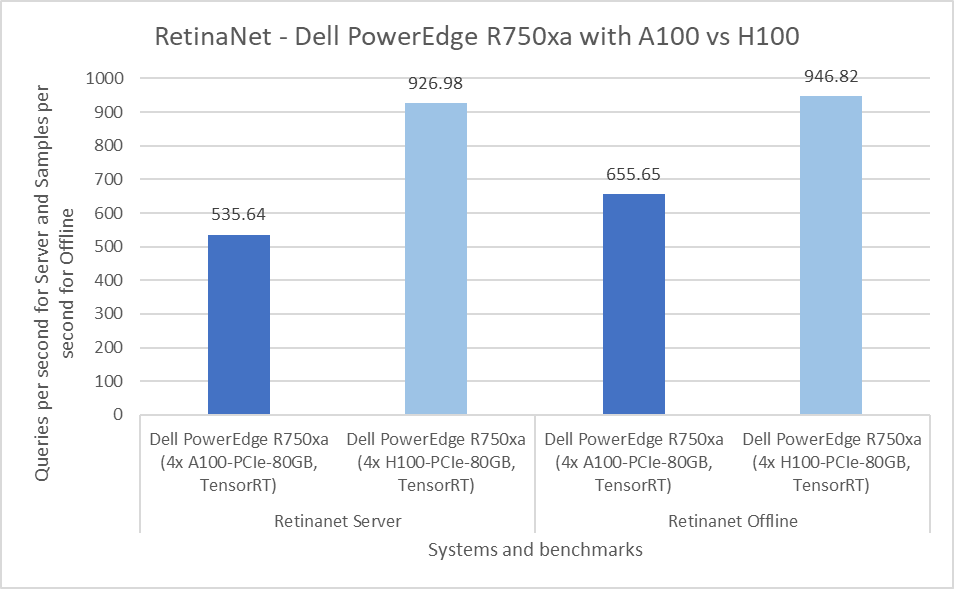
Figure 2: Per GPU comparison of NVIDIA A100 and NVIDIA H100 GPUs for RetinaNet on the PowerEdge R750xa server
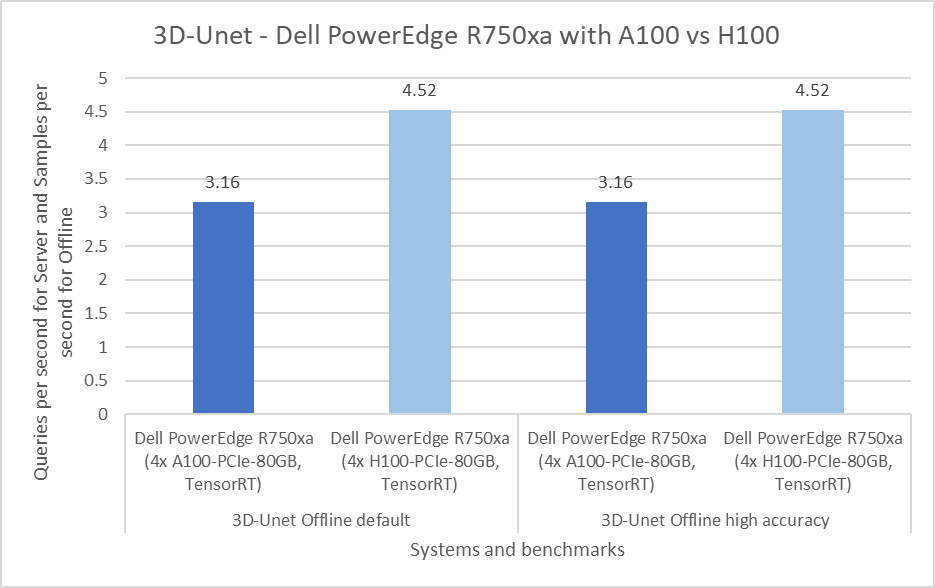
Figure 3: Per GPU comparison of NVIDIA A100 and NVIDIA H100 GPUs for 3D-Unet on the PowerEdge R750xa server
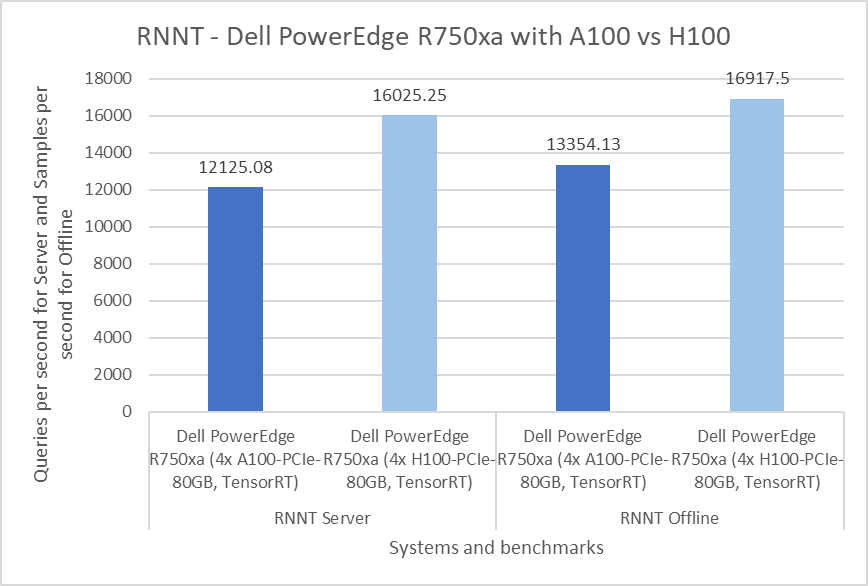
Figure 4: Per GPU comparison of NVIDIA A100 and NVIDIA H100 GPUs for RNNT on the PowerEdge R750xa server
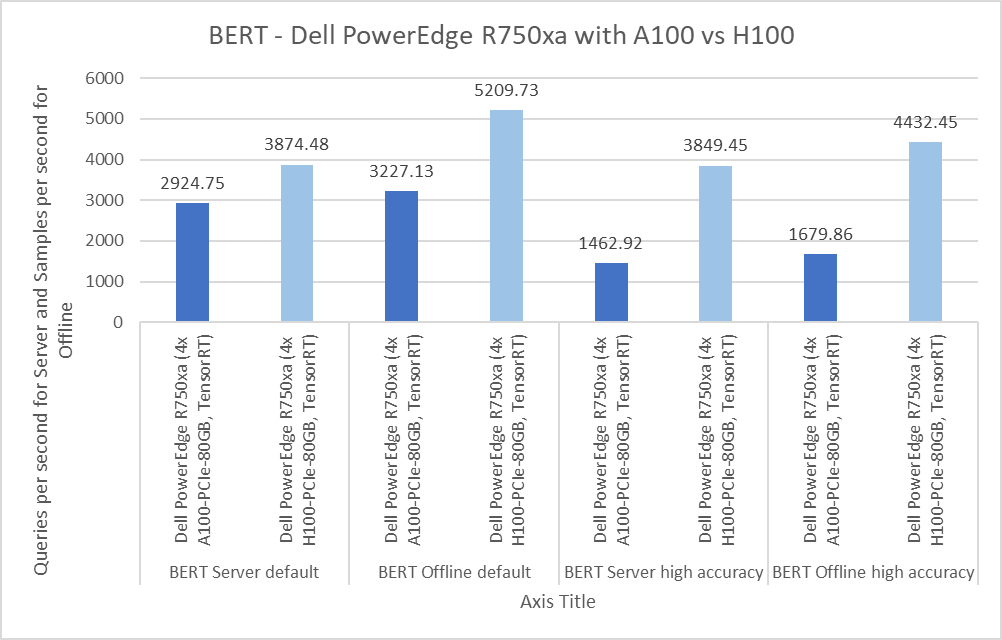
Figure 5: Per GPU comparison of NVIDIA A100 and NVIDIA H100 GPUs for BERT on the PowerEdge R750xa server
These results can be found on the MLCommons website.
Submissions made with the NVIDIA A100 PCIe GPU
In this round of submissions, Dell Technologies submitted results on the PowerEdge R750xa server packaged with four NVIDIA A100 80 GB PCIe GPUs. In previous rounds, the PowerEdge R750xa server showed outstanding performance across all the benchmarks. For a deeper dive of a previous round's submission, check out our blog from MLPerf Inference v2.0. From the previous round of MLPerf Inference v2.1 submissions, Dell Technologies submitted results on an identical system. However, across the two rounds of submissions, the main difference is the upgrades in the software stack, as described in the following table:
Platform | Dell PowerEdge R750xa (4x A100-PCIe-80GB, TensorRT) | Dell PowerEdge R750xa (4x A100-PCIe-80GB, TensorRT) |
Round | V3.0 | V2.1 |
MLPerf System ID | R750xa_A100_PCIe_80GBx4_TRT | |
Operating system | CentOS 8.2 | |
CPU | Intel Xeon Gold 6338 CPU @ 2.00 GHz | |
Memory | 512 GB | |
GPU | NVIDIA A100-PCIe-80GB | |
GPU form factor | PCIe | |
GPU memory configuration | HBM2e | |
GPU count | 4 | |
Software stack | TensorRT 8.6 CUDA 12.0 cuDNN 8.8.0 Driver 525.85.12 DALI 1.17.0 | TensorRT 8.4.2 CUDA 11.6 cuDNN 8.4.1 Driver 510.39.01 DALI 0.31.0 |
Table 2: Software stack for submissions made on the NVIDIA A100 PCIe GPU in MLPerf Inference v3.0 and v2.1
Comparison of PowerEdge R750xa NVIDIA A100 results from Inference v3.0 and v2.1
Object detection
The RetinaNet benchmark falls under the object detection category and uses the OpenImages dataset. The results from Inference v3.0 show a less than 0.05 percent difference in the Server scenario and a 21.53 percent difference in the Offline scenario. A potential reason for this result might be NVIDIA’s optimizations, as outlined in their technical blog.
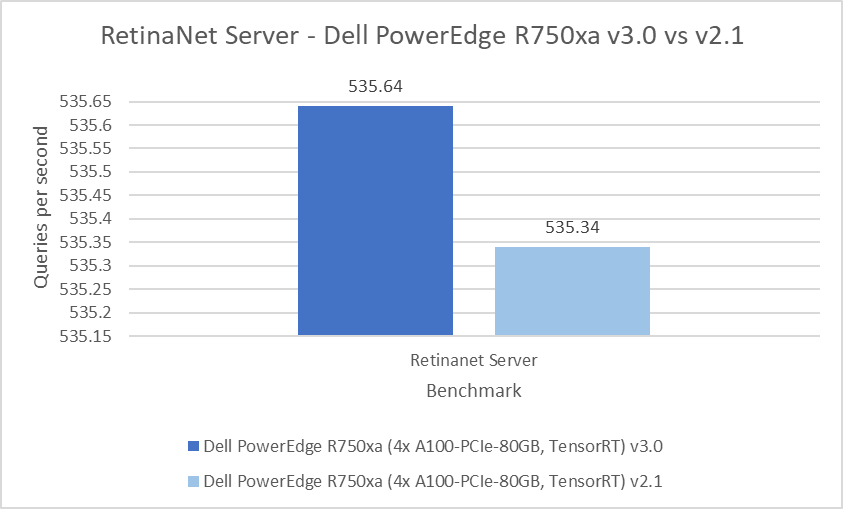
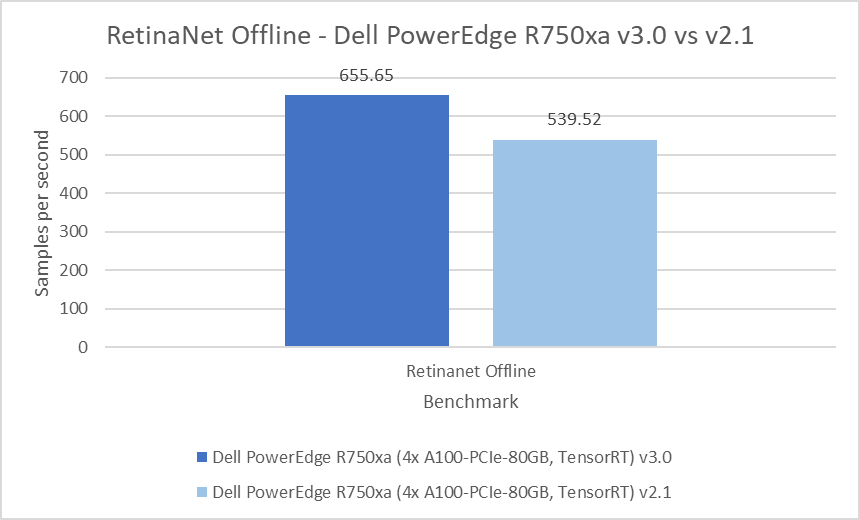
Figure 6: RetinaNet Server and Offline results on the PowerEdge R750xa server from Inference v3.0 and Inference v2.1
Medical image segmentation
The 3D-Unet benchmark performs the KiTS 2019 kidney tumor segmentation task. Across the two rounds of submission, the PowerEdge R750xa server performed consistently well with a 0.3 percent difference in both the default and high accuracy modes.
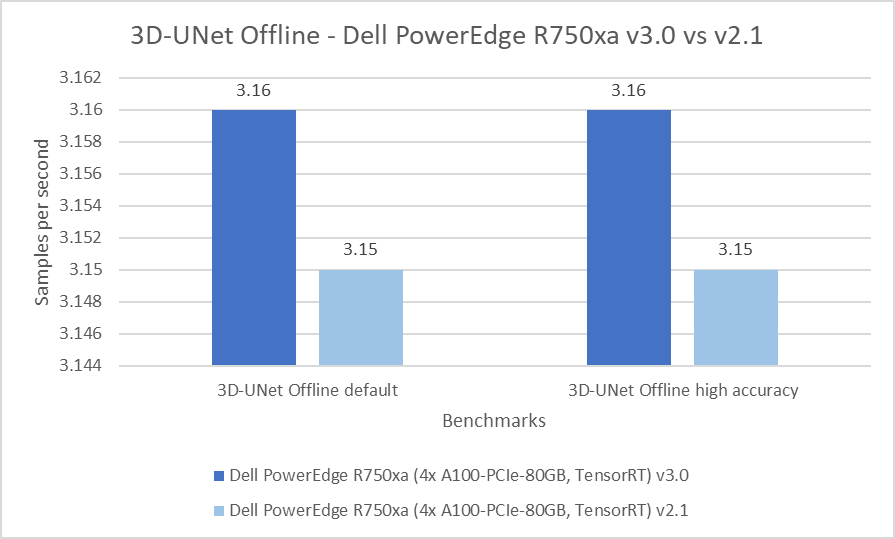
Figure 7: 3D-UNet Offline results on the PowerEdge R750xa server from Inference v3.0 and v2.1
Speech to text
The Recurrent Neural Network Transducers (RNNT) model falls under the speech recognition category. This benchmark accepts raw audio samples and produces the corresponding character transcription. In the Server scenario, the results are within a 2.25 percent difference and 0.41 percent difference in the Offline scenario.

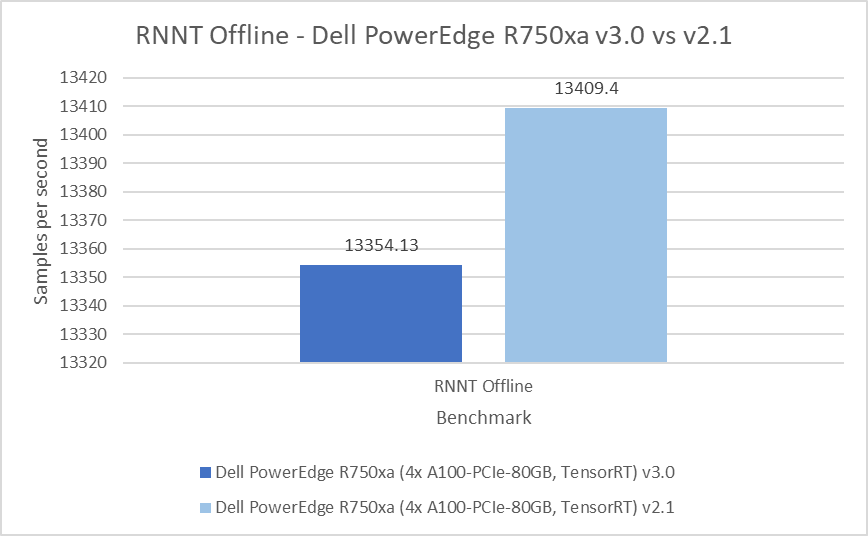
Figure 8: RNNT Server and Offline results on the Dell PowerEdge R750xa server from Inference v3.0 and v2.1
Natural language processing
Bidirectional Encoder Representation from Transformers (BERT) is a state-of-the-art language representational model for Natural Language Processing applications. This benchmark performs the SQuAD question answering task. The BERT benchmark consists of default and high accuracy modes for the Offline and Server scenarios. For the Server scenarios, the default mode results are within a 1.69 percent range and 3.12 percent range for the high accuracy mode. For the Offline scenarios, a similar behavior is noticeable in which the default mode results are within a 0.86 percent range and 3.65 percent range in the high accuracy mode.
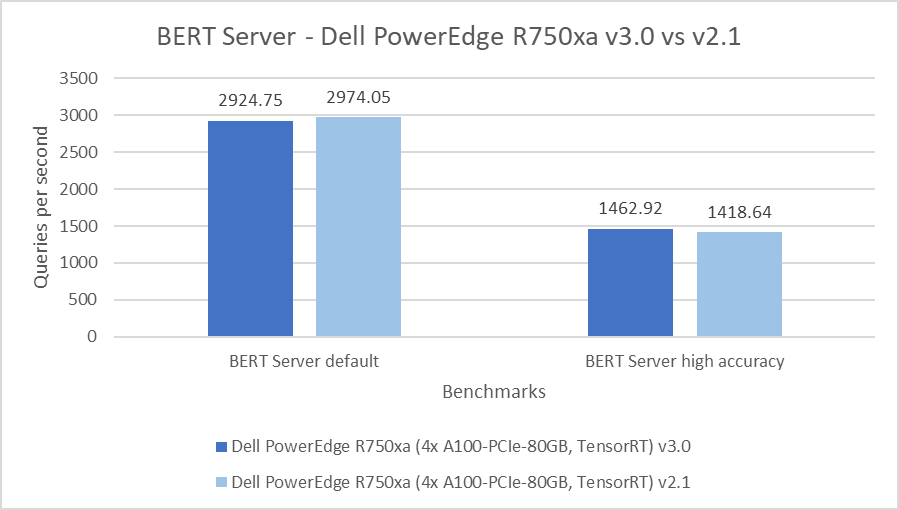
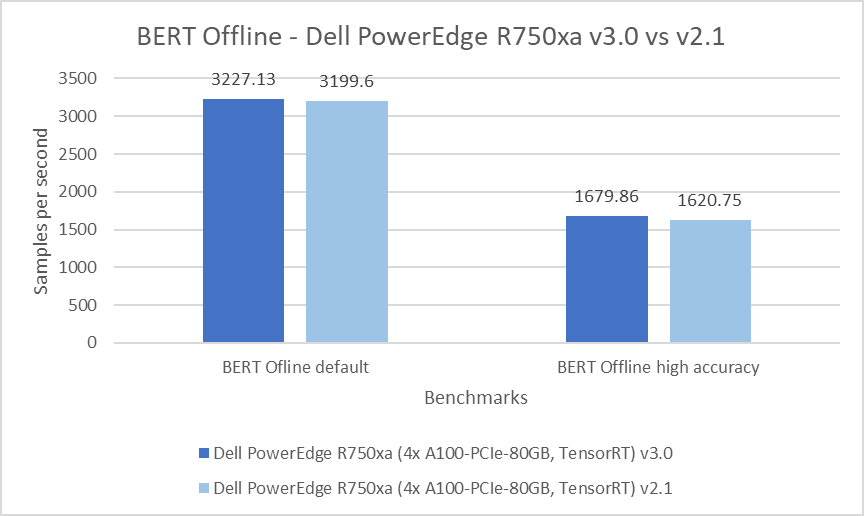
Figure 9: BERT Server and Offline results on the PowerEdge R750xa server from Inference v3.0 and v2.1
Conclusion
Across the various rounds of submissions to the MLPerf Inference benchmark suite, the PowerEdge R750xa server has been a consistent top performer for any machine learning tasks ranging from object detection, medical image segmentation, speech to text and natural language processing. The PowerEdge R750xa server continues to be an excellent server choice for machine learning inference workloads. Customers can take advantage of the diverse results submitted on the Dell PowerEdge R750xa server with the NVIDIA H100 GPU to make an informed decision for their specific solution needs.