


APEX File Storage for Microsoft Azure Performance Considerations
Tue, 02 Jul 2024 15:12:21 -0000
|Read Time: 0 minutes
To understand the performance characteristics of APEX File Storage for Microsoft Azure, Dell Technical Marketing Engineering’s PowerScale Performance Team used a standard benchmark tool. This tool is used for conducting sequential read tests with a request size of 128 KiB and sequential write tests with a request size of 512 KiB, with NFS version 3.
Regarding the sequential read/write tests, here are a few specifics:
- In the tests, we applied the OneFS access pattern “streaming” to the top-level test directory and any child objects of that directory. For more information about OneFS data access patterns, see the white paper PowerScale OneFS Best Practices.
- Sequential writes (100% writes) were made to large test files. Each write thread writes to a unique large test file. We used 80 GiB files for sequential writes.
- Sequential reads (100% reads) were madee from existing large test files. Each read thread reads from a unique large test file. We used 80 GiB files for sequential reads.
The OneFS inline compression and inline deduplication features were left at their defaults (enabled) during all tests. The benchmark workload specified 0% compressible or deduplicated data blocks. The data reduction ratio for the dataset is 1.0 in the tests.
Note: There is a known issue that the inline deduplication and inline compression feature is not enabled by default at the disk pool level. The first MR (Major Release) will fix it after GA (General Availability). You can also reach out to your sales representative if you need an immediate fix.
In the tests, we used Standard_D48s_v5 clients to generate I/O to the OneFS clusters. The ratio of clients to nodes is 2:1. Each client instance contained 48 vCPU cores and 192 GiB memory, and the network bandwidth was 24 Gbps. For each test, we followed the rule of ensuring that the aggregate bandwidth of data disks is sufficient at the VM level. See Appendix C: recommended data disks configuration details for optimal performance in the white paper Introduction to APEX File Storage for Microsoft Azure.
All performance tests in this document were performed in the South Central US location.
Considerations
Overall, our performance testing identified several key considerations to address prior to deploying APEX File Storage for Microsoft Azure clusters. These considerations are crucial to ensure that the clusters can effectively meet your organization's performance needs.
This section describes the two key factors that affect performance when designing a OneFS cluster of APEX File Storage for Microsoft Azure. The key factors are:
- Node types
- Node scale-out
Note: The performance testing is conducted with supported +2d:1n protection level configurations. See Appendix A: supported cluster configuration details for all supported combinations in the white paper Introduction to APEX File Storage for Microsoft Azure.
Starting with OneFS 9.8.0.0, APEX File Storage for Microsoft Azure supports:
- Ddv5-series VMs
- Ddsv5-series VMs
- Edv5-series VMs
- Edsv5-series VMs
Table 1 shows two Azure storage throughput limits and the network bandwidth limit at the node level for tests. These three limits will directly impact the maximum sequential read throughput performance.
Table 1. Azure storage throughput limits and network bandwidth limits for tested node types
Node type/VM size | vCPU | Memory (GiB) | Max uncached disk throughput (MBps) | Max burst uncached disk throughput (MBps) | Max network bandwidth (Mbps) |
32 | 128 | 865 | 2,000 | 16,000 | |
48 | 192 | 1,315 | 3,000 | 24,000 | |
64 | 256 | 1,735 | 3,000 | 30,000 | |
104 | 672 | 4,000 | 4,000 | 100,000 |
When optimizing the performance of a cluster, see Appendix C: recommended data disks configuration details for optimal performance in the Introduction to APEX File Storage for Microsoft Azure white paper.
Node types
This section describes sequential read and sequential write performance for different node types.
Sequential read throughput
The Figure 1 represents a 128KB sequential read workload for different node types. It indicates that the sequential read performance increases with more powerful (larger VM size) nodes in the cluster.
The max burst uncached disk throughput and max network bandwidth directly impact the maximum sequential read throughput performance.
- Max burst uncached disk throughput: For E104ids_v5 node, its sequential read performance is constrained by the node-level storage throughput limit, which is max uncached disk throughput or max burst uncached disk throughput as shown in Table 1.
- Max network bandwidth: For most node types (excluding E104ids_v5), their sequential read performance is constrained by their node-level network bandwidth limit as shown in Table 1. The network bandwidth of a node is measured based on egress traffic across all network interfaces. This network bandwidth is shared by both nodes’ external (front-end) and internal (back-end) interfaces.
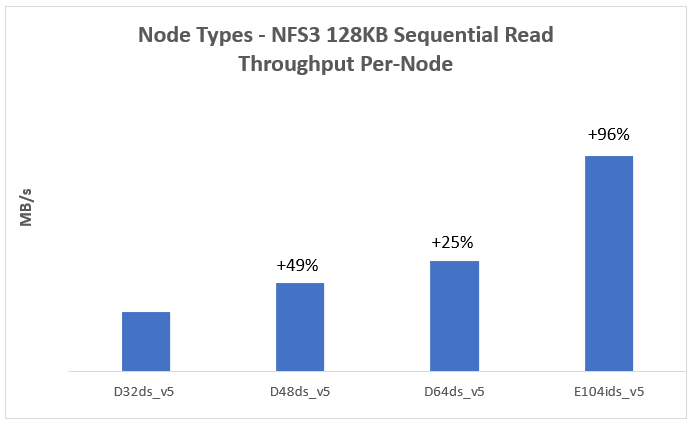
Figure 1. Sequential read throughput for different node types
Note: Each test used a 4-node cluster with 12 data disks per node.
Sequential write throughput
Figure 2 represents a 512KB sequential write workload for different node types. It indicates that the sequential write performance increases with more powerful (larger VM size) nodes in the cluster.
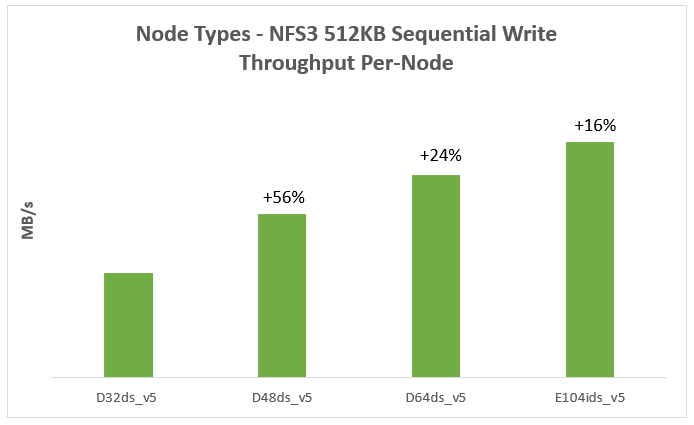
Figure 2. Sequential write throughput for different node types
Note: Each test uses a 4-node cluster with 12 data disks per node.
Node scale-out
This section describes sequential read and sequential write performance for node scale-out.
Table 2 shows cluster configurations for node scale-out tests.
Table 2. Cluster configurations for node scale-out tests
Node type | Node count | Data disk type | Data disk count |
10 | P40 | 12 | |
14 | P40 | 12 | |
18 | P40 | 12 |
Note: The performance testing is conducted with supported +2d:1n protection level configurations. For all supported combinations, see Appendix A: supported cluster configuration details in the Introduction to APEX File Storage for Microsoft Azure white paper.
Sequential read throughput
Figure 3 represents a 128KB sequential read workload for node scale-out. It indicates that the sequential read performance increases with more nodes in the cluster.
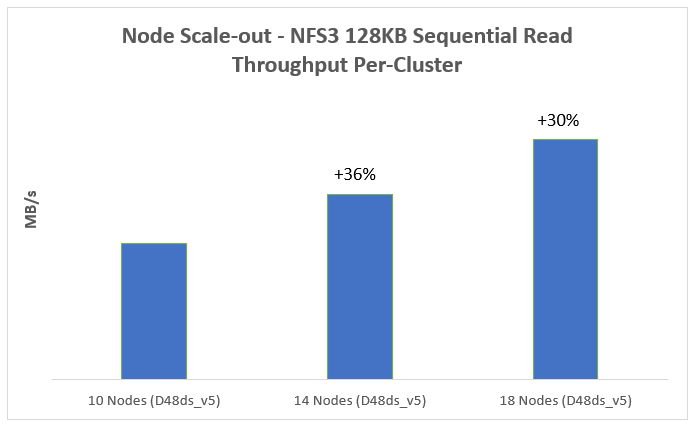
Figure 3. Sequential read performance for node Scale-out
Sequential write throughput
Figure 4 represents a 512KB sequential write workload for node scale-out. It indicates that the sequential write performance increases with more nodes in the cluster. 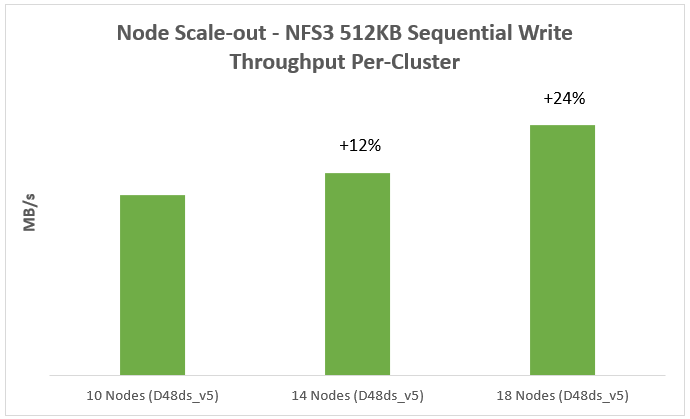
Figure 4. Sequential write performance for node Scale-out
We also validated common AI workloads and achieved solid performance on the OneFS clusters in Azure. From a performance perspective, it is well-suited for running typical AI workloads on the OneFS clusters in Azure.
Disclaimer: Benchmark results depend on workload, specific application requirements and system design and implementation. Relative system performance varies based on these and other factors. These benchmark results should not be used as a substitute for a specific customer application profiling when critical capacity planning or product evaluation decisions are made. All performance results presented in this report were obtained in a rigorously controlled environment. Results obtained in other operating environments may vary significantly. Dell Technologies does not warrant or represent that a user can or will achieve similar performance results.
Thank you for taking the time to read this blog, and congratulations on gaining a clear understanding of the performance characteristics of APEX File Storage for Microsoft Azure!
Author: Jason He, Principal Engineering Technologist