


Alert in IIQ 5.0.0 – Part I
Wed, 13 Dec 2023 17:40:06 -0000
|Read Time: 0 minutes
Alert is a new feature introduced with the release of IIQ 5.0.0. It provides the capability and flexibility to configure alerts based on the KPI threshold.
This blog will walk you through the following aspects of this feature:
- Introduction to Alert
- How to configure alerts using Alert
Let’s get started:
Introduction
IIQ 5.0.0 can send email alerts based on your defined KPI and threshold. The supported KPIs are listed in the following table:
KPI Name | Description | Scope |
Protocol Latency SMB | Average latency within last 10 minutes required for the various operations for the SMB protocol | Across all nodes and clients per cluster. |
Protocol Latency NFS | Average latency within last 10 minutes required for the various operations for the NFS protocol. | Across all nodes and clients per cluster. |
Active Clients NFS | The current number of active clients using NFS. The client is active when it is transmitting or receiving data. | Across all nodes per cluster. |
Active Clients SMB 1 | The current number of active clients using SMB 1. The client is active when it is transmitting or receiving data. | Across all nodes per cluster. |
Active Clients SMB 2 | The current number of active clients using SMB 2. The client is active when it is transmitting or receiving data. | Across all nodes per cluster. |
Connected Clients NFS | The current number of connected clients using NFS. The client is connected when it has an open TCP connection to the cluster. It can transmit or receive data or it can be in an idle state. | Across all nodes per cluster. |
Connected Clients SMB | The current number of connected clients using SMB. The client is connected when it has an open TCP connection to the cluster. It can transmit or receive data or it can be in an idle state. | Across all nodes per cluster. |
Pending Disk Operation Count | The average pending disk operation count within the last 10 minutes. It is the number of I/O operations that are pending at the file system level and waiting to be issued to an individual drive. | Across all disks per cluster. |
CPU Usage | The average usage of CPU cores including the physical cores and hyperthreaded core within last 10 minutes. | Across all nodes per cluster. |
Cluster Capacity | The current used capacity for the cluster. | N/A |
Nodepool Capacity | The current used capacity for the node pool in a cluster. | N/A |
Drive Capacity | The current used capacity for a drive in a cluster. | N/A |
Node Capacity | The current used capacity for a node in a cluster. | N/A |
Network Throughput Equivalency | Checks whether the network throughput for each node within the last 10 minutes is within the specified threshold percentage of the average network throughput of all nodes in the node pool for the same time. | Across all nodes per node pool. |
Each KPI requires a threshold and a severity level, together forming an alert rule. You can customize the alert rules to align with specific business use cases.
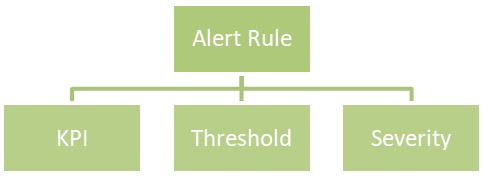
Here is an example of an alert rule:
If CPU usage (KPI) is greater than or equal to 96% (threshold), a critical alert (severity) will be triggered.
The supported severities are:
- Emergency
- Critical
- Warning
- Information
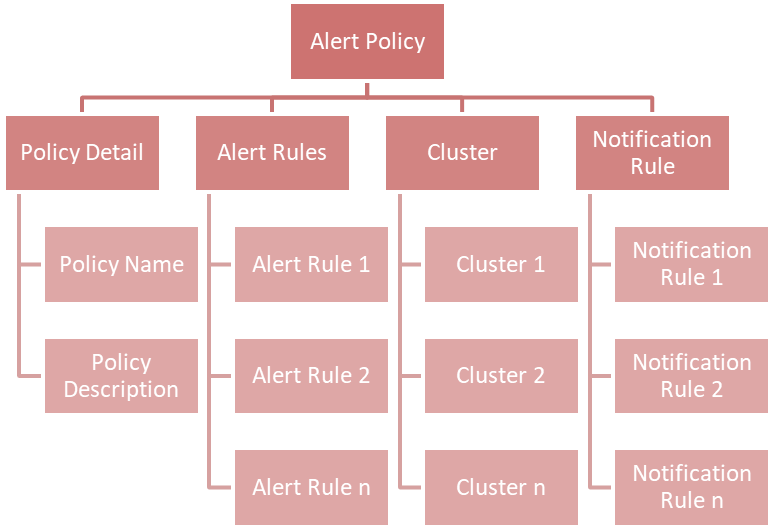
You can combine multiple alert rules into a single alert policy for easy management purposes.
If you take a look at the chart above, you will find a new concept called Notification Rule. This is used to define the recipients' Email address and from what severity they will receive an Email:
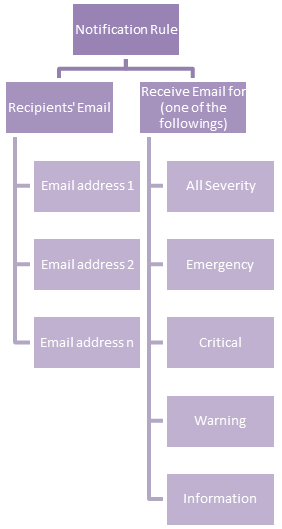
An example of a notification rule is like this: for user A (user_a@lled.com) and user B (user_b@lled.com), they both will receive Email alerts from all severity.
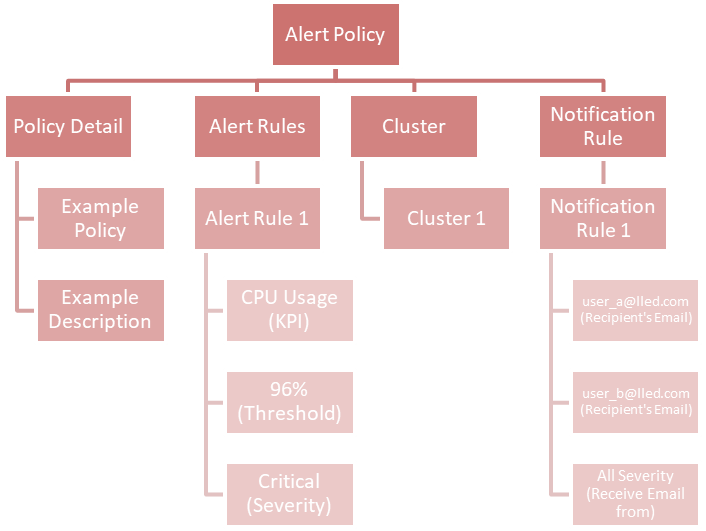
If you combine the above two examples and put them into the view of alert policy, you will get:
At this point, you should understand the big picture of the alert feature in IIQ 5.0.0. In my next post, I will walk you through the details of how to configure it.