

Assets

Dell iDRAC Data Visualization with Elastic Search and Grafana
Wed, 25 Jan 2023 17:06:05 -0000
|Read Time: 0 minutes
Introduction
This blog is the first in a series in which I write about Dell iDRAC Data Visualization with Elastic Search and Grafana. In this blog, I explain iDRAC telemetry data visualization, which represents a potential advantage for any business product, and for monitoring.
Grafana is a versatile, open-source data visualization tool which can read data from different data sources and plot the visualization, depending on the use case. This plot can be combined to create a unique dashboard that you can integrate into any of your custom applications, to visualize or use it as it is.
Elastic Search is an open-source, distributed data store for full-text search engine. It uses a JSON-based document structure to index the data obtained and store it. It uses the Inverted Index structure, which helps in fast keyword searches in stored data.
The topics covered in this blog include:
- Using Helm chart, Deploy Elastic Search and Grafana on Kubernetes (K8s) cluster.
- Creating a basic iDRAC visualization dashboard.
- Configuring the Alert Manager in Grafana, and then enabling it in the visualization dashboard.
Deployment Activity
Prerequisites
- A fully configured Linux environment
- K8s installed in your Linux environment
- An iDRAC system with data telemetry services enabled
Once all the prerequisites are ready, you can begin deploying the major open-source applications (Elastic Search and Grafana). This deployment should be performed on a K8s cluster.
Elastic Search
To install Elastic Search:
- Using Helm, add the elastic repository:
helm repo add elastic https://helm.elastic.co - Install Elastic Search:
helm install elastic-release elastic/elasticsearch -n {namespace_name}
Note: replace namespace_name with your defined namespace.
3: Test the Elastic Search instance:
kubectl port-forward svc/elasticsearch-master 9200 -n {namespace_name}
curl localhost:9200
Grafana
To install Grafana:
- Using Helm, add the bitnami repository:
helm repo add bitnami https://charts.bitnami.com/bitnami - Install Grafana:
helm install my-release bitnami/grafana -n {namespace_name}
Note: replace namespace_name with your defined namespace.
Fetching Data from iDRAC
The data telemetry should be fetched and sent to Elastic Search based on the configured time. In the next section, you can see how to fetch the data from iDRAC to Elastic Search.
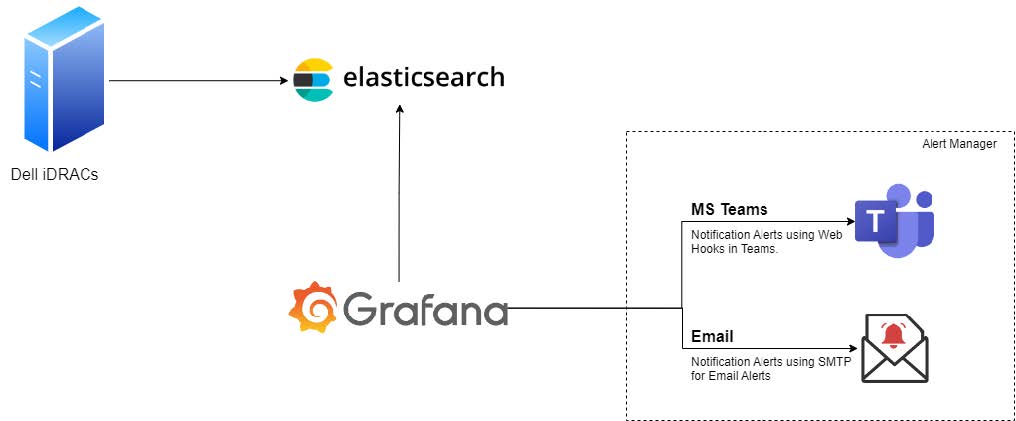
Figure 1: Connectivity diagram
Enabling the Alert Manager
MS-Teams notifications
- Create a Teams Channel where notifications will be sent.
- Click the ellipsis (…) in the top-right pane, and then select Channel notifications -> Connectors.
- Select and configure the Incoming Webhook by providing the required information.
- Once the configuration is complete, copy the URL and save the channel configuration.
Note: The copied URL must be provided in the Alerts section of Grafana.
- In Grafana, select Menu-> Alerts.
- Go to Contact Points.
- Create a contact point by providing the required information.
- Save the contact point.
- Run a test notification to verify that alerts are reaching to the newly created Teams Channel.
Configure email notifications
The Email notifications are sent using SMTP service. You must configure notifications using a YAML file or using Environment Variables.
Method 1: Using a YAML file
- Add and enable the following configuration your YAML file before deploying the Grafana instance on your K8s cluster:
smtp:
enabled: false
user: user
password: password
host: ""
fromAddress: ""
fromName: ""
skipVerify: "false"
existingSecret: ""
existingSecretUserKey: user
existingSecretPasswordKey: password - Run the kubectl command to install the Grafana instance.
Method 2: Using an environment variable
- Edit the deployment of the Grafana instance:
kubectl edit deployment {deployment_name} - Add the following configuration details to the file:
- env:
— name: GF_SMTP_ENABLED
value: “true”
— name: GF_SMTP_HOST
value: {SMPT_IP}:{PORT}
— name: GF_SMTP_PASSWORD
value: xxxxxxxxxxxx
— name: GF_SMTP_USER
value: apikey
— name: GF_SMTP_FROM_ADDRESS
value: test@test.com
— name: GF_SMTP_FROM_NAME
value: System Admin - Save the file. Kubernetes will automatically roll out the new configuration.
- Test the new configuration:
- In Grafana, go to Alerts Notifications.
- Select the notification channel.
- If no email channel is present, add a channel with an email address.
- Enter the notification recipient email address.
- Run the test configuration to verify that the recipient email gets a test notification.
Approach
Once the above deployment is completed, login with the default username and password configured in Grafana, to check whether Grafana is up and running. The steps below enable you to view the Grafana dashboard.
Add a data source
You can add a data source in two different ways: by using the values.yml file, or by using the Grafana UI.
Method 1: Using the values.yml file
Create and add the configuration below in the datasource.yml file:
datasources:
secretName: ""
secretDefinition:
apiVersion: 1
datasources:
- name: { datasource_name}
type: { datasource_type }
url: { datasource_url }
access: { access_type }
isDefault: { true/false }
Example:
datasources:
## @param datasources.secretName The name of an externally-managed secret containing custom datasource files.
##
secretName: ""
## @param datasources.secretDefinition The contents of a secret defining a custom datasource file. Only used if datasources.secretName is empty or not defined.
## Example:
## secretDefinition:
## apiVersion: 1
## datasources:
## - name: Prometheus
## type: prometheus
## url: http://prometheus-prometheus-server
## access: proxy
## isDefault: true
Method 2: Using the Grafana UI
- From the Grafana UI navigation section, select the Settings icon. It resembles a cog wheel.
- Select the Data Source option.
- Add the new data source.
- Search for the Elastic Search data source.
- Select the data source from the search results. The configuration window displays.
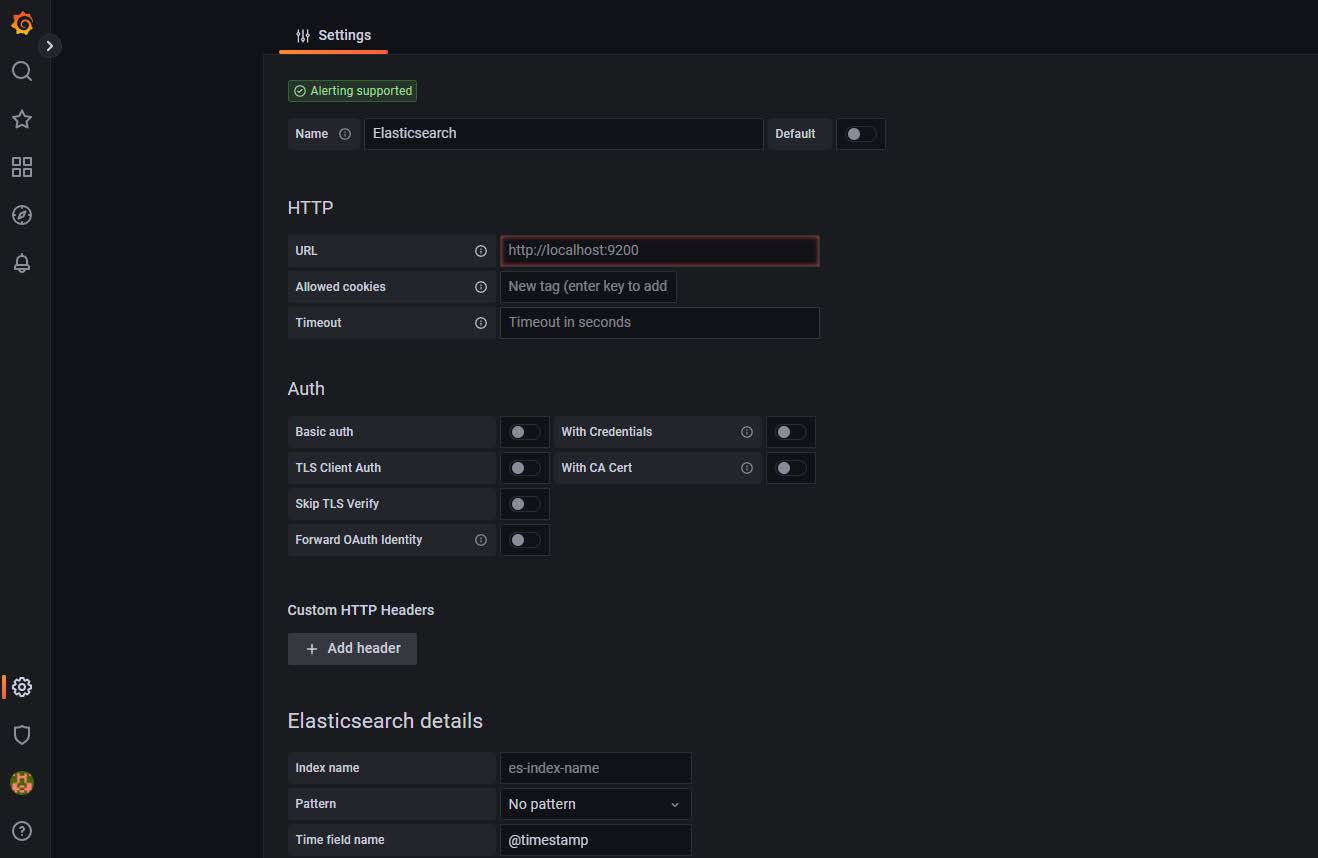
Figure 2: Configuration window
- Add the URL, authentication details, and so on.
- Save and then test the configuration.
A successful test confirms that data source is added successfully.
Create the dashboard
- In the Grafana UI, select the Dashboards icon in the left pane.
- Expand the New drop-down in the right pane.
- Select New Dashboard.
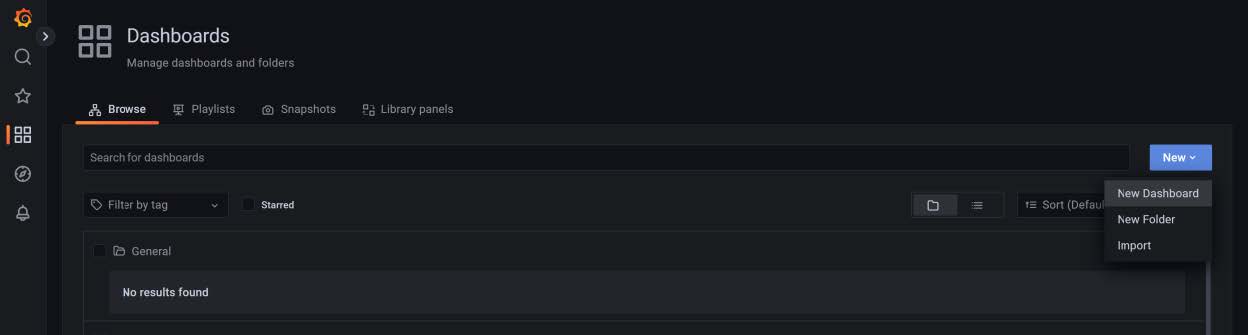
Figure 3: Creating a dashboard
Create the dashboard panels
- Select the Panels and rows according to the use-case and map the data source that you created in Add a data source.
- Once the data source is mapped, create a query to fetch the details from the data source to visualize the data.
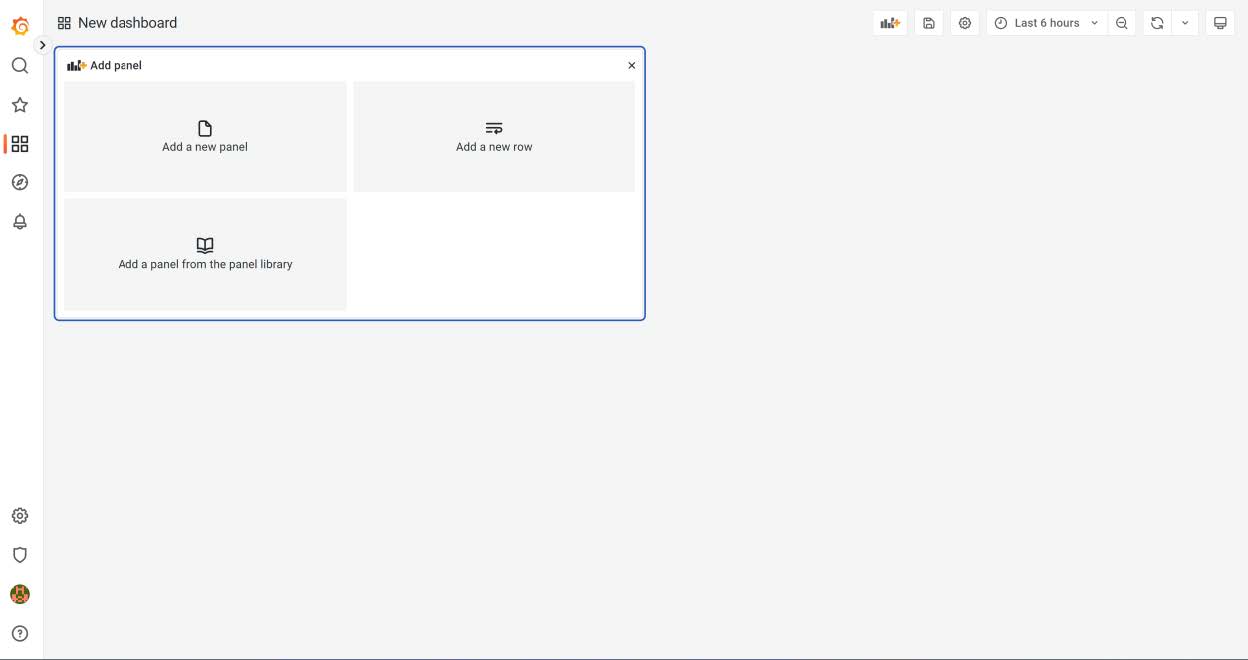
Figure 4: New dashboard panels
Configure the alerts notifications threshold
In the right panel you will find the threshold section, where you can configure the alert threshold. See the figure below.
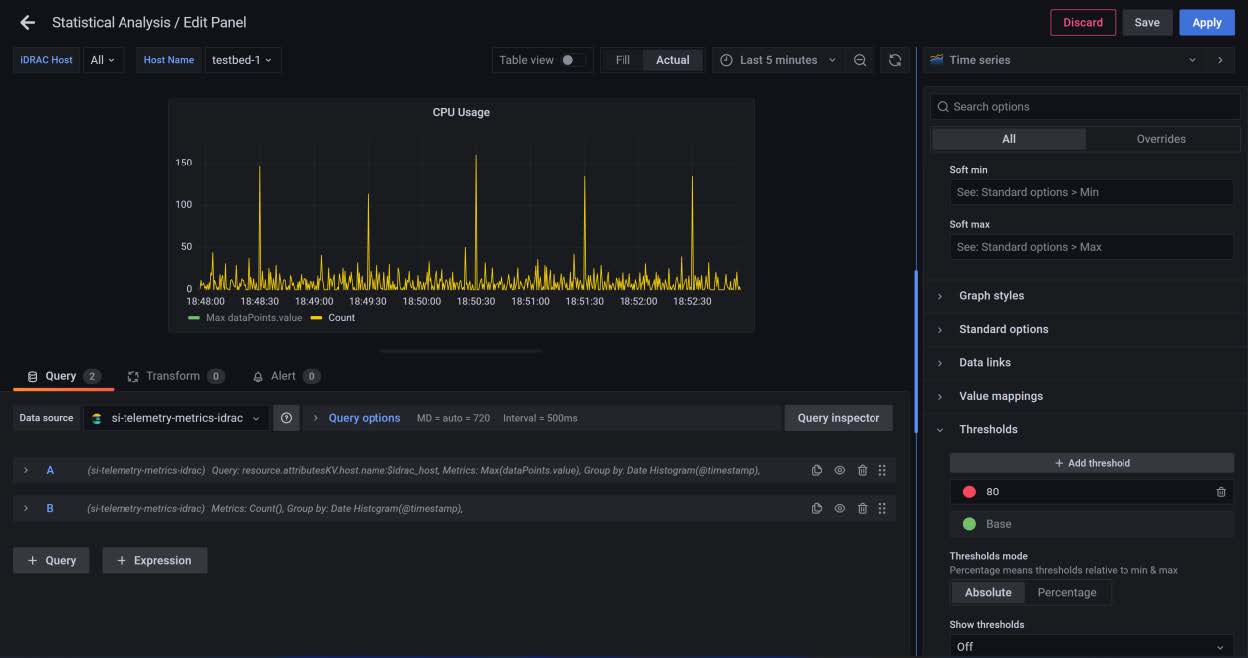
Figure 5: Threshold configuration
Results
The results are displayed as in the figure below.
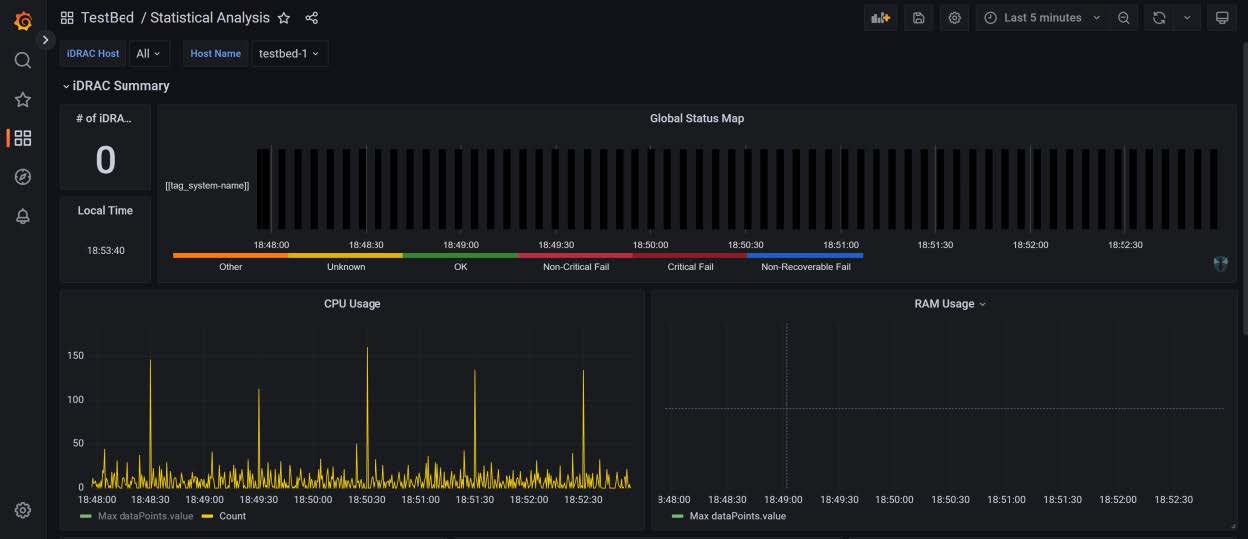
Figure 6: Simple dashboard with configured alerts
Conclusion
This blog helps enterprise data visualization teams to implement Grafana in K8s, and to configure the data source and alert notifications.