


Dell iDRAC Data Visualization with Elastic Search and Grafana

Introduction
This blog is the first in a series in which I write about Dell iDRAC Data Visualization with Elastic Search and Grafana. In this blog, I explain iDRAC telemetry data visualization, which represents a potential advantage for any business product, and for monitoring.
Grafana is a versatile, open-source data visualization tool which can read data from different data sources and plot the visualization, depending on the use case. This plot can be combined to create a unique dashboard that you can integrate into any of your custom applications, to visualize or use it as it is.
Elastic Search is an open-source, distributed data store for full-text search engine. It uses a JSON-based document structure to index the data obtained and store it. It uses the Inverted Index structure, which helps in fast keyword searches in stored data.
The topics covered in this blog include:
- Using Helm chart, Deploy Elastic Search and Grafana on Kubernetes (K8s) cluster.
- Creating a basic iDRAC visualization dashboard.
- Configuring the Alert Manager in Grafana, and then enabling it in the visualization dashboard.
Deployment Activity
Prerequisites
- A fully configured Linux environment
- K8s installed in your Linux environment
- An iDRAC system with data telemetry services enabled
Once all the prerequisites are ready, you can begin deploying the major open-source applications (Elastic Search and Grafana). This deployment should be performed on a K8s cluster.
Elastic Search
To install Elastic Search:
- Using Helm, add the elastic repository:
helm repo add elastic https://helm.elastic.co - Install Elastic Search:
helm install elastic-release elastic/elasticsearch -n {namespace_name}
Note: replace namespace_name with your defined namespace.
3: Test the Elastic Search instance:
kubectl port-forward svc/elasticsearch-master 9200 -n {namespace_name}
curl localhost:9200
Grafana
To install Grafana:
- Using Helm, add the bitnami repository:
helm repo add bitnami https://charts.bitnami.com/bitnami - Install Grafana:
helm install my-release bitnami/grafana -n {namespace_name}
Note: replace namespace_name with your defined namespace.
Fetching Data from iDRAC
The data telemetry should be fetched and sent to Elastic Search based on the configured time. In the next section, you can see how to fetch the data from iDRAC to Elastic Search.
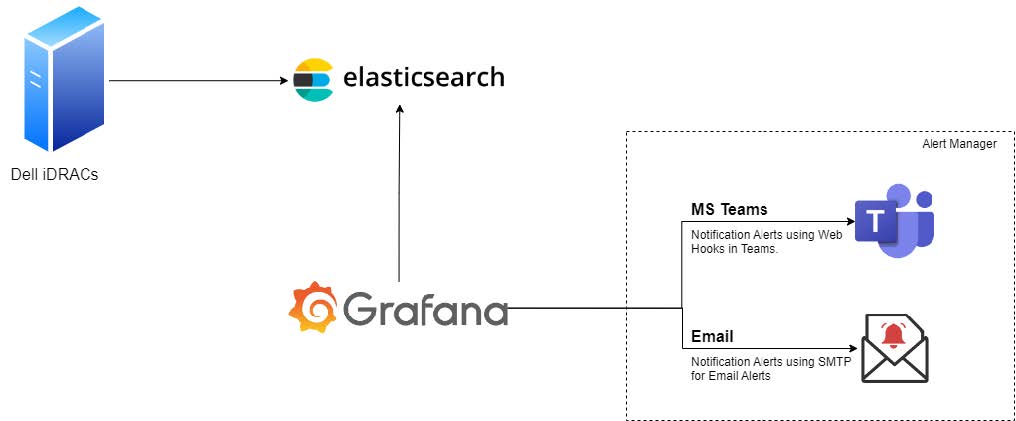
Figure 1: Connectivity diagram
Enabling the Alert Manager
MS-Teams notifications
- Create a Teams Channel where notifications will be sent.
- Click the ellipsis (…) in the top-right pane, and then select Channel notifications -> Connectors.
- Select and configure the Incoming Webhook by providing the required information.
- Once the configuration is complete, copy the URL and save the channel configuration.
Note: The copied URL must be provided in the Alerts section of Grafana.
- In Grafana, select Menu-> Alerts.
- Go to Contact Points.
- Create a contact point by providing the required information.
- Save the contact point.
- Run a test notification to verify that alerts are reaching to the newly created Teams Channel.
Configure email notifications
The Email notifications are sent using SMTP service. You must configure notifications using a YAML file or using Environment Variables.
Method 1: Using a YAML file
- Add and enable the following configuration your YAML file before deploying the Grafana instance on your K8s cluster:
smtp:
enabled: false
user: user
password: password
host: ""
fromAddress: ""
fromName: ""
skipVerify: "false"
existingSecret: ""
existingSecretUserKey: user
existingSecretPasswordKey: password - Run the kubectl command to install the Grafana instance.
Method 2: Using an environment variable
- Edit the deployment of the Grafana instance:
kubectl edit deployment {deployment_name} - Add the following configuration details to the file:
- env:
— name: GF_SMTP_ENABLED
value: “true”
— name: GF_SMTP_HOST
value: {SMPT_IP}:{PORT}
— name: GF_SMTP_PASSWORD
value: xxxxxxxxxxxx
— name: GF_SMTP_USER
value: apikey
— name: GF_SMTP_FROM_ADDRESS
value: test@test.com
— name: GF_SMTP_FROM_NAME
value: System Admin - Save the file. Kubernetes will automatically roll out the new configuration.
- Test the new configuration:
- In Grafana, go to Alerts Notifications.
- Select the notification channel.
- If no email channel is present, add a channel with an email address.
- Enter the notification recipient email address.
- Run the test configuration to verify that the recipient email gets a test notification.
Approach
Once the above deployment is completed, login with the default username and password configured in Grafana, to check whether Grafana is up and running. The steps below enable you to view the Grafana dashboard.
Add a data source
You can add a data source in two different ways: by using the values.yml file, or by using the Grafana UI.
Method 1: Using the values.yml file
Create and add the configuration below in the datasource.yml file:
datasources:
secretName: ""
secretDefinition:
apiVersion: 1
datasources:
- name: { datasource_name}
type: { datasource_type }
url: { datasource_url }
access: { access_type }
isDefault: { true/false }
Example:
datasources:
## @param datasources.secretName The name of an externally-managed secret containing custom datasource files.
##
secretName: ""
## @param datasources.secretDefinition The contents of a secret defining a custom datasource file. Only used if datasources.secretName is empty or not defined.
## Example:
## secretDefinition:
## apiVersion: 1
## datasources:
## - name: Prometheus
## type: prometheus
## url: http://prometheus-prometheus-server
## access: proxy
## isDefault: true
Method 2: Using the Grafana UI
- From the Grafana UI navigation section, select the Settings icon. It resembles a cog wheel.
- Select the Data Source option.
- Add the new data source.
- Search for the Elastic Search data source.
- Select the data source from the search results. The configuration window displays.
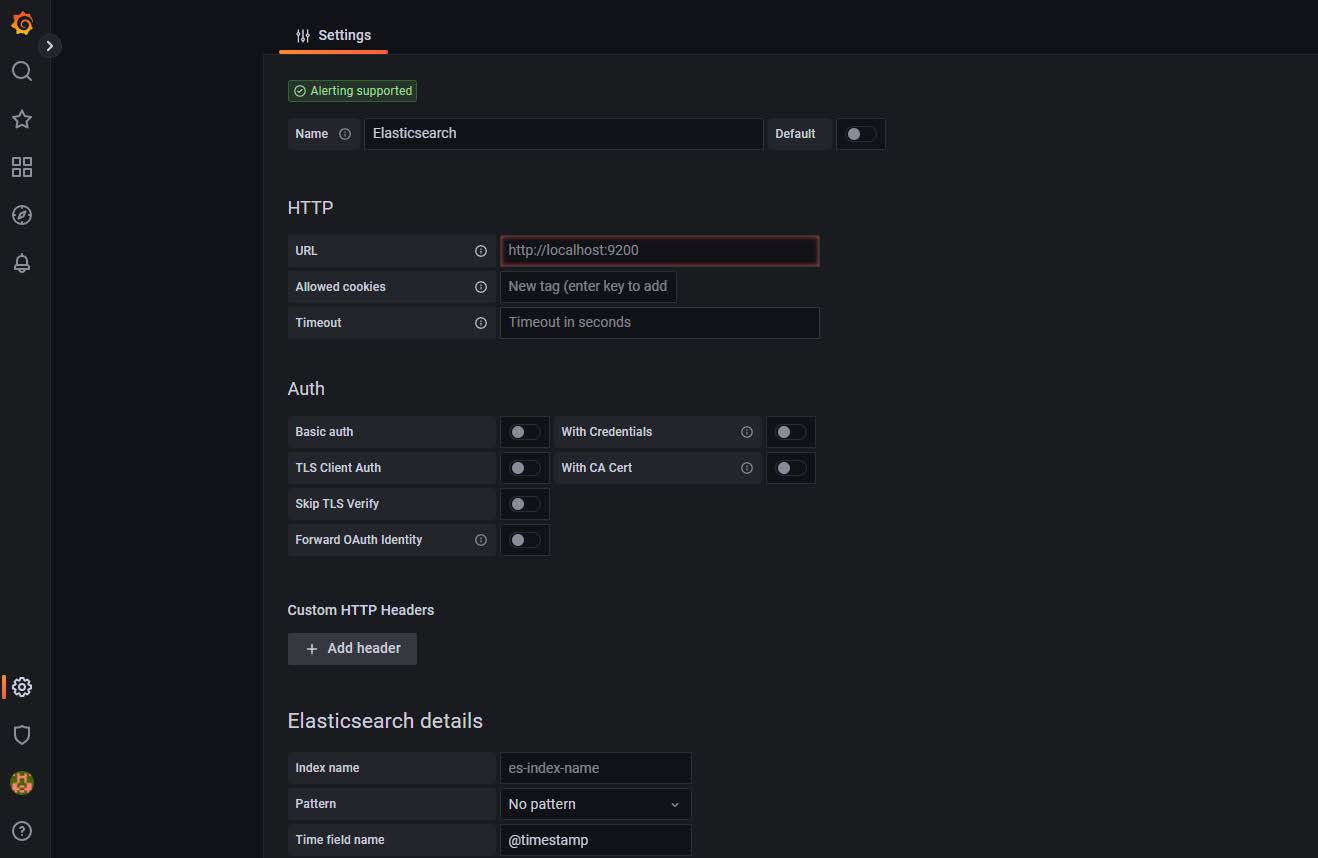
Figure 2: Configuration window
- Add the URL, authentication details, and so on.
- Save and then test the configuration.
A successful test confirms that data source is added successfully.
Create the dashboard
- In the Grafana UI, select the Dashboards icon in the left pane.
- Expand the New drop-down in the right pane.
- Select New Dashboard.
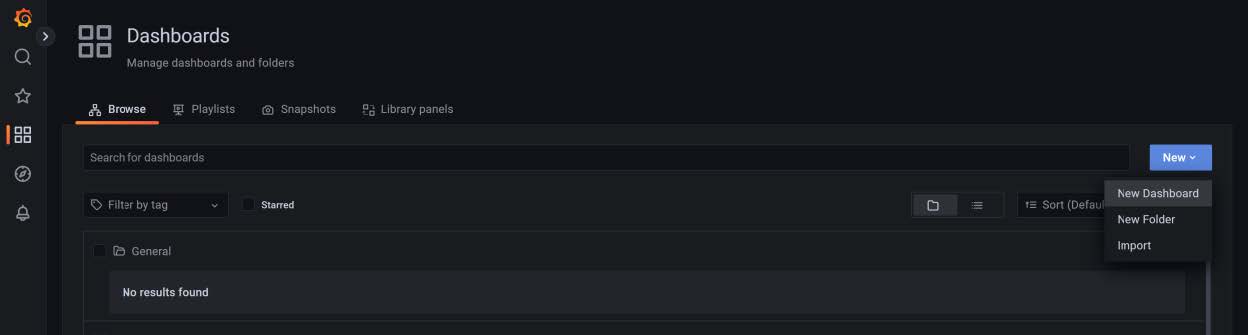
Figure 3: Creating a dashboard
Create the dashboard panels
- Select the Panels and rows according to the use-case and map the data source that you created in Add a data source.
- Once the data source is mapped, create a query to fetch the details from the data source to visualize the data.
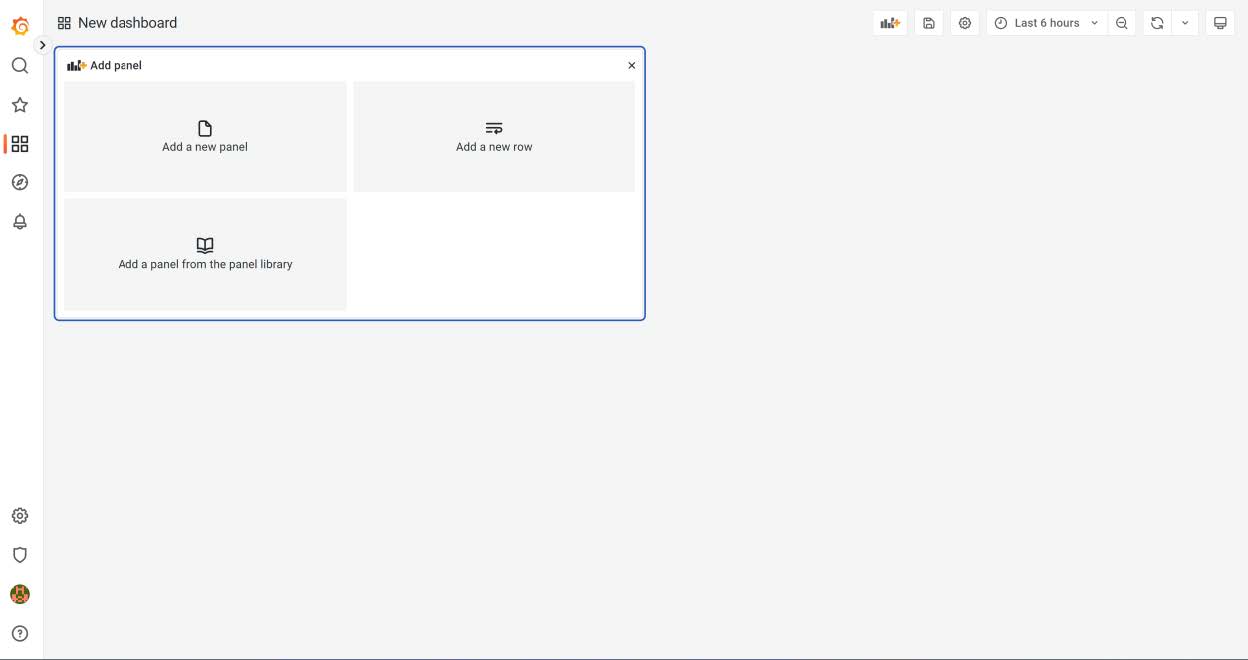
Figure 4: New dashboard panels
Configure the alerts notifications threshold
In the right panel you will find the threshold section, where you can configure the alert threshold. See the figure below.
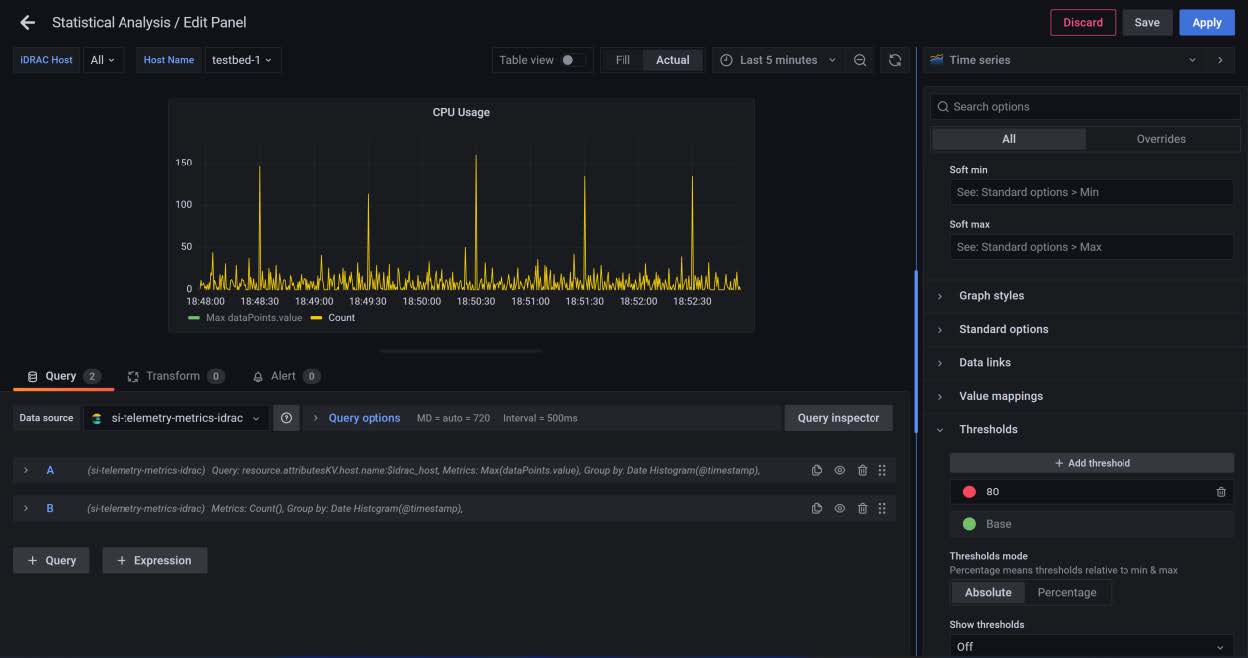
Figure 5: Threshold configuration
Results
The results are displayed as in the figure below.
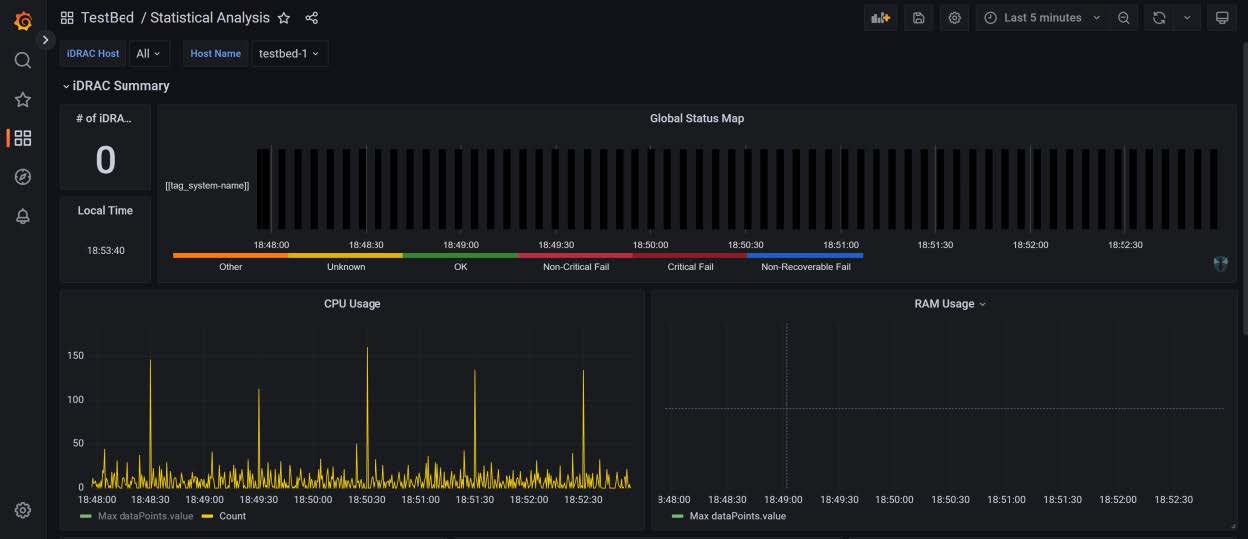
Figure 6: Simple dashboard with configured alerts
Conclusion
This blog helps enterprise data visualization teams to implement Grafana in K8s, and to configure the data source and alert notifications.
Related Blog Posts

PowerProtect Kubernetes Advanced Asset Source Configuration
Mon, 07 Aug 2023 23:05:40 -0000
|Read Time: 0 minutes
In this blog, we’ll go through some of the advanced options we’re enabling as part of the Kubernetes (K8s) asset source configuration in PowerProtect Data Manager (PPDM). These advanced parameters can be specified when adding a new K8s asset source or when modifying an existing one. Let’s look at some use cases and how PPDM can help.
Use Case 1: Internal registry
For a great first use case, let’s look at an advanced controller configuration. The advanced configuration, on the pod called ‘powerprotect controller,’ allows you to configure key-value pairs. There are nine pairs documented in the PowerProtect Kubernetes User Guide, but we will focus on the most important ones in this blog.
This one allows you to define an internal registry from which you can pull container images. By default, the required images are pulled from Docker Hub. For example:
Key: k8s.docker.registry
Value: idan-registry.example.com:8446
The value represents the FQDN of the registry, including the port as needed. Note that if the registry requires authentication, the k8s.image.pullsecrets key-value pair can be specified.
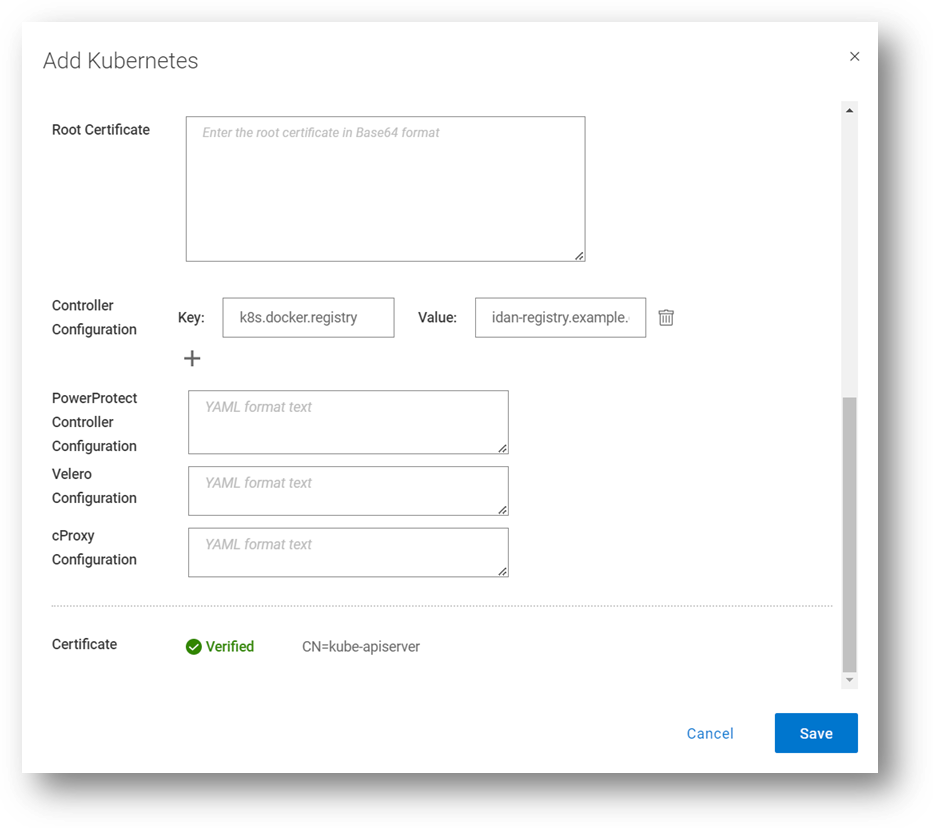
By the way, I’ve discussed the Root Certificate option in previous blogs. Take a look at PowerProtect Data Manager – How to Protect AWS EKS Workloads? and PowerProtect Data Manager – How to Protect GKE Workloads?.
Use Case 2: Exclude resources from metadata backup
The second use case we’ll look at enables the exclusion of Kubernetes resource types from metadata backup. It accepts a comma-separated list of resources to exclude. For example:
Key: k8s.velero.exclude.resources
Value: certificaterequests.cert-manager.io
Use Case 3: PowerProtect Affinity Rules for Pods
Another useful advanced option is the ability to customize any or all PowerProtect-related pods - powerprotect-controller, Velero, cProxy, and their configurations. The third use case we’ll cover is Affinity Rules.
Example 1 – nodeAffinity
The first example is nodeAffinity which allows you to assign any PowerProtect pod to a node with a specific node label.
This case may be suitable when you need to run the PowerProtect pods in specific nodes. For example, perhaps only some of the nodes have 10Gb connectivity to the backup VLAN, or only some of the nodes have connectivity to PowerProtect DD.
In the following example – any node with the app=powerprotect label can run the configured pod. This example uses the requiredDuringSchedulingIgnoredDuringExecution node affinity option, which means that the scheduler won’t run this pod on any node unless the rule is met.
Note: This must be in YAML format.
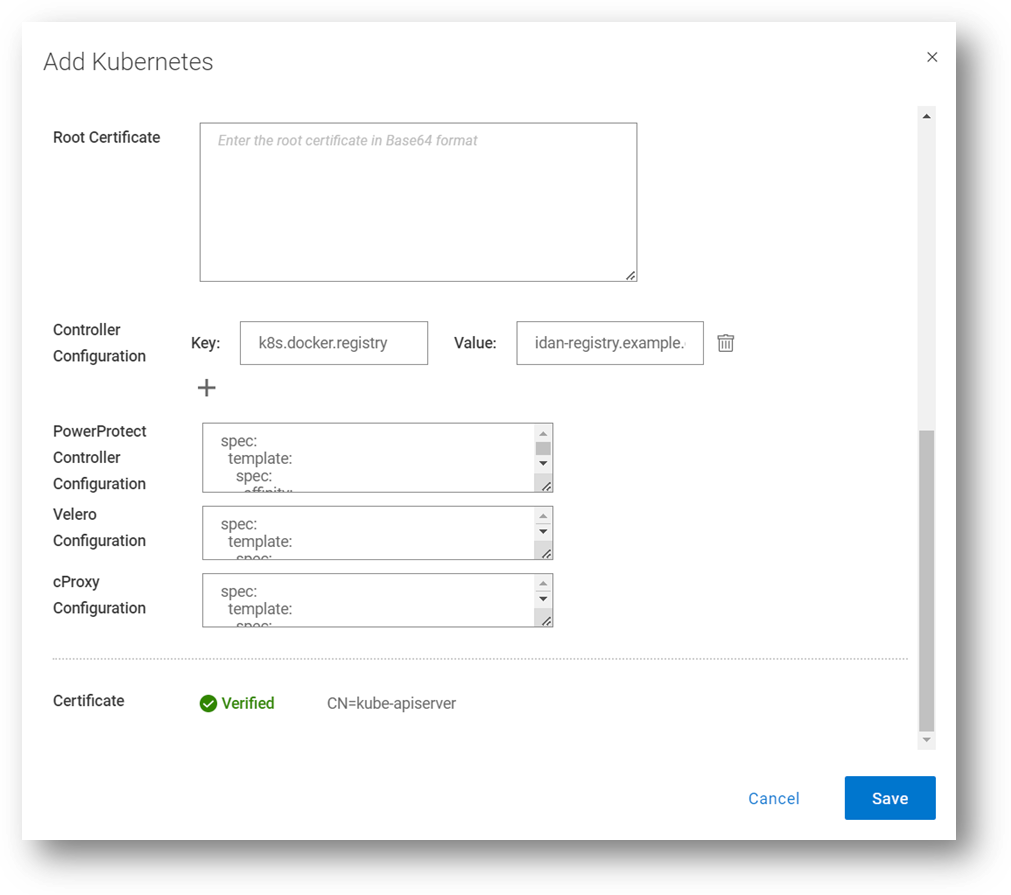
The configured pod is patched with the following configuration:
spec:
   template:
    spec:
      affinity:
        nodeAffinity:
           requiredDuringSchedulingIgnoredDuringExecution:
            nodeSelectorTerms:
            -   matchExpressions:
               - key: app
                 operator: In
                 values:
                  - powerprotect
Here’s another example, but this time with the preferredDuringSchedulingIgnoredDuringExecution node affinity option enabled. This means the scheduler tries to find a node that meets the rule, but if a matching node is not available the scheduler still schedules the pod.
spec:
  template:
    spec:
      affinity:
        nodeAffinity:
           preferredDuringSchedulingIgnoredDuringExecution:
            - weight: 1
              preference:
                matchExpressions:
                - key: app
                  operator: In
                  values:
                  - powerprotect
Here we can see how it is configured through the PowerProtect Data Manager UI, when registering a new K8s asset source, or when editing an existing one. In this screenshot, I’m updating the configuration for all the PowerProtect pods (powerprotect-controller, Velero, and cProxy), but it’s certainly possible to make additional config changes on any of these PowerProtect pods.
Example 2 – nodeSelector
Another much simpler example for node selection is nodeSelector. The pods would only be scheduled to nodes with the specified labels.
spec:
   template:
    spec:
      nodeSelector:
        app: powerprotect
Example 3 – nodeName
In this example we’ll examine an alternative way of assigning one of the PowerProtect pods to specific worker nodes.
spec:
   template:
    spec:
      nodeName: workernode01
Example 4 – Node Anti-affinity
The final example we’ll look at for nodeAffinity is anti-affinity, with operators including NotIn or DoesNotExist. The case for using anti-affinity is to enable scheduling the PowerProtect pods only to specific nodes that do not have a specific label or a certain role.
spec:
   template:
    spec:
      affinity:
        nodeAffinity:
           requiredDuringSchedulingIgnoredDuringExecution:
            nodeSelectorTerms:
            -   matchExpressions:
               - key: app
                 operator: NotIn
                 values:
                 - powerprotect
Use Case 4: Multus and custom DNS configuration
Another popular use case is Multus and custom DNS configuration. Multus is a Container Network Interface (CNI) plugin for Kubernetes that enables attaching multiple network interfaces to pods. I won’t elaborate too much on Multus’ features and capabilities here, but I’ll show some examples of how to customize the PowerProtect pod specs to accept multiple NICs and custom DNS configuration.
Example 1 – dnsConfig
spec:
   template:
    spec:
      dnsConfig:
        nameservers:
          - "10.0.0.1"
        searches:
          - lab.idan.example.com
          - cluster.local
Example 2 – Multus
metadata:
  annotations:
    k8s.v1.cni.cncf.io/networks: macvlan-conf
spec:
  template:
    spec:
      dnsConfig:
        nameservers:
          - "10.0.0.1"
        searches:
          - lab.idan.example.com
          - cluster.local
Always remember –documentation is your friend! The PowerProtect Data Manager Kubernetes User Guide has some useful information for any PPDM with K8s deployment.
Thanks for reading, and feel free to reach out with any questions or comments.
Idan
Author: Idan Kentor

Kubernetes Application Consistency with PowerProtect Data Manager
Wed, 17 May 2023 15:56:55 -0000
|Read Time: 0 minutes
In this blog, let’s review application consistency for Kubernetes apps using PowerProtect Data Manager (PPDM).
PowerProtect Data Manager has been providing the ability to run pre/post K8s backup tasks (called hooks) for quite some time now. Now, these hooks can certainly quiesce the database running on K8s pods before the backup starts and end backup as a post-action for app-consistency, but these hooks can also be used to run pre/post actions on the pods as needed.
In this blog, I’ll also cover some use cases of app-consistency for K8s in PPDM and some advanced options. Hang tight, here we go.
Introduction and initial configuration
You can manage K8s application consistency in PowerProtect Data Manager by using the ppdmctl utility, which includes example application templates for the following databases:
- MySQL (standalone and cluster)
- PostgreSQL (standalone and cluster using helm chart)
- Cassandra (standalone)
- MongoDB (standalone and single shard cluster)
Obtain
You can obtain the ppdmctl utility through the PowerProtect Data Manager UI (under System Settings > Downloads > Kubernetes) or directly using the following URL:
https://<your-ppdm-host>/k8s-binaries-download?filename=/usr/local/brs/lib/cndm/misc/pptdmctl.tar.gz
Note that you need to login to the PPDM UI for this link to work.
You can also find the archive on the PPDM host itself at the following path: /usr/local/brs/lib/cndm/misc/ppdmctl.tar.gz
Run
In order to run ppdmctl, you’ll need to extract the archive, change directory, and make it executable:
tar zxvf ppdmctl.tar.gz
cd ppdmctl
chmod +x ppdmctl
Now, before we see how to apply an application template, let’s look at some useful commands:
ppdmctl help – shows the main help page
ppdmctl applicationtemplate --help – shows help for a specific command, applicationtemplate in this case
ppdmctl applicationtemplate apply --help – shows help for a specific flag, in this case applicationtemplate apply
ppdmctl completion bash | sudo tee -a /etc/bash_completion.d/ppdmctl – applies autocompletion. Note that in this case we’re applying the BASH flavor but Fish, PowerShell and Zsh are also available.
Applying Application Templates
You can apply an application template using the following command, for example by using one of the MySQL example templates:
ppdmctl applicationtemplate apply -i examples/mysqlapptemplate.yaml -n mysqlApplying an application template creates an applicationtemplates.powerprotect.dell.com CR:
kubectl get applicationtemplates -n mysqlNAME AGE mysql 1d
Application Templates Structure
Let’s have a look at the one of the included example application templates for MongoDB:
cat mongodbapptemplate1sts.yaml
apiVersion: "powerprotect.dell.com/v1beta1"
kind: ApplicationTemplate
metadata:
    name: mongodbtemplate
     namespace: mongodb-helm
spec:
    enable: true
    type: "MONGODB"
    appLabel: "app.kubernetes.io/name:mongodb"
     appActions:
       Pod:
            preHook:
                command: '["/bin/sh", "-c", "mongo -u root -p $MONGODB_ROOT_PASSWORD $MONGODB_PRIMARY_ROOT_PASSWORD --eval \"db.fsyncLock()\""]'
            postHook:
                command: '["/bin/sh", "-c", "mongo -u root -p $MONGODB_ROOT_PASSWORD $MONGODB_PRIMARY_ROOT_PASSWORD --eval \"db.fsyncUnlock()\""]'
       StatefulSet:
            selectors:
               - selectorTerms:
                    - field: "Name"
                      selectorExpression: ".*-[1-9][0-9]*$"
               - selectorTerms:
                    - field: "Name"
                      selectorExpression: ".*-0$"
Check out the following list for some guidance about the structure and format of app templates. Later in this blog we’ll explore more settings.
- The apiVersion, kind, metadata and spec fields are all mandatory.
- The app template can be provided in a YAML or JSON format.
- The namespace specified must exist and match the only one specified when creating or applying the app template with ppdmctl.
- The type field under spec must match the type specified when applying or creating the app template using ppdmctl.
- appLabel must be specified and should preferably match a single pod on the specified namespace. You can confirm the appropriate label with the following kubectl command:
kubectl get pods -n <your-ns> --show-labels6. appActions is required and must include Pod and optionally the StatefulSet or Deployment parameters.
7. Either or both preHook and postHook are required.
8. Either the preHook or postHookcommand must be provided as a JSON array. Here are some examples:
- command: '[\"/usr/bin/backup_script\", \"--file\", \"/backups/backup.tgz\"]'
- command: '["/bin/sh", "-c", "mysql -uroot -p$(cat $MYSQL_ROOT_PASSWORD_FILE $MYSQL_MASTER_ROOT_PASSWORD_FILE) -e \"FLUSH TABLES WITH READ LOCK; FLUSH LOGS;SELECT SLEEP(100);\"\"]'
- command: '[\"/bin/sh\", \"-c\", \"BACKUPDIR=/db/backups ;SERVER=localhost; curl -XPOST http://$SERVER:9090/api/v1/admin/tsdb/snapshot;\"]'
9. If you need to exclude PVCs from protection, make sure that all PVCs that are being used by the backed-up pods are included in the backup. Inclusion/exclusion of PVCs can be configured as part of the protection policy, either when creating a new protection policy through the PPDM UI/ REST API or when editing an existing policy.
Using multiple labels
In some cases there are multiple pods that will be matched by a single label. For example, when multiple instances of the MySQL database are provisioned, app=mysql would result in many matched pods. In such cases, you can specify multiple values under appLabel as key-value pairs in a comma-separated list, as in the following examples:
- appLabel: "mariadb-master:yes,app:mariadbprod1"
- appLabel: "app.kubernetes.io/name:mongodb,component=mongo"
Running on a specific container
This use case is quite important for multi-container pods. If you need to run pre/post commands on a specific container on a given pod, you can specify that container under Pod, in the same block as the command. Note that by default the first container is being used unless the container parameter is specified. Check out the following example:
kubectl get pods -n mariadb
NAME            READY   STATUS     RESTARTS   AGE
mariadb-sts-0   2/2     Running    0          20d
kubectl get pods -n mariadb mariadb-sts-0 -o jsonpath='{.spec.containers[*].name}'
mariadb maria-tools-sidecar
cat mariadbapptemplate.yaml
apiVersion: "powerprotect.dell.com/v1beta1"
kind: ApplicationTemplate
metadata:
    name: mariadbtemplate
     namespace: mariadb
spec:
    type: "MARIADB"
    enable: true
    appLabel: "mariadb-master:yes,app:mariadbprod1"
     appActions:
       Pod:
            preHook:
                command: "[\"/bin/sh\", \"-c\", \"export BACKUPDIR=/var/lib/mysql/backups; if ls $BACKUPDIR/*_full.bak 1> /dev/null 2>&1; then mariabackup --backup --stream=mbstream --extra-lsndir=$BACKUPDIR/backup_incr --incremental-basedir=$BACKUPDIR/backup_base --user=root --password=$MARIADB_ROOT_PASSWORD | gzip --rsyncable > $BACKUPDIR/backup.$(date +%F_%R:%S)_incr.bak; else mariabackup --backup --stream=mbstream --extra-lsndir=$BACKUPDIR/backup_base --user=root --password=$MARIADB_ROOT_PASSWORD | gzip --rsyncable > $BACKUPDIR/backup.$(date +%F_%R:%S)_full.bak; fi; exit $?\"]"
                container: "mariadb"
…
Timeout
Another important capability is controlling the command timeout which can be performed by specifying the timeout parameter. By default, each command has a timeout of 30 seconds. For cases where there is a risk that the command might take longer, the timeout parameter can be specified. This especially relevant for DB dump / backup processes.
For example, let’s look at the first app template but this time with the timeout parameter:
apiVersion: "powerprotect.dell.com/v1beta1"
kind: ApplicationTemplate
metadata:
    name: mongodbtemplate
     namespace: mongodb-helm
spec:
    enable: true
    type: "MONGODB"
    appLabel: "app.kubernetes.io/name:mongodb"
     appActions:
       Pod:
            preHook:
                command: '["/bin/sh", "-c", "mongo -u root -p $MONGODB_ROOT_PASSWORD $MONGODB_PRIMARY_ROOT_PASSWORD --eval \"db.fsyncLock()\""]'
                timeout: 60
…
Behavior upon failure
The final advanced capability I want to talk about today is onError. OnError defaults to Fail but Continue is another possible value which means that if a certain pre or post hook fails then the backup flow carries on.
Here’s the last application template but with the OnError parameter this time:
apiVersion: "powerprotect.dell.com/v1beta1"
kind: ApplicationTemplate
metadata:
    name: mongodbtemplate
     namespace: mongodb-helm
spec:
    enable: true
    type: "MONGODB"
    appLabel: "app.kubernetes.io/name:mongodb"
     appActions:
       Pod:
            preHook:
                command: '["/bin/sh", "-c", "mongo -u root -p $MONGODB_ROOT_PASSWORD $MONGODB_PRIMARY_ROOT_PASSWORD --eval \"db.fsyncLock()\""]'
                timeout: 60
                onError: Continue
…
Always remember – the documentation is your friend. Specifically, the PowerProtect Data Manager Kubernetes User Guide has some useful information for any PPDM with K8s deployment.
Feel free to reach out with any questions or comments.
Thanks for reading,
Idan
Author: Idan Kentor