

Assets

Empowering Server Power Efficiency Profiles: Unleashing Power Savings in Bills & Usage

Tue, 16 Apr 2024 15:48:44 -0000
|Read Time: 0 minutes
Introduction
Over the last few years, the cost of power has continued to increase alongside the amount of power used in most data centers. Given these trends, customers are searching for strategies to reduce both the economic and environmental footprint of powering their server estates.
Simple strategies include virtualization and consolidation to reduce the number of physical servers, identifying zombie servers to be retired, and replacing older, less efficient servers with newer servers offering improved performance per watt.
BIOS System Profile Settings
Beyond the aforementioned strategies, Dell PowerEdge server customers can increase their power savings by selecting CPU power management and energy efficient policy settings in the system BIOS. These settings configure a collection of the rules that relate to server chip set behavior, including CPU C-state and CPU turbo mode, to increase power usage efficiency.
Selecting the most relevant setting can reduce CPU power demands while continuing to meet performance requirements to produce significant long-term cost savings. For example, in Intel®-based PowerEdge servers, customers can enable Dynamic Application Power Management (DAPC), which allows the BIOS to manage processor power states in order to achieve maximized performance per watt at all utilization levels. The full details of BIOS System Profile Settings can be found in the white paper, Set-up BIOS on the 16th Generation of PowerEdge Servers.
Testing and results
To demonstrate the effectiveness of the various profiles on power efficiency and server performance settings, SPEC Power® 2008 version 1.11.0 benchmarking was run for each setting. The SPEC Power® benchmark exercises the server at ten workload levels and combines power and performance into a single metric that measures power efficiency in operations per watt.
Table 1. SPEC Power® benchmark results
Max Perf Performance | DAPC Performance | DAPC Balanced Perf | DAPC Balanced Energy | DAPC Energy Efficient | |
SPEC Power® Score | 8621 | 10311 | 10378 | 11105 | 11564 |
SPEC Power® 100% OP/s | 8,383,505 | 8,380,816 | 8,399,796 | 8,402,421 | 8,451,740 |
SPEC Power® 100% Watts | 602 | 602 | 602 | 602 | 602 |
SPEC Power® 100% Score PPR | 13924 | 13921 | 13943 | 13956 | 14036 |
SPEC Power® 60% OP/s | 5,052,076 | 5,047,622 | 5,068,899 | 5,051,143 | 5,066,320 |
SPEC Power® 60% Watts | 549 | 488 | 477 | 392 | 360 |
SPEC Power® 60% Score PPR | 9198 | 10343 | 10624 | 12890 | 14084 |
SPEC Power® Idle Watts | 269 | 125 | 125 | 121 | 122 |
We selected a Dell PowerEdge server with dual Intel® 6448Y 2.1GHz 32 cores with 256GB ram for the test. The SPEC Power® benchmark was run by the Dell Technologies Server Performance Analysis (SPA) team in the Dell Technologies Austin Server Performance lab. The summary of the results in Table 1 shows that using DAPC/Energy Efficient policy delivered the best overall SPEC Power® score with comparable performance. Looking at the individual results more closely, a server at 100% utilization has the same power usage irrespective of the BIOS profile. However, given that most customers are not running their servers at 100%, the 60% results have been highlighted, demonstrating the power savings available for a representative customer.
Substantial energy efficiency delivered
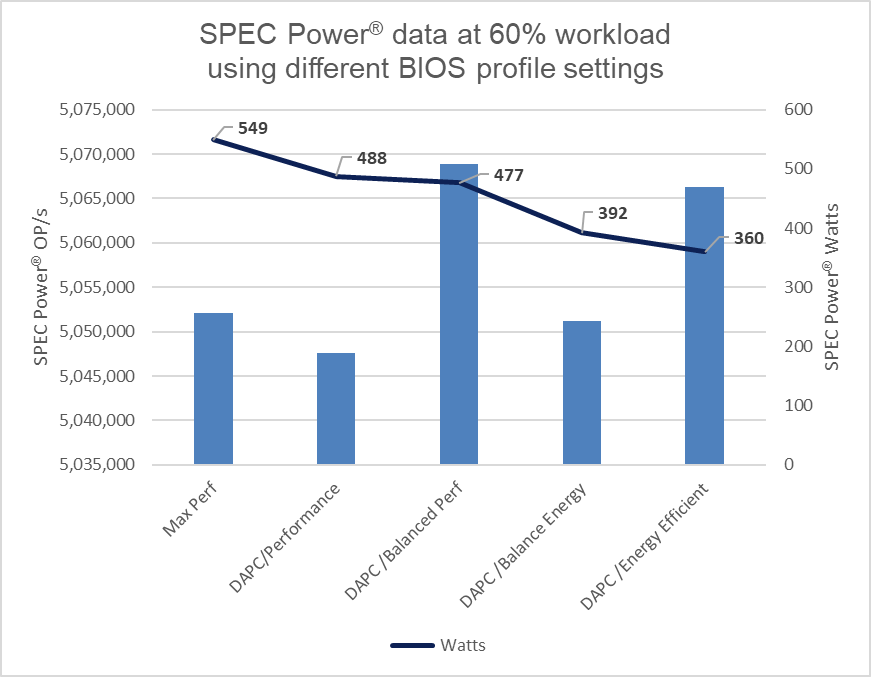
Figure 1. SPEC Power® results at 60%
The DAPC/Energy Efficient policy delivered 35% more savings in power usage as compared to the Max Performance profile.
Considering the average EU energy costs of $0.21[1] for an estate of 100 servers running at 60% load, there is a potential savings of $380,797 in energy costs over four years when comparing the Max Performance profile to the Energy Efficient policy. For a 1000-server estate, these potential savings increase to $1,523,188, all while maintaining server performance.
Those who have purchased an electric car in the last few years know that the range advertised by the manufacturer can differ to the mileage delivered in the real world. Treat these Dell Technologies results as guidance. It is recommended that customers run their own testing using their workloads.
These results are from Dell Technologies in-house testing as of January 2024. The cost of power was sourced from Consumer Energy Prices in Europe (qery.no). The full spec2008 results are posted on spec.org.
Changing BIOS profiles
BIOS profiles can be set several ways, the simplest being from the server BIOS access at boot using the <F2> key. That said, when faced with more than a few servers, this method becomes very time-consuming. There are a number of methods to automate this process, including running a script at the iDRAC API level or using a server configuration profile. A server configuration profile (SCP) is sometimes referred to as a template and can be used to bundle the system profile setting into the server firmware configuration. Using a tool such as OpenManage Enterprise (OME), a server template can then be deployed to each server’s iDRAC—or Dell remote access controller—to streamline and automate the application of these BIOS settings.
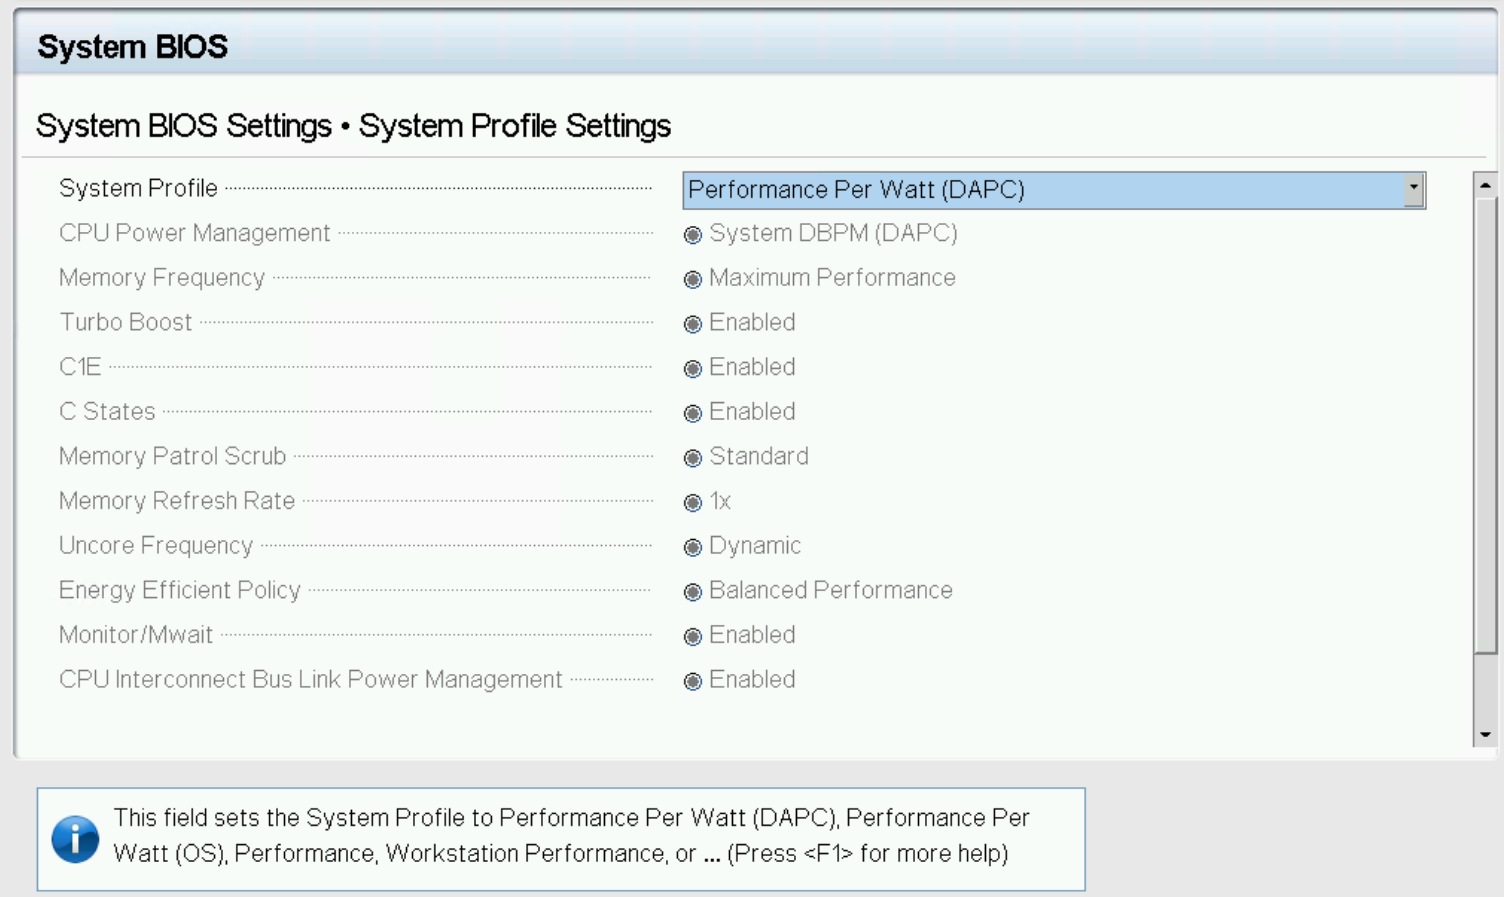
Figure 2. System profile in BIOS setup
For customers who want to track and report these settings on Dell PowerEdge servers, the Dell OME Power Manager plugin for OpenManage Enterprise enables the automatic grouping of servers by profile, displaying this information on the GUI as shown in Figure 3. The Power Manager plugin also offers a ready-to-run report template that breaks down the entire server estate, grouped by server profile. This report can be scheduled or run ad hoc.
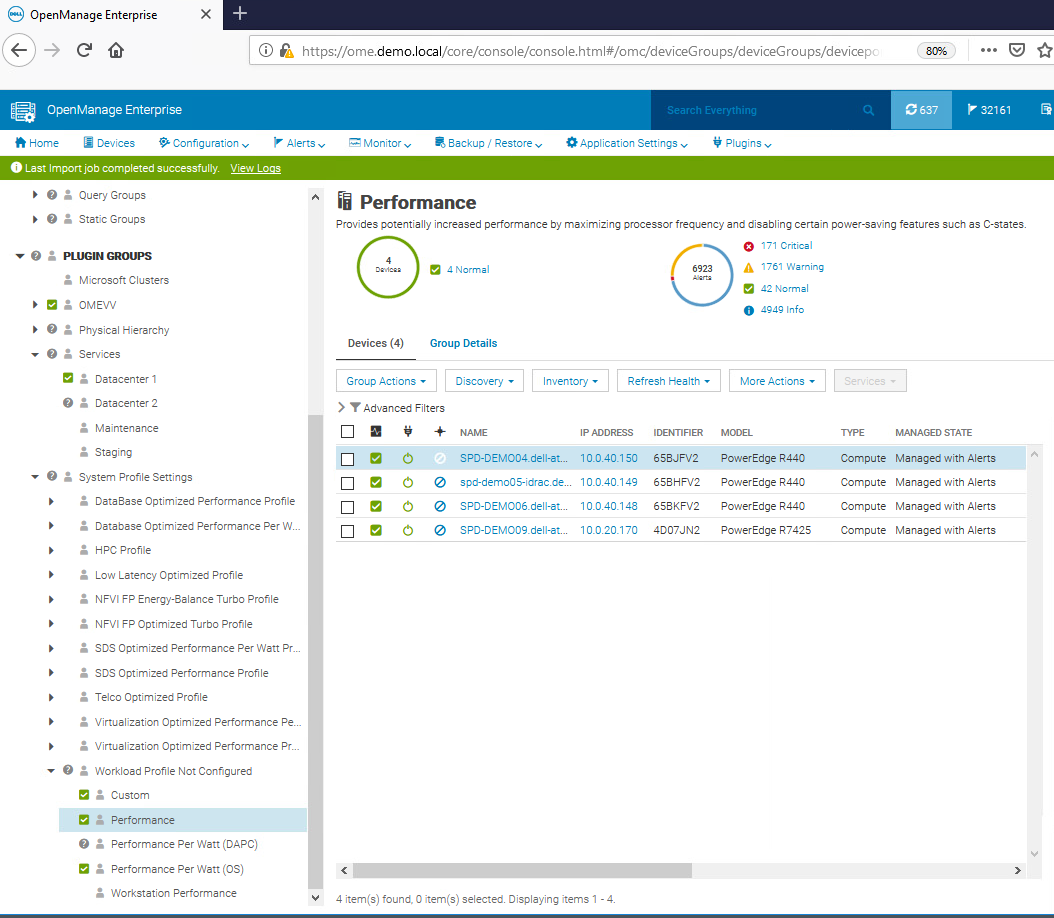
Figure 3. OpenManage Enterprise displaying BIOS profiles
System profiles and BIOS settings in detail
The following tables provide detailed background information about each system profile and the BIOS settings they alter for Intel®- and AMD-based PowerEdge servers.
Table 2. Intel® Platform System Profile
System Profile Settings | Performance Per Watt Optimized (DAPC) | Performance Per Watt Optimized (OS) | Performance | Workstation Performance |
CPU Power Management | System DBPM (DAPC) | OS DBPM | Maximum Performance | Maximum Performance |
Memory Frequency | Maximum Performance | Maximum Performance | Maximum Performance | Maximum Performance |
Turbo Boost | Enabled | Enabled | Enabled | Enabled |
Energy Efficient Turbo | Enabled | Enabled | Disabled | Disabled |
C1E | Enabled | Enabled | Disabled | Disabled |
C-States | Enabled | Enabled | Disabled | Enabled |
Memory Patrol Scrub | Standard | Standard | Standard | Standard |
Memory Refresh Rate | 1x | 1x | 1x | 1x |
Uncore Frequency | Dynamic | Dynamic | Maximum | Maximum |
Energy Efficient Policy | Balanced Performance | Balanced Performance | Performance | Performance |
Monitor/Mwait | Enabled | Enabled | Enabled | Enabled |
CPU Interconnect Bus Link Power Management | Enabled | Enabled | Disabled | Disabled |
PCI ASPM L1 Link Power Management | Enabled | Enabled | Disabled | Disabled |
Workload Configuration | Balance | Balance | Balance | Balance |
Table 3. AMD Platform System Profile
System Profile Settings | Performance Per Watt Optimized (OS) | Performance |
CPU Power Management | OS DBPM | Maximum Performance |
Memory Frequency | Maximum Performance | Maximum Performance |
Turbo Boost | Enabled | Enabled |
C-States | Enabled | Disabled |
Memory Patrol Scrub | Standard | Standard |
Memory Refresh Rate | 1x | 1x |
PCI ASPM L1 Link Power Management | Enabled | Disabled |
Determinism Slider | Power Determinism | Power Determinism |
Power Profile Select | High Performance Mode | High Performance Mode |
PCIE Speed PMM Control | Auto | Auto |
EQ Bypass To Highest Rate | Disabled | Disabled |
DF PState Frequency Optimizer | Enabled | Enabled |
DF PState Latency Optimizer | Enabled | Enabled |
Host System Management Port (HSMP) Support | Enabled | Enabled |
Boost FMax | 0 - Auto | 0 - Auto |
Algorithm Performance Boost Disable (ApbDis) | Disabled | Disabled |
Dynamic Link Width Management (DLWM) | Unforced | Unforced |
Conclusion
When implementing strategies for increasing server energy efficiency, selecting a BIOS system profile can result in significant power savings with minimal or no server performance degradation. The power cost savings for a 1000-server estate could potentially be $1,390,737 over four years. Additionally, as a result of low processor power consumption, the load on the cooling system in the data center is reduced, increasing savings on energy costs and power. Customers running an estate of Dell PowerEdge servers should review their use of these BIOS settings for their server workloads to better understand how these profiles can help to reduce power usage and lower energy bills.
References
- SPEC Power® benchmark details
- Dell Server BIOS attributes
- Infographic: Save energy and save money with Dell OpenManage Enterprise Power Manager
[1] For non-household consumers such as industrial, commercial, and other users not included in the households sector, average electricity prices in the EU stood at €0.21 per kWh (excluding VAT and other recoverable taxes and levies) for the first half of 2023 according to the latest Eurostat data, Consumer Energy Prices in Europe (qery.no)
Authors: Mark Maclean, PowerEdge Technical Marketing Engineering; Kevin Locklear, ISG Sustainability; Donald Russell, Senior Performance Engineer, Solution Performance Analysis