
Blogs
Short articles related to servers' systems management.

14 reasons to fall in love with Dell OpenManage Enterprise 4.0 this Valentine’s Day

Tue, 13 Feb 2024 18:40:11 -0000
|Read Time: 0 minutes
It’s Valentine’s Day, and love is in the air. Dell OpenManage Enterprise is ready to sweep you off your feet with its 14 swoon-worthy features. Imagine a romantic dinner, but instead of music, there are servers humming in perfect harmony, and instead of roses, there is a management tool that makes your heart flutter. OpenManage Enterprise is like the perfect date: attentive, reliable, and always there to make sure the bond between administrators and PowerEdge servers is as smooth as silk. So, grab a box of chocolates, cuddle up with your server rack, and let's dive into the 14 features of Dell OpenManage Enterprise (also known as OME) that will make you believe in love at first sight!
❤❤❤❤❤❤❤❤❤❤❤❤❤❤❤❤❤❤❤❤❤❤❤❤❤❤❤❤❤❤❤
1. OME offers lifecycle management for Dell PowerEdge servers
This includes orchestrated discovery of servers, health monitoring, firmware updating, warranty status information, and alert response automation such as SNMP Trap Forwarding and Forwarding to Syslog servers, as well as more than 30 reports as standard with the ability to create custom reports, all delivered in a virtual appliance.
2. Apply VMware cluster-aware firmware updates.
A feature offered by the OME plugin for VMware OMEVV. This leverages VMWare’s vCenter, DRS, and maintenance mode to sequentially update each member server in a cluster with zero down time for your virtual machines during firmware updates.
3. Chart and analyze telemetry information from multiple servers
Visualise multivariate metrics on one graph in OME Power Manager for review. This data includes key performance / power / thermal & IO data. Develop and review a baseline of server performance over time to spot trends and problems before they become an issue.
4. Automatically create Service Requests with Dell Technical Support.
When a hardware failure is detected, OME Service plugin creates a case with Dell , reducing the time to fix. Note : Dell pro support contract required.
5. Enable OME iDRAC credential management (password rotation),
keep OME iDRAC usage compliant with organisations password rotation policy
6. Monitor servers’ power consumption, respond to thermal events, report carbon emissions, and cap the power if required
With OME Power Manager managing server power, customers can report energy usage and build a strategy to lower energy bills, even selected HPE and Lenovo servers are supported.
7. Streamline installation of new servers.
Remove manual steps by systematically deploy server configuration profiles templates and operating systems, reducing time to production for newly delivered servers
8. Build a single view of your entire Dell infrastructure including server, storage, networking, and data protection
Plug OME data into Dell’s cloud-based proactive monitoring and predictive analytic tool, CloudIQ, to better collaborate and simplify operations.
9. Put server management into your pocket
Extend OME to your mobile device with OpenManage Mobile and get secure control where ever you are.
10. Make drift Detection Proactive
Drift management of firmware & settings gives visibility of issues while simultaneously reducing time and effort to resolve.
Drift Management improves operational efficiency and enhances server security posture.
11. Integrate ServiceNow n with OME
Deliver both population of the ServiceNow CMDB with OME data and automatic incident creation for critical events, combining data to enhance service delivery.
12. Integrate Microsoft System Center with OME
Bring Dell server monitoring, deployment, and configuration management into MECM and SCVMM, so customers can leverage skills and investment in system centre
13. Create an infrastructure as code environment
Use Dell’s packs for Terraform from HashiCorp or Redhat’s Ansible support. Watch this video of OME template deployment via Ansible to see just how simple it is.
14. Build custom automation and bespoke integrations
OME Restful API offers DevOps teams deep software-defined infrastructure
Show your PowerEdge servers some love and deploy OpenManage Enterprise 4.0 today.
Resources
OpenManage Enterprise white papers / videos: Support page
Dell System Management Info Hub: Tech notes, videos, infographics
OpenManage Enterprise hands on lab environment: Dell Software Demo Center
Authors: Mark Maclean OpenManage Technical Marketing Engineering
Linkedin : uk.linkedin.com/in/markmacleandell
Steve Daborn, Senior Global Product Marketing Manager
Linkedin : linkedin.com/in/stephendaborn

OpenManage Enterprise - Customer Success Stories
Tue, 05 Dec 2023 21:29:05 -0000
|Read Time: 0 minutes
We are often asked what the best tool is for managing Dell PowerEdge servers. In this blog, discover how both our in-house Dell IT team and Cambridge University, a long-term customer, use our server management solutions to manage thousands of PowerEdge servers, ultimately avoiding outages, boosting overall server productivity, reducing maintenance windows, and delivering increased operational efficiency.
How Dell IT excels in server management using Dell OpenManage
Dell’s in-house IT team manages over 18,000 PowerEdge servers. The fleet of servers range from brand new to five years old, resulting in a mix of server models and generations. These servers are located across eight major data centers globally. Workloads include Dell.com and back-office systems such as Dell’s order management system. In fact, Dell runs over 600 business applications. Many of these are mission critical, and an outage can have a major impact on customers, sales, and support, down to stopping even the production line.
Server hardware management is done via OpenManage Enterprise (OME), encompassing alerting, monitoring, firmware updating, and configuration deployment and management, as well as power consumption monitoring. Each data center has a dedicated OpenManage Enterprise instance responsible for approximately 2,500 servers.
Monitoring of server health events is covered by OME and integration with Service Now, which automatically creates trouble tickets and routes them to the appropriate team for remediation. Power usage data is collected and monitored, then used to optimize power load per rack cabinet and flag underutilized servers showing lower than expected power draw.
To aid automation and rapid distribution firmware, updates are collected, tested, and released via a customized catalogue. These custom catalogues are assembled and tested by the Dell IT server management team and are consumed by OME to orchestrate server updates. Urgent updates to resolve security CVEs can be pushed out at will by OME following a change management approval. The largest patch job completed by the team so far was an iDRAC firmware update task for 14,500 servers in one change request, demonstrating how scalable OME automation is.
Security is built into Dell’s processes and tools. Microsoft Active Directory integration enables the OME audit log to record who did what and when, recording the AD user account name. The team also use OME configuration drift detection reporting, which audits a server’s current configs against the desired state, highlighting non-conforming servers that OME can then resolve by re-applying a server template.
With Dell IT using OME at major scale in their complex production environment, any customer can be confident OME will perform at scale. As Dell IT says, “If you have Dell PowerEdge servers, you really need to be running OpenManage Enterprise.”
University of Cambridge server management at scale
 Dawn - UK’s fastest artificial intelligence (AI) supercomputer. Copyright Joe Bishop.
With an estate of 3,500 Dell servers plus other devices in one data center, the team at Cambridge University needs efficient and scalable server management. The HPCC server group uses integrated Dell Remote Access Controller (iDRAC) embedded in every server and OME to maximize the day-to-day efficiency of admin tasks such as health monitoring, firmware updates, and configuration.
Config management and drift detection are achieved via OME’s configuration compliancy features. Each cluster has a collection of firmware configuration settings. These templates are set and monitored centrally via OME with alerting set for non-compliant hosts. Firmware updates are also streamlined using OME and customized in-house firmware repositories built with OME update manager. Updates are scheduled and then left to run automatically against multiple servers, freeing administrators to focus on more novel tasks. Finally, server health monitoring is real-time. Any alerts are sent from iDRAC to OME with the status notified and logged by OME. Using the Dell TechDirect service portal, the team is able log fault calls and request any required parts from Dell.
Operational highlights include:
- Reduction in time to resolution of faults
- Quicker and easier implementation of firmware updates
- Set BIOS settings configuration across an entire cluster in one easy automated job
Beyond the Dell OpenManage tools, Cambridge uses the iDRAC server telemetry feature to stream power and thermal data to Graphite and Grafana. These Dell metrics, along with values from other data center infrastructure, are aggregated and visualized for analysis of trends, ensuring the clusters are powered and cooled effectively.
Join the ranks of satisfied customers who have optimized their server management operations and enjoy the peace of mind brought about by Dell OpenManage.
Resources
- Podcast: How Would You Go About Orchestrating a Fleet of More Than 18,000 Servers?
- Dell System Management Info Hub
- OpenManage Enterprise Support
Authors:
Mark Maclean, PowerEdge & OpenManage Technical Marketing Engineering
Steve Daborn, Senior Global Product Marketing Manager
Linkedin : uk.linkedin.com/in/markmacleandell | linkedin.com/in/stephendaborn

Evolution of Intelligence System Management Dell OME 4.0 Release
Tue, 31 Oct 2023 15:30:28 -0000
|Read Time: 0 minutes
Why were the films Star Wars episodes 4, 5, and 6 released before episodes 1, 2, and 3? In charge of the schedule, Yoda was!
At Dell, we like to keep things simple, so we released version 4.0 of OpenManage Enterprise following on from release 3.10. For customers new to OpenManage Enterprise, often referred to as OME, it is Dell’s management console solution, offering comprehensive lifecycle management for Dell PowerEdge servers and so much more.
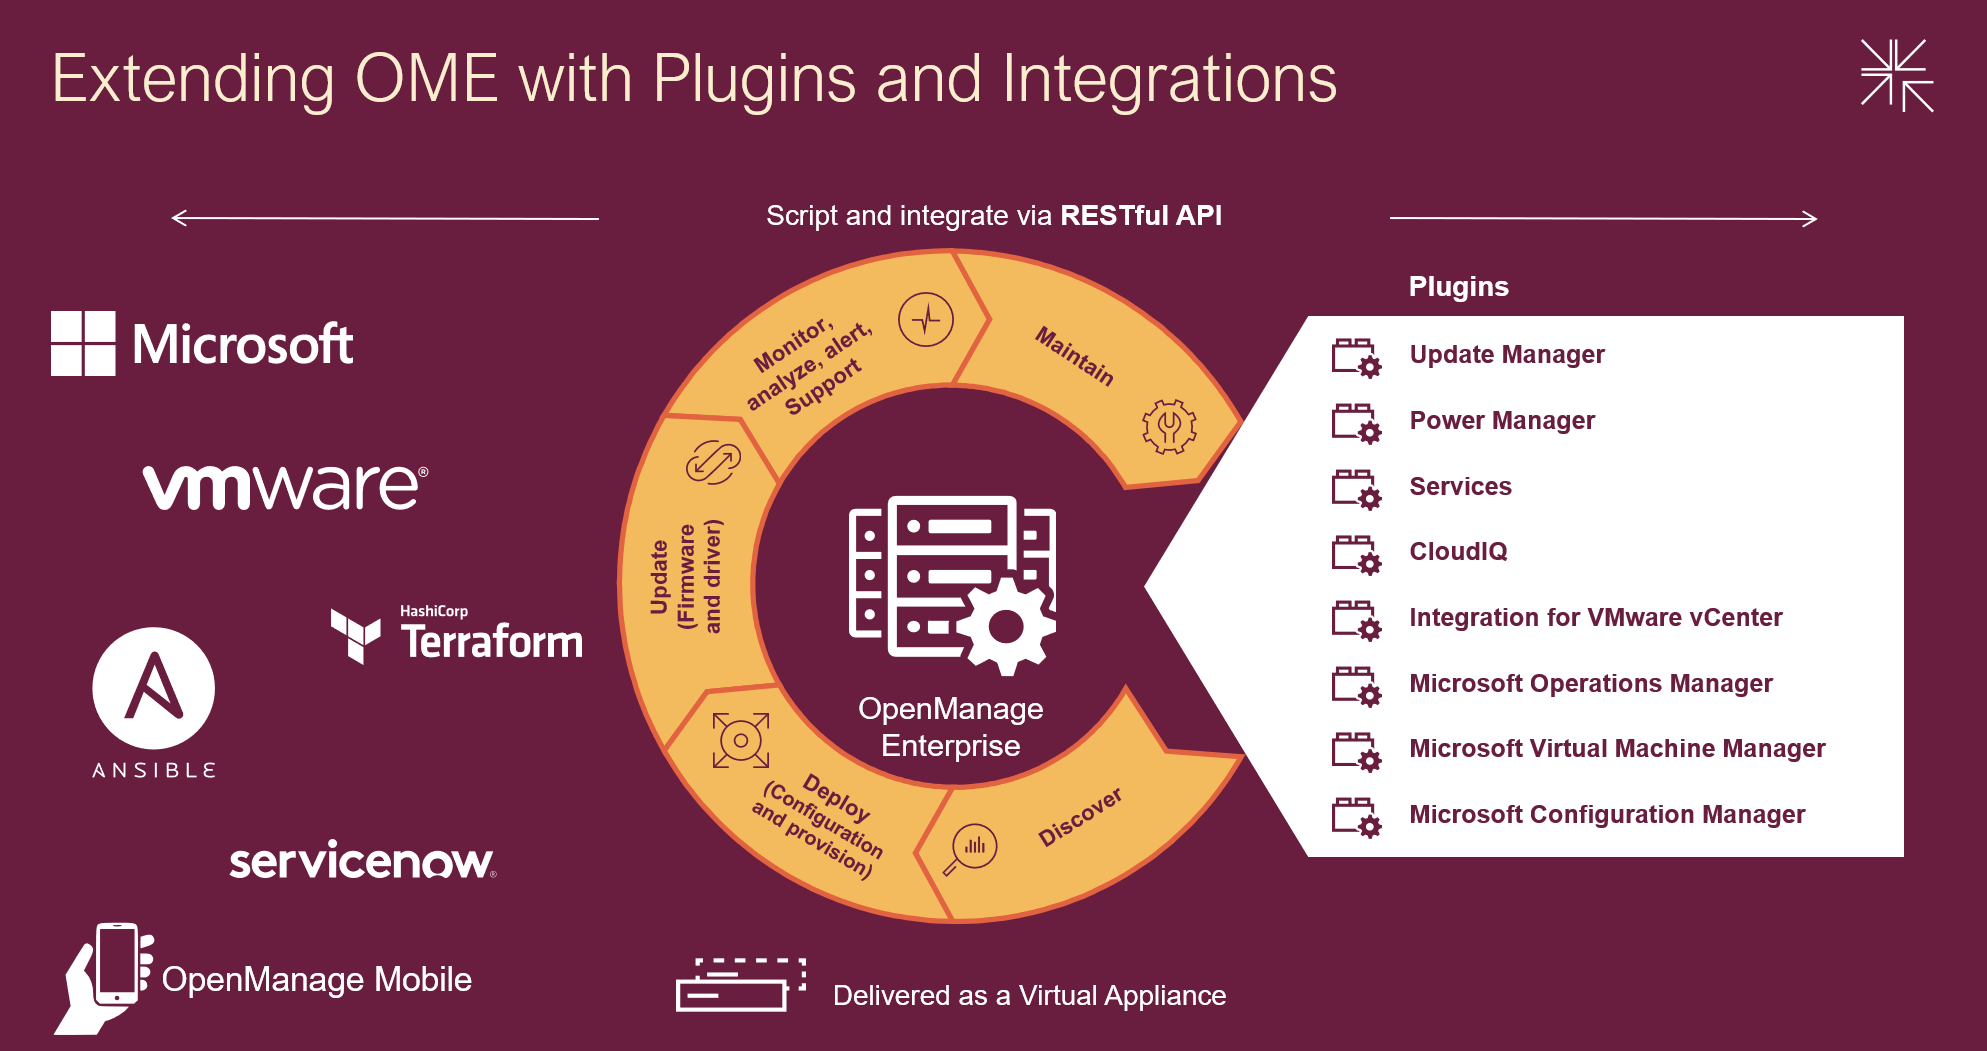
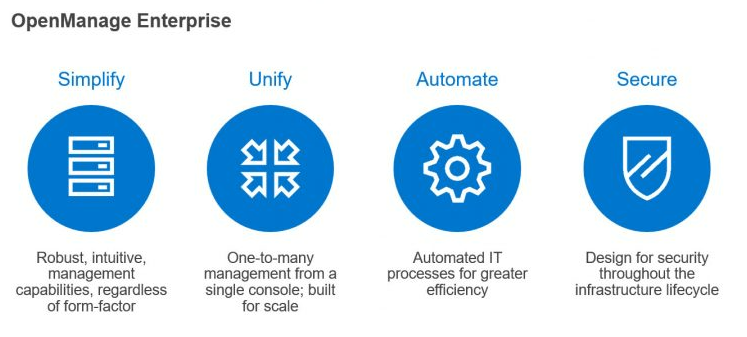
Designed to simplify, OpenManage Enterprise offers you the ability to orchestrate and automate repetitive server management tasks at scale. Customers have a choice of:
- Using the OME GUI
- Integrating the data from OME into VMware virtual center or Microsoft System Center via plugins
- Leveraging the rich restful API that offers 100% the features of the GUI offering Infrastructure as code for DevOps teams
Capabilities can be extended with additional plugins, ranging from automated Dell support case creation via the Services plugin to detailed and granular firmware updating via the Update Manager plugin. With Ansible modules, Terraform support, and Service Now integration, OME supports multiple ways to extend orchestration.
Combining OpenManage Enterprise with Dell CloudIQ utilizes the power of AIOps to detect server metrics anomalies. Trends can be analyzed and forecasted for capacity, power, and processing. Server security can be proactively improved using intuitive security policies and automated relevant CVE alerting. Adding server telemetry to data from other Dell infrastructure collected by CloudIQ gives you end to end management with predictive analytics to reduce risk by addressing problems before they have an impact.
Server power usage can be optimized to support sustainability by using the Power Manager plugin to maximize visibility and management of servers’ power consumption. You can review consumption and set power strategies using telemetry visualization and reports on power utilization, power costs, CO2 emissions, thermal data, GPU data, and performance metrics. Power Manager also supports analysis of power data by virtual machines, components, individual servers, racks, or even entire data centers. The plugin can automatically respond to power and thermal events to limit issues. With built-in idle server detection and reporting, hunting down underutilized zombie servers becomes easy.
OpenManage Enterprise strengthens servers’ cybersecurity defenses, covering elements from highlighting and deploying the latest firmware updates to configuration drift detection. With support for LDAP, Microsoft AD, iDRAC password rotation, Multi-Factor Authentication (MFA) with RSA SecurID, and CyberArk credential provider, management is a breeze.
OpenManage Mobile, a mobile app that provides monitoring capabilities from an Android or Apple phones, extends OpenManage Enterprise into your pockets. The app enables you to receive push alerts from OpenManage Enterprise, view server configuration details, and even view and control server consoles on mobile devices. Say hello to managing your servers from almost anywhere!
Following are the highlights of new features for OME 4.0 and associated plugins updates. For more details, visit the OME and plugin support pages in the Resources section.
OME 4.0
- OME can now access iDRAC passwords via CyberArk vault
- OME can now create encrypted credentials to access iDRAC and rotate them automatically
- Local Multi-Factor Authentication (MFA) with RSA SecurID
- Support new server platforms (see OME Support Matrix for details)
- New generation PowerEdge servers
- New XR/XE/XC/VxRail platforms
- TLS 1.3 support
- Secure Boot (appliance allows only OS distribution provided signed binaries to run at startup)
PowerManager plugin 3.2 (for OME 4.0)
- GPU power and thermal data
- Visualization of multivariate data to observe patterns and trends in server telemetry data
- AMPs readings from Grid A and B (when more than one power supply is deployed)
- BIOS system profile and workload profile reporting
OpenManage Enterprise integration For VMware vCenter or OMEVV (for OME 4.0)
- Support for the vSphere 8.0 U2
- Support for non-clustered hosts baseline profiles, firmware compliance, and application of firmware updates
- Apply System Profile to baremetal hosts (System Profile = Deployment Template of OME)
- vLCM support for standalone hosts
- OMMP 3.0 new management park for VMware Aria Operations for OMEVV plugin
Update Manager plugin 1.5 (for OME 4.0)
- Set the Baseline to any Repository Version
- Automate Repository Refresh on server or component update, such as add/remove
- Compare and report different repositories
OME Integration for Microsoft Systems Center Plugin (OMEMSSC) 1.2
- SCOM Web Console Support
- SCOM Alert Auto Resolution
- SCOM Resource Pool Management
CloudIQ Plugin (CIQP) 2.0
OME Services Plugin (OME-S) 4.0
Are you getting the maximum benefits from Dell OpenManage? As I always say, where there are servers, there's a server management need!
Resources
- OpenManage Enterprise white papers and videos: Support page
- OpenManage Documentation: User Guide, API Guide and support matrix etc
- OpenManage Enterprise API: Dell Technologies Developer
- OpenManage Ansible Modules and example API scripts: GitHub OpenManage Ansible
- Dell System Management Info Hub: Tech notes, videos, infographics
Author: Mark Maclean, OpenManage Technical Marketing Engineering
Linkedin : uk.linkedin.com/in/markmacleandell

Migrating OMIVV to OMEVV Made Simple
Tue, 01 Aug 2023 14:05:13 -0000
|Read Time: 0 minutes
Why did the virtual machine go on a diet? Because it had too many bytes and needed to lose some weight. Recently the Dell OpenManage portfolio also went on a slight diet, consolidating OpenManage Integration for VMware vCenter (OMIVV) into a new plug-in for OpenManage Enterprise. The new solution, OpenManage Enterprise Integration for VMware vCenter (OMEVV), offers additional features such as support for 16G servers, compatibility with vCenter 8 and vSphere ESXi 8, and integration into the wider OpenManage Enterprise ecosystem.
To streamline customer migrations from OMIVV to OMEVV, the latest OMIVV release, version 5.4.1, includes a migration tool. Dell Technologies has published a white paper detailing the migration steps: Migrating from OMIVV to OMEVV. The white paper discusses both the migration tool and also relevant OMEVV REST APIs for future automation.
The OMIVV to OMEVV Migration Tool supports:
- VMware ESXi hosts that are inventoried and managed in OMIVV
- Updates to event and alarm settings
- Changes to severity of Dell health update notifications for VMware Proactive High Availability (PHA) event rules
Just ensure that the Dell servers to be migrated are compliant with the compatibility matrix. For example, only PowerEdge 13th Generation servers or higher are supported. Also, an OpenManage Enterprise Advanced+ license is required on each of the servers that will be migrated to OMEVV.
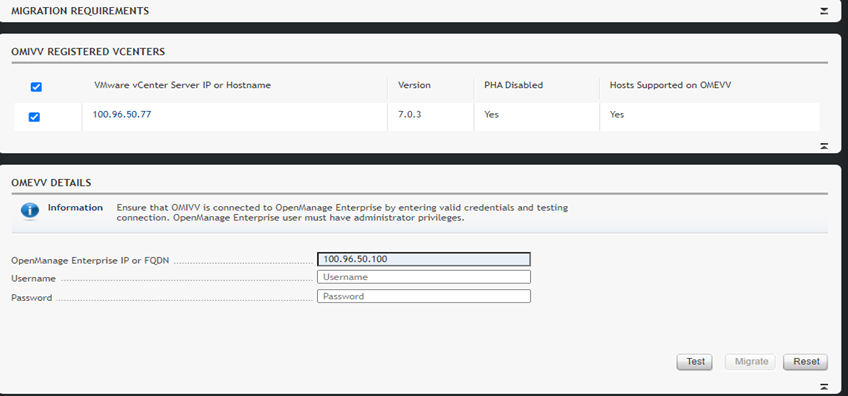
The migration tool is launched through https://<OMIVV-instance-IP>/MigrationTool/login. Once logged in, administrators are reminded of the migration prerequisites, such as OpenManage Enterprise must be deployed and the OMEVV plug-in must be accessible from OMIVV through the network. Once the connection from OMIVV is authenticated, single or multiple vCenter instances can be selected for migration.
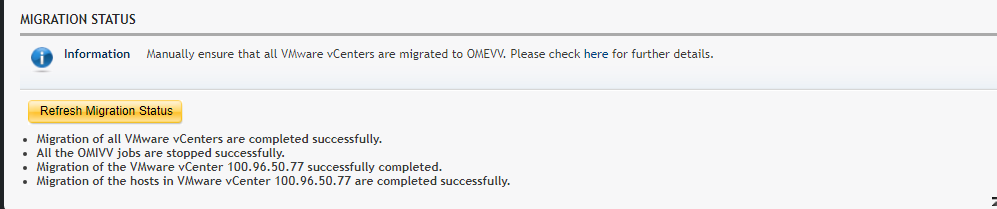
Details of the migration status can be displayed as the task runs, and, once complete, a summary of the migration tasks is displayed. The selected vCenter instances are automatically unregistered from OMIVV and registered in OMEVV alongside all the hosts transferring to the OpenManage Enterprise plug-in. Details of the migration jobs are also recorded in the OpenManage Enterprise event log.
The transition from an OMIVV stand-alone appliance to the OMEVV plug-in enables customers to reduce the complexity of data center management by streamlining the tools associated with managing and monitoring Dell servers in the vSphere environment. At the same time, the OMEVV plug-in gives customers access to the wider OpenManage Enterprise ecosystem. This includes Power Manager, phone support through the Dell services plug-in, and integration with CloudIQ, Dell's cloud-based AIOps monitoring and management solution for Dell's data center infrastructure portfolio.
The inclusion of the migration tool in OMIVV 5.4.1 helps customers of all sizes migrate to the newer OMEVV server management architecture with the latest features and benefits of automation, security, and efficiency.
Resources
- Migrating from OMIVV to OMEVV white paper
- OpenManage Enterprise Integration for VMware Virtual Center Overview
- OpenManage Enterprise Integration for VMware vCenter 1.2 Support Matrix
- OpenManage Enterprise Advanced + 90 day trial license keys
- OpenManage quick insight OMEVV short overview video
Author:
Mark Maclean, PowerEdge Technical Marketing Engineering
Linkedin : uk.linkedin.com/in/markmacleandell

Unveiling the Power of OpenManage Enterprise Backup and Restore
Fri, 16 Jun 2023 15:18:13 -0000
|Read Time: 0 minutes
What does Roger Federer call his backup racket? The Federer Reserve, but as all server administrators know, having a backup is no joke!
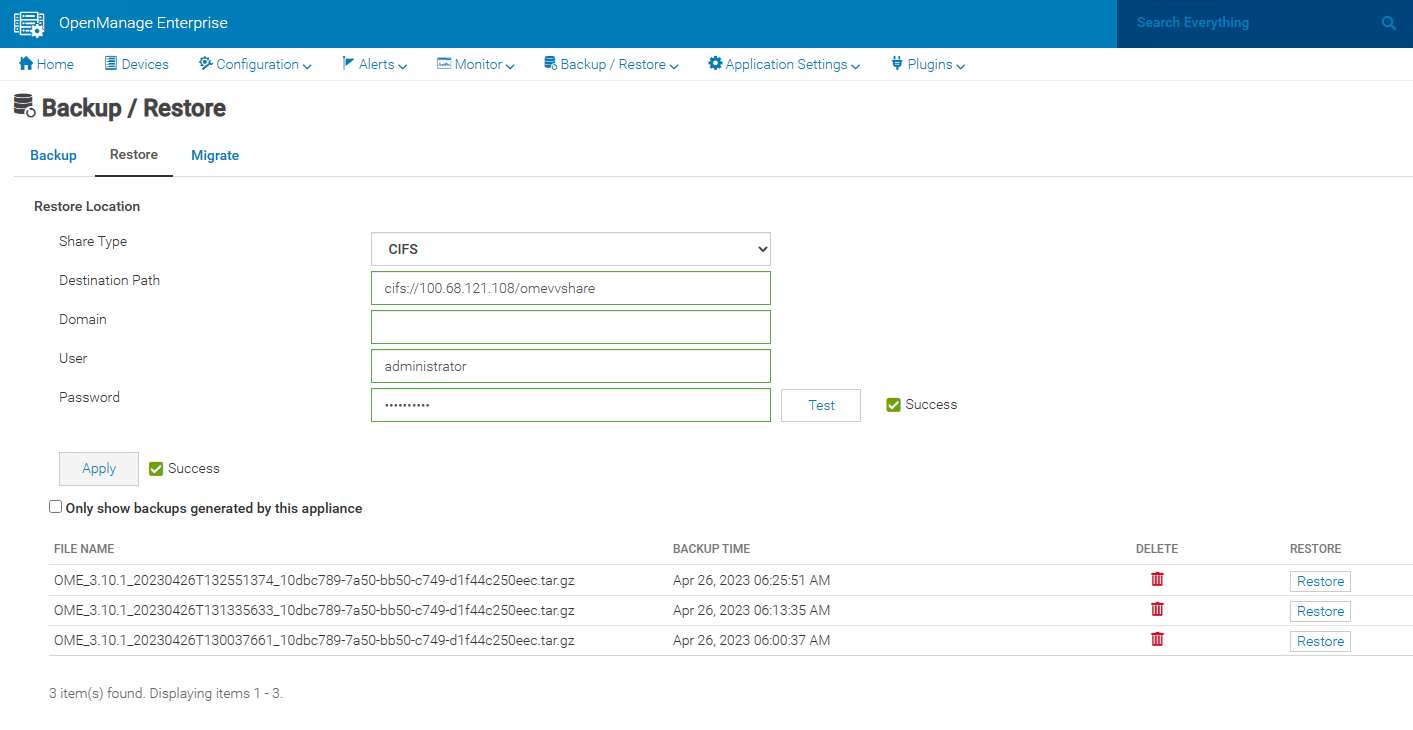
Given that OpenManage Enterprise delivers key deployment, monitoring, updating, and reporting, ensuring the availability of this management solution is a key requirement. Earlier this year Dell Technologies released a backup and restore feature for OpenManage Enterprise and plugins. This feature is a more convenient way of backing up OME, because it enables an administrator to do so without the need for hypervisor snapshots. One can now back up the entire appliance configuration and data, including managed device information, custom groups, and discovery jobs such as the discovery task, alert policies, installed plugin data, and logs.
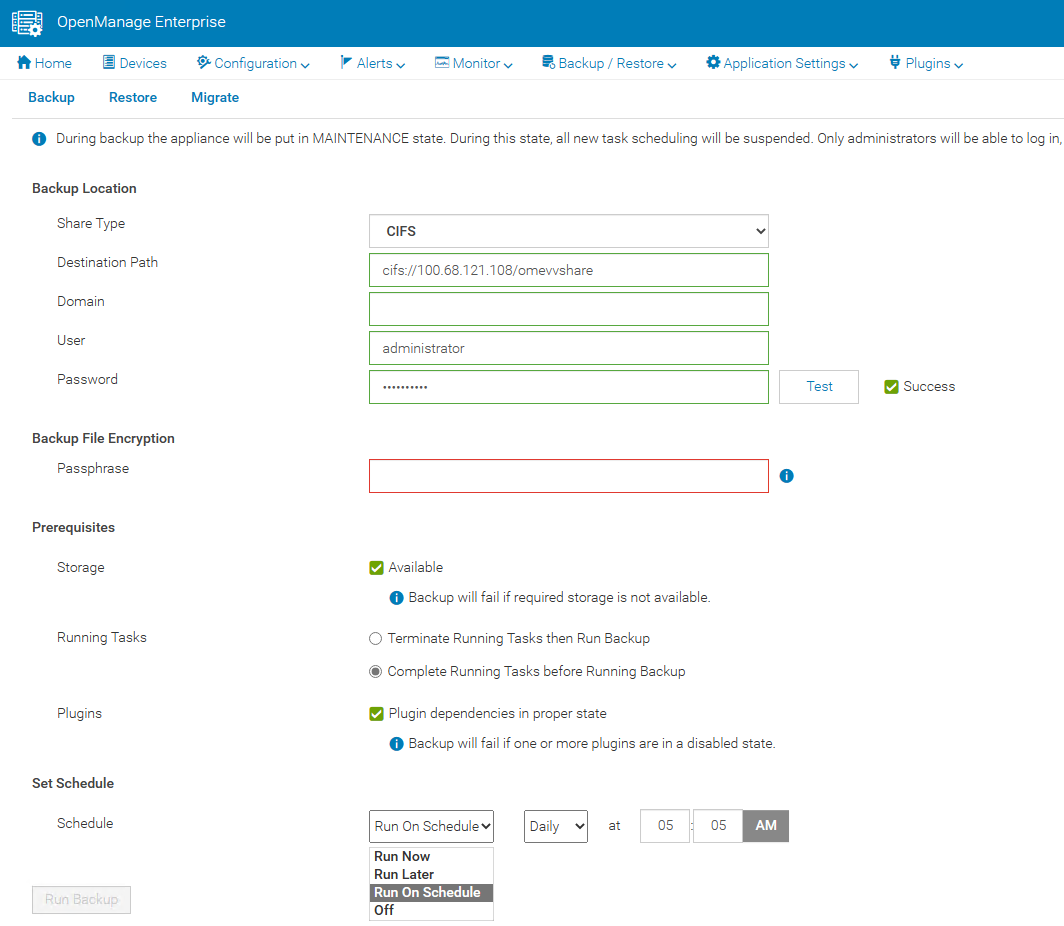
A backup task can be scheduled to run daily, weekly, or immediately. Backup administrator rights are required to execute these tasks. When backing up, administrators are required to provide a security passphrase. This is used as a security measure because during a restore, administrators are challenged for the passphrase, and data is restored only when there is a match.
The backup task supports HTTPS, CIFS, or NFS network shares as a target destination and the backup is encrypted to ensure the security of the appliance configuration data. (Note that the appliance is in a maintenance state during the backup, all new task scheduling is suspended, and no operations can be performed on the console during this time.)
In the unfortunate event of a deletion, corruption, or system failure, the restore capabilities of OpenManage Enterprise are easy. If required, data can be restored to the existing or a new instance of OpenManage Enterprise running the same version, using the same or larger sized virtual appliance.
This backup & restore capability for appliance data is a major feature to enhance the resilience of the OpenManage Enterprise management solution.
Resources
Learn more at: Support for Dell OpenManage Enterprise
Author: Mark Maclean, PowerEdge Technical Marketing Engineering
Contributors: Manoj Malhotra, Product Manager; Pushkala Iyer, Product Planner

Sweet 16 ways OpenManage helps customers to maximize their investment in PowerEdge
Wed, 12 Apr 2023 01:27:49 -0000
|Read Time: 0 minutes
As we at Dell announce details of the new wave of PowerEdge servers (details here), we want to highlight 16 examples of how the OpenManage portfolio of systems management software enhances our server range. Like I always say, where there are servers, there are server management requirements.
The OpenManage portfolio exists to save customers of any size time and money, eliminating the necessity of high-touch, manual steps to deliver efficiency. Designed to scale, with integrated security, Dell’s OpenManage strategy is to give customers a choice by using orchestration, automation, and integration, leveraging APIs with open standards.
#1 – Server health monitoring—This is server management 101. However, given the fact that PowerEdge servers are the foundation of the modern data center, this basic element is critical to application and services uptime. OpenManage solutions have many ways to get this information from the agent-free iDRAC directly (GUI/SNMP/SMTP/syslog/API and more) or through the Dell OpenManage Enterprise console, OpenManage mobile, Dell CloudIQ, VMware vCenter integration, Microsoft System Center, and leading third-party management software such as Nagios.
#2 – Remote access to servers—If deep one-to-one control for troubleshooting, deployment, configuration, console access, and so on is needed, then iDRAC is the answer. Dell's unique iDRAC9 offers out-of-band remote server connection, including firmware configuration, full server console remote control through eHTML5 (sometimes called vKMV) GUI, virtual media, and server telemetry. iDRAC agentless architecture offers server monitoring and control from anywhere without the need to install any software. There are many additional features, from basic power on/off control offered through the GUI, CLI, or API to advanced server profile configuration to ensure that servers have the correct firmware configuration settings.
#3 – Server deployment—The time between when a server is racked and powered until it is live (time to value) can be greatly reduced by leveraging the automation integrated into OpenManage. Starting with streamlining one-to-one deployments, the iDRAC features a lifecycle controller that rapidly configures elements such as RAID storage configurations and populate deployments with up-to-date operating system drivers. In addition, iDRAC also features a zero-touch deployment to automatically download a server configuration profile (SCP) and even complete an unattended operating system installation the first time the server powers up on a customer’s network. Beyond one-to-one solutions, OpenManage offers a broad number of deployment solutions, including: OpenManage Enterprise, offering firmware setting configuration and supporting agnostic operating system installation through ISO images; Microsoft System Center integration; and deeper customizable VMware installations through OpenManage Enterprise for VMware vCenter. Finally, for customers using tools such as Ansible, Terraform, or Prometheus, OpenManage supplies integration packs and sample code leveraging Dell's APIs.
#4 – Manage and update firmware—There are multiple methods to update PowerEdge server firmware, depending on needs. Methods range from one-to-one, using iDRAC/Lifecycle Controller, to console-based methods for updating multiple servers. Leveraging large-scale automation, these tools can audit existing servers, compare online catalogs, then download and apply the correct updates quickly and consistently with massive time savings compared to manual methods. One example is the integration into VMware using OpenManage Enterprise for VMware vCenter, which offers cluster-aware updates, updating one cluster node at a time using DSR to keep workloads up and running. Dell supplies Repository Manager to build custom firmware catalogs like the packaged interpretable ISOs that are used by other Dell updating tools where servers are isolated or air gapped. And, of course, Dell supplies an Ansible module offering firmware updates to the DevOps user base.
#5 – Configuration drift detection—OpenManage Enterprise provides compliance features that detect, highlight, and remediate configuration drift issues, with simple processes for both firmware versions and firmware configuration settings.
#6 – Secure supply chain assurance—Using Dell’s Secure Component Verification (SCV) allows organizations to ensure that their new servers are delivered with the same components installed at Dell Technologies’ manufacturing facility, using a digital, cryptographically secured signed inventory certificate.
#7 – Power usage reporting (and carbon emissions calculations)—There are multiple ways to view server power consumption data, depending on needs and preferences. One way is to open the iDRAC web GUI, while another way is to use scripts, either Racadm or Redfish, to retrieve the data. iDRAC can also send data to the OpenManage Enterprise Power Manager plug-in, where power data, including carbon emissions, is processed and grouped, and can be displayed, reported, and actioned. OpenManage Enterprise can also forward this information to CloudIQ for PowerEdge for additional analysis and visualization. For those customers looking for maximum data, iDRAC9 can stream these power statistics as telemetry data to analytics solutions such as Splunk or ELK Stack for real-time in-depth analysis.
#8 – Power usage control—Power consumption capping ability is integrated into iDRAC. OpenManage Enterprise Power Manager adds the capability to apply power caps to individual servers or groups of servers. This power capping can be permanent, scheduled at particular times for specific weekends, or ad hoc in response to an incident when reduction in power consumption is required, such as when running on UPS or on-premises generators.
#9 – Thermal event management—While thermal monitoring alerting and even shutdown is integrated into PowerEdge servers through the iDRAC, OpenManage Enterprise Power Manager augments this through powerful Emergency Power Reduction (EPR) policies. This feature reduces the power consumption of servers through a power cap policy to throttle a group of servers. EPR policies can be used as a permanent or scheduled method to limit server power consumption or as an immediate temporary measure during a thermal emergency, for example, CRAC unit failure.
#10 – Performance monitoring—From the iDRAC GUI, CLI, and API, server performance telemetry data can be obtained. OpenManage Enterprise Power Manager can consume and report this data, automatically highlighting idle servers. Telemetry information can be passed to third-party solutions such as Splunk. Finally, CloudIQ can analyze information and present the information in a dashboard format with graphical visualization, and, for key metrics, highlight anomalies based on historic seasonality data.
#11 – Enterprise secure key management—iDRAC provides a standards-based Key Management Interoperability Protocol (KMIP) to encrypt data at rest on self-encrypting SSDs or self-encrypting hard drives and pass the key to a key management system. Solutions such as Thales CipherTrust Manager offer centralized key management for multiple PowerEdge servers and many other products.
#12 – Detailed server telemetry—iDRAC9 provides more than 180 data metrics that can integrate advanced server hardware operation telemetry. Many of these can be reported and visualized in CloudIQ or streamed to analytics solutions such as Splunk. This server telemetry data allows customers to access detailed information to avoid failure events, optimize server operation, and enhance cyber resiliency.
#13 – Automatic call and ticket creation—This ranges from the Dell services plug-in for OpenManage Enterprise, which offers the creation of a support case directly with Dell without any human intervention, to integration with ServiceNow by Dell’s integration pack. Alternatively, OpenManage Enterprise offers a flexible set of actions, including running scripts, SNMP forwarding Syslog event, and emailing based on the monitoring of SNMP events. This automation can be used to pass information to a third-party solution for incident management.
#14 – Capacity planning—The iDRAC provides a large amount of performance statistics. This data can be collected and analyzed by the Dell CloudIQ IOPS solution to produce a forward-looking capacity analysis on items such as CPU usage based on real historical data values for a given server and workload.
#15 – Cloud-based infrastructure management—Dell's AIOp’s CloudIQ can not only consolidate multiple instances of OpenManage Enterprise, but it can also integrate Dell storage, server, data protection, networking, HCI, and CI products. Hosted in Dell’s secure data center, CloudIQ combines proactive monitoring, machine learning, and predictive analytics to reduce risk, plan ahead, and improve productivity from core to edge.
#16 – Cybersecurity from concept to retirement—Dell Cyber Resilient Architecture 2.0 includes features such as iDRAC silicon-based root of trust, dynamic USB port management, UEFI Secure Boot, and signed firmware updates. All these features are controlled by OpenManage tools that let customers protect, detect, and recover in response to security threats.
We hope that this list has given you a few suggestions on how the OpenManage portfolio can help your organization. Servers are a vital element of organizations’ infrastructure and the foundation of modern business, and it’s critical to manage and monitor them to deliver visibility, productivity, and control. Server management tools not only make tasks easy, faster, and consistent but also decrease failures with increased efficiency. Remember, don't just manage, automate.
Is your organization using all the features that Dell OpenManage offers and getting the maximum benefits from investing in PowerEdge servers? Ask your account manager for more details.
References
#2 Support for Integrated Dell Remote Access Controller 9 (iDRAC9)
#3 How to create and deploy a Server Template in OpenManage Enterprise (video)
#4 Updating Firmware and Drivers on Dell PowerEdge Servers
#5 Improve Operational Efficiency Through OME Server Drift Management
#6 Dell Technologies Secured Component Verification for PowerEdge
#7 #8, #9 Server Power Consumption Reporting and Management
#10 CloudIQ Provides Data Driven Server Management Decisions
#11 OpenManage Secure Enterprise Key Manager Solutions Brief
#12 Transform Datacenter Analytics with iDRAC9 Telemetry Streaming
#13 Support for OpenManage Integration with ServiceNow
#14 Talking CloudIQ: Capacity Monitoring and Planning
#15 CloudIQ: AIOps for Intelligent IT Infrastructure Insights
#16 Cyber Resilient Security in Dell PowerEdge Servers
Additional resources
- Dell server management portfolio: OpenManage microsite
- API catalog (interactive support resource): Dell Technologies Developer
- Ansible Python PowerShell module library and code examples: Dell Technologies GitHub
- Dell systems management offerings: Dell Systems Management Overview Guide

Dell iDRAC Data Visualization with Elastic Search and Grafana

Wed, 25 Jan 2023 17:06:05 -0000
|Read Time: 0 minutes
Introduction
This blog is the first in a series in which I write about Dell iDRAC Data Visualization with Elastic Search and Grafana. In this blog, I explain iDRAC telemetry data visualization, which represents a potential advantage for any business product, and for monitoring.
Grafana is a versatile, open-source data visualization tool which can read data from different data sources and plot the visualization, depending on the use case. This plot can be combined to create a unique dashboard that you can integrate into any of your custom applications, to visualize or use it as it is.
Elastic Search is an open-source, distributed data store for full-text search engine. It uses a JSON-based document structure to index the data obtained and store it. It uses the Inverted Index structure, which helps in fast keyword searches in stored data.
The topics covered in this blog include:
- Using Helm chart, Deploy Elastic Search and Grafana on Kubernetes (K8s) cluster.
- Creating a basic iDRAC visualization dashboard.
- Configuring the Alert Manager in Grafana, and then enabling it in the visualization dashboard.
Deployment Activity
Prerequisites
- A fully configured Linux environment
- K8s installed in your Linux environment
- An iDRAC system with data telemetry services enabled
Once all the prerequisites are ready, you can begin deploying the major open-source applications (Elastic Search and Grafana). This deployment should be performed on a K8s cluster.
Elastic Search
To install Elastic Search:
- Using Helm, add the elastic repository:
helm repo add elastic https://helm.elastic.co - Install Elastic Search:
helm install elastic-release elastic/elasticsearch -n {namespace_name}
Note: replace namespace_name with your defined namespace.
3: Test the Elastic Search instance:
kubectl port-forward svc/elasticsearch-master 9200 -n {namespace_name}
curl localhost:9200
Grafana
To install Grafana:
- Using Helm, add the bitnami repository:
helm repo add bitnami https://charts.bitnami.com/bitnami - Install Grafana:
helm install my-release bitnami/grafana -n {namespace_name}
Note: replace namespace_name with your defined namespace.
Fetching Data from iDRAC
The data telemetry should be fetched and sent to Elastic Search based on the configured time. In the next section, you can see how to fetch the data from iDRAC to Elastic Search.
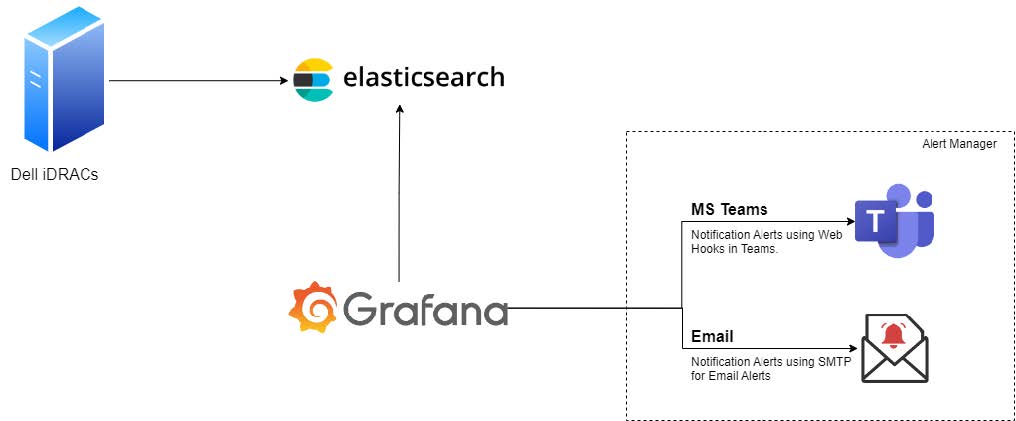
Figure 1: Connectivity diagram
Enabling the Alert Manager
MS-Teams notifications
- Create a Teams Channel where notifications will be sent.
- Click the ellipsis (…) in the top-right pane, and then select Channel notifications -> Connectors.
- Select and configure the Incoming Webhook by providing the required information.
- Once the configuration is complete, copy the URL and save the channel configuration.
Note: The copied URL must be provided in the Alerts section of Grafana.
- In Grafana, select Menu-> Alerts.
- Go to Contact Points.
- Create a contact point by providing the required information.
- Save the contact point.
- Run a test notification to verify that alerts are reaching to the newly created Teams Channel.
Configure email notifications
The Email notifications are sent using SMTP service. You must configure notifications using a YAML file or using Environment Variables.
Method 1: Using a YAML file
- Add and enable the following configuration your YAML file before deploying the Grafana instance on your K8s cluster:
smtp:
enabled: false
user: user
password: password
host: ""
fromAddress: ""
fromName: ""
skipVerify: "false"
existingSecret: ""
existingSecretUserKey: user
existingSecretPasswordKey: password - Run the kubectl command to install the Grafana instance.
Method 2: Using an environment variable
- Edit the deployment of the Grafana instance:
kubectl edit deployment {deployment_name} - Add the following configuration details to the file:
- env:
— name: GF_SMTP_ENABLED
value: “true”
— name: GF_SMTP_HOST
value: {SMPT_IP}:{PORT}
— name: GF_SMTP_PASSWORD
value: xxxxxxxxxxxx
— name: GF_SMTP_USER
value: apikey
— name: GF_SMTP_FROM_ADDRESS
value: test@test.com
— name: GF_SMTP_FROM_NAME
value: System Admin - Save the file. Kubernetes will automatically roll out the new configuration.
- Test the new configuration:
- In Grafana, go to Alerts Notifications.
- Select the notification channel.
- If no email channel is present, add a channel with an email address.
- Enter the notification recipient email address.
- Run the test configuration to verify that the recipient email gets a test notification.
Approach
Once the above deployment is completed, login with the default username and password configured in Grafana, to check whether Grafana is up and running. The steps below enable you to view the Grafana dashboard.
Add a data source
You can add a data source in two different ways: by using the values.yml file, or by using the Grafana UI.
Method 1: Using the values.yml file
Create and add the configuration below in the datasource.yml file:
datasources:
secretName: ""
secretDefinition:
apiVersion: 1
datasources:
- name: { datasource_name}
type: { datasource_type }
url: { datasource_url }
access: { access_type }
isDefault: { true/false }
Example:
datasources:
## @param datasources.secretName The name of an externally-managed secret containing custom datasource files.
##
secretName: ""
## @param datasources.secretDefinition The contents of a secret defining a custom datasource file. Only used if datasources.secretName is empty or not defined.
## Example:
## secretDefinition:
## apiVersion: 1
## datasources:
## - name: Prometheus
## type: prometheus
## url: http://prometheus-prometheus-server
## access: proxy
## isDefault: true
Method 2: Using the Grafana UI
- From the Grafana UI navigation section, select the Settings icon. It resembles a cog wheel.
- Select the Data Source option.
- Add the new data source.
- Search for the Elastic Search data source.
- Select the data source from the search results. The configuration window displays.
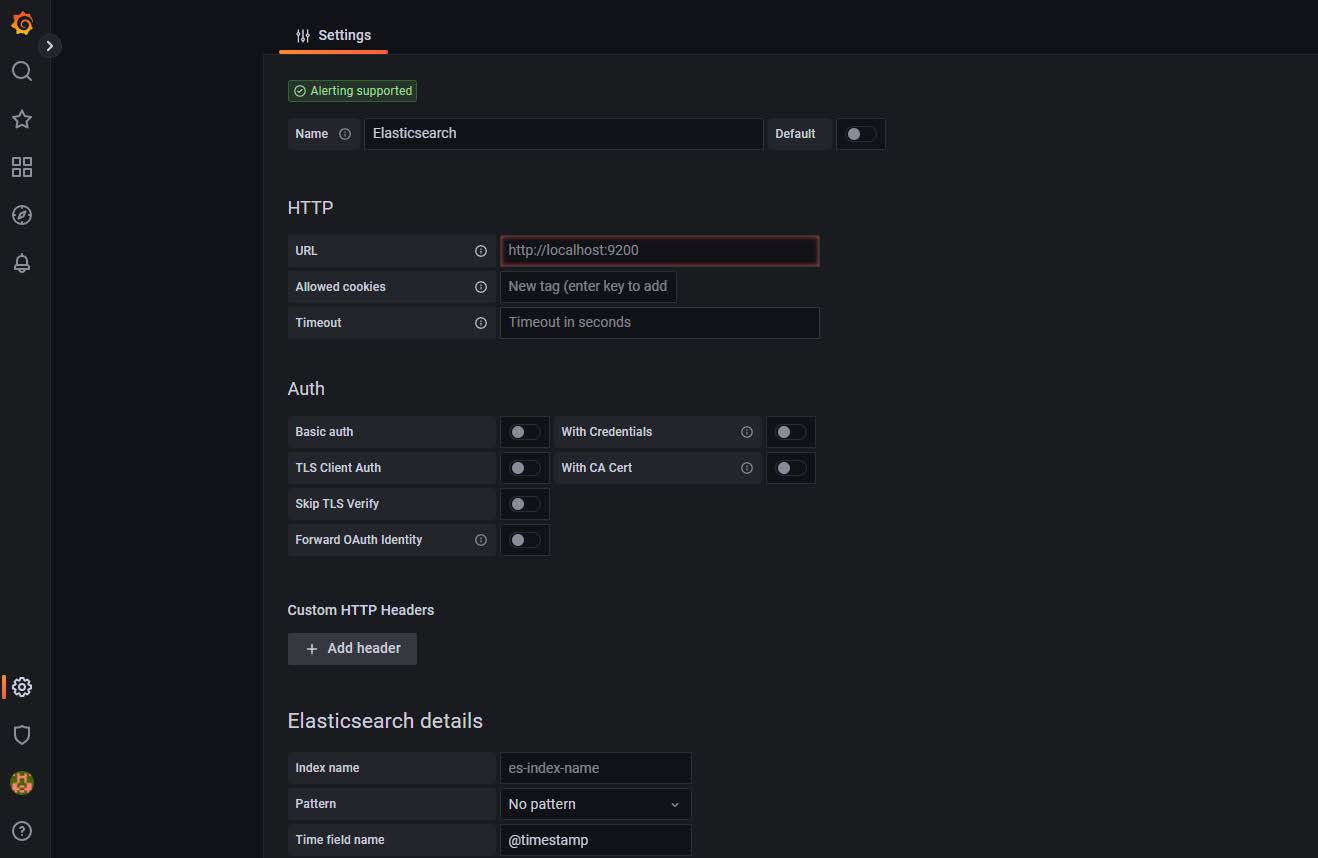
Figure 2: Configuration window
- Add the URL, authentication details, and so on.
- Save and then test the configuration.
A successful test confirms that data source is added successfully.
Create the dashboard
- In the Grafana UI, select the Dashboards icon in the left pane.
- Expand the New drop-down in the right pane.
- Select New Dashboard.
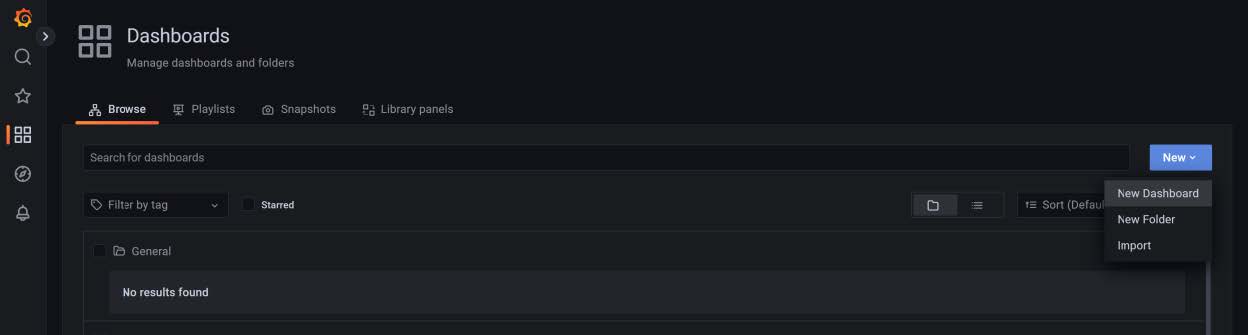
Figure 3: Creating a dashboard
Create the dashboard panels
- Select the Panels and rows according to the use-case and map the data source that you created in Add a data source.
- Once the data source is mapped, create a query to fetch the details from the data source to visualize the data.
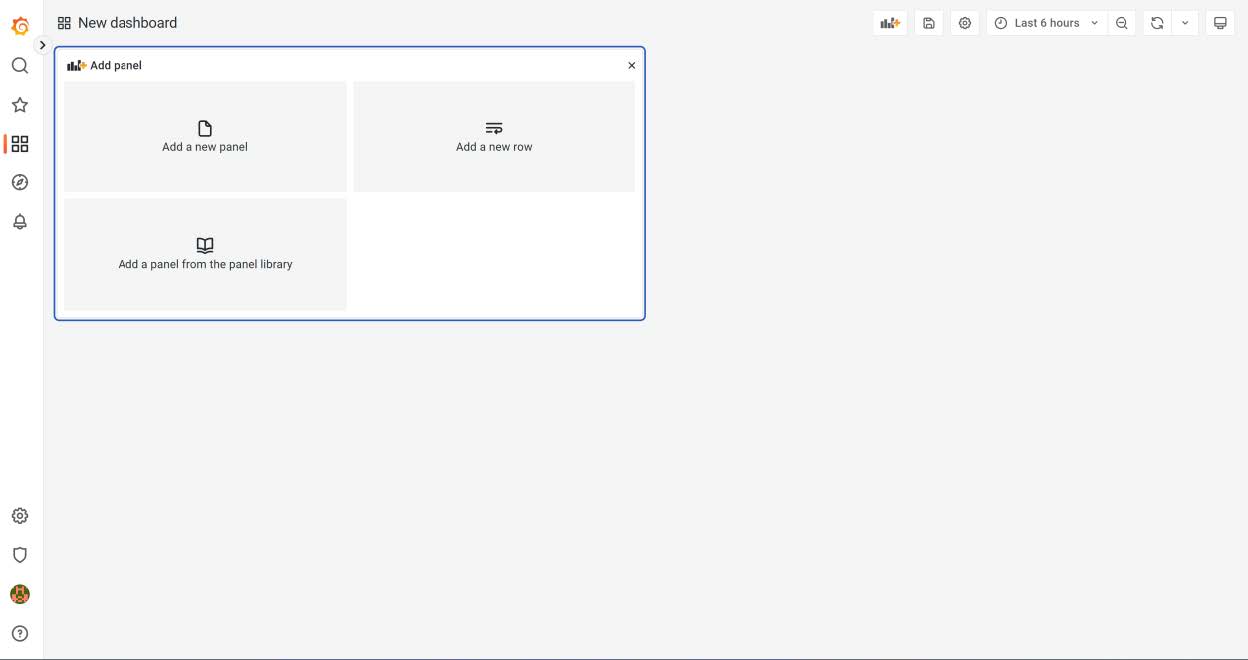
Figure 4: New dashboard panels
Configure the alerts notifications threshold
In the right panel you will find the threshold section, where you can configure the alert threshold. See the figure below.
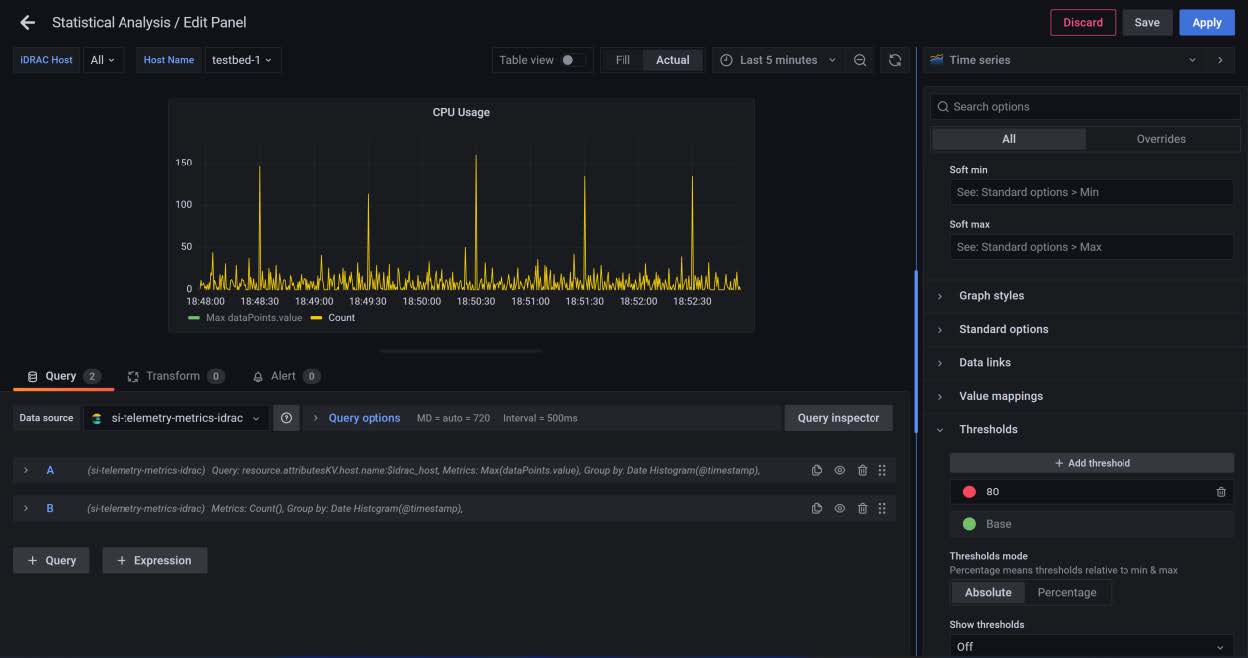
Figure 5: Threshold configuration
Results
The results are displayed as in the figure below.
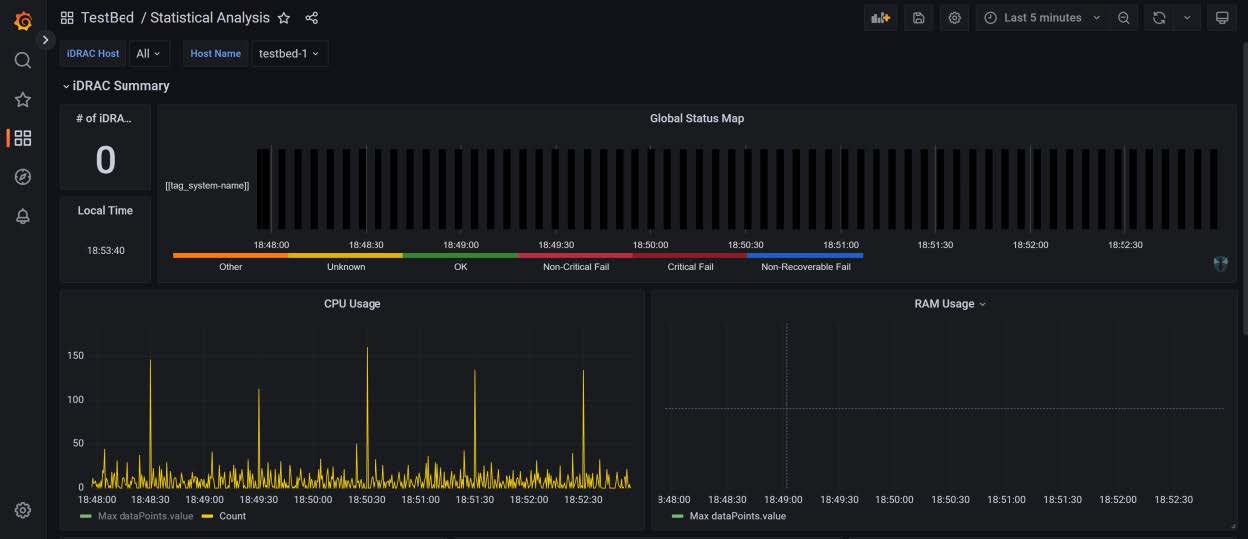
Figure 6: Simple dashboard with configured alerts
Conclusion
This blog helps enterprise data visualization teams to implement Grafana in K8s, and to configure the data source and alert notifications.

OpenManage Enterprise Adds the Troubleshoot Option
Fri, 02 Dec 2022 16:26:32 -0000
|Read Time: 0 minutes
What happens when you can’t get the restaurant staff’s attention? You have an error in connecting to the servers! That can also happen when discovering new servers in OpenManage Enterprise.
Fortunately, OpenManage Enterprise 3.9 has added a built-in troubleshooting toolkit to help diagnose problems during device discovery. This feature tests connectivity from the management appliance across the network to the managed devices.
When onboarding a fleet of devices, such a group of iDRACs into OpenManage Enterprise, when a discovery job completes, if any devices are missing, how can administrators identify the problem? For example, how can they quickly check whether the SNMP is enabled and configured correctly on a remote iDRAC? How can they make sure they're using the right credentials for an iDRAC, or how do they know if OpenManage Enterprise can communicate with the target devices on the network? These difficulties and many other errors can now be resolved using the OpenManage Enterprise embedded troubleshooting option.
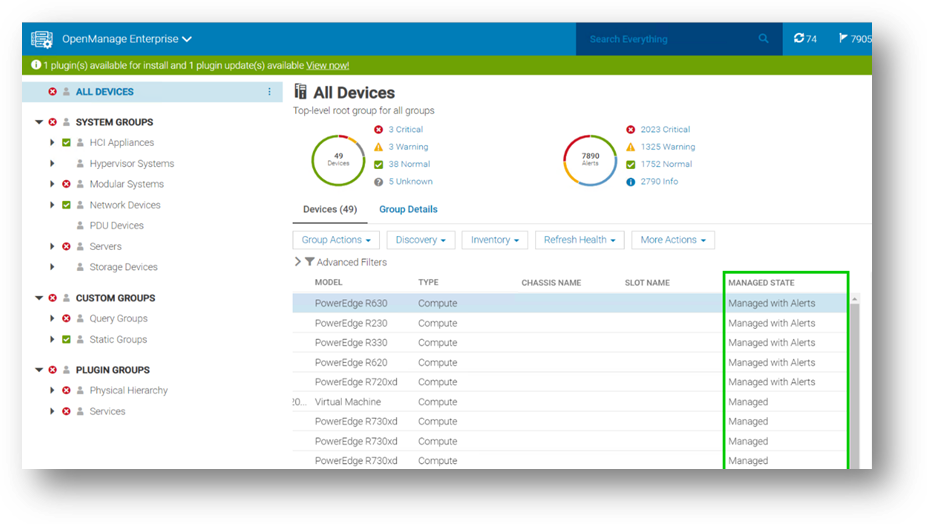
When you log into the OpenManage Enterprise console, you can find the embedded troubleshooting commands in the monitor menu. To run a test, select “troubleshooting” then enter the problem device IP address or hostname. Troubleshooting can start with a simple ping, then select the required protocol for deeper investigation, as shown here.
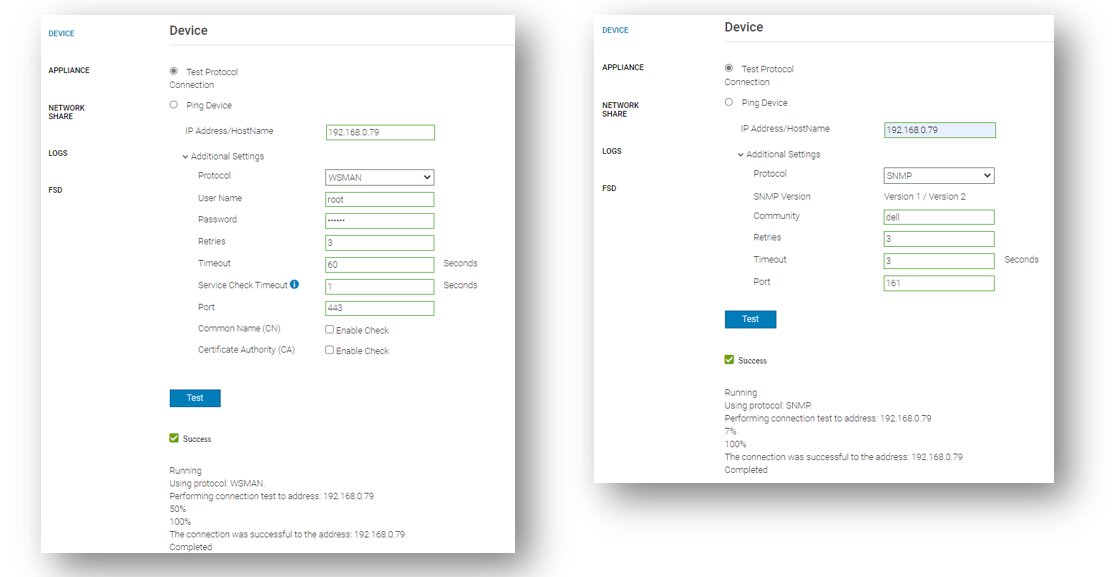
Beyond the basic ping that ensures that the target host can be “seen” on the network, the integrated troubleshooting also supports various protocols. Examples of these include WSMAN, REDFISH, and SNMP for testing the remote SNMP service and the community name on iDRACs. Operating system connectivity tests are also included, such as SSH for Windows and Linux.
If a device cannot be reached, this might be caused by a firewall. To ensure that the correct ports are open, see the section Supported protocols and ports in OpenManage Enterprise in the OpenManage Enterprise 3.9 User's Guide which lists the required TCP/IP ports, with details about traffic direction and usage.
The goal is to have any server’s managed state be “Managed with Alerts”, as shown here. This state means that the discovery has completed successfully: the device is recognized as a server, and the SNMP service on the iDRAC has been configured correctly to send event traps to the OpenManage Enterprise management appliance.
In my role as a technical marketing engineer, I now regularly guide customers to this embedded troubleshooting tool to diagnose problems. This has often been a major step in understanding configuration issues and resolving any device discovery difficulties rapidly.
Resources
Learn more at: Support for Dell OpenManage Enterprise
Author: Mark Maclean, OpenManage Technical Marketing Engineering

Strengthen the Security Posture of your PowerEdge Servers

Tue, 25 Oct 2022 19:27:27 -0000
|Read Time: 0 minutes
We've heard it said “Give a hacker a 0-day vulnerability, and they will have access for a day; teach a hacker to phish, and they will have access for life.” That made us smile. However, at Dell Technologies we take security very seriously with the mindset that security should be built in, not an add on. In our roles at Dell, we focus on the server management portfolio and we have created a number of tools to help organizations strengthen the security posture of PowerEdge servers.
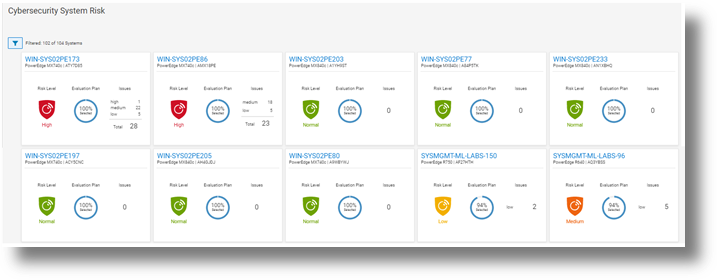
Starting with CloudIQ, our cloud-based AI OPS infrastructure analytics offering, we incorporate a cybersecurity engine that includes a selection of click to enable security policies for PowerEdge servers, based on Dell best practices. We recently published two DfD (direct from development) papers:
- Harden Your Server Cybersecurity With Dell CloudIQ DfD highlights the details of the security policy engine now included in CloudIQ.
- Dell CloudIQ Cybersecurity For PowerEdge: The Benefits Of Automation DfD highlights the time saved using CloudIQ cyber security to police PowerEdge configurations. The results demonstrated that customers can easily create a 15 test policy and apply it to 1000 servers in under three minutes*, as compared to over 98 hours to perform these tasks manually.
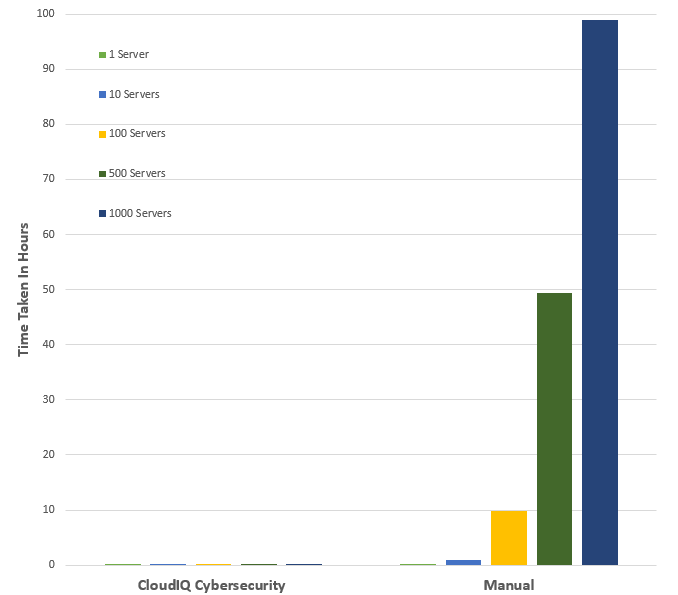
*Projected outcomes based on Dell internal analysis of results of one and ten servers, customer results may vary.
Then looking on premise — OpenManage Enterprise (OME), Dell’s server management solution, scales up to 8000 nodes. OME provides full and rich server configuration drift detection and remediation management of the server configuration profiles accessed from each individual server’s iDRAC. For an overview of that feature, and details about firmware versions and the firmware configuration process, see Improve Operational Efficiency Through OME Server Drift Management.
References
- Dell CloudIQ Cybersecurity For PowerEdge: The Benefits Of Automation (DfD)
- Harden Your Server Cybersecurity With Dell CloudIQ (DfD)
- OpenManage Enterprise: Security Built In (Blog)
Authors: Kim Kinahan and Mark Maclean, PowerEdge Technical Marketing Engineering
New OpenManage Enterprise Advanced+, Ready to Bring New Customer Benefits
Wed, 10 Aug 2022 19:10:25 -0000
|Read Time: 0 minutes
Recently I heard a joke: How many developers does it take to change a light bulb …none, it's a hardware problem. Historically Dell has been perceived as a hardware vendor. This means that some customers still have not realized the many features and benefits that our Dell developed OpenManage Server management software portfolio delivers.
OpenManage Enterprise (OME), Dell's on-premise server lifecycle management console, is core to Dell's server management solutions. Since its release in September 2018, OME continues to increase in functionality to drive down the number of separate standalone tools and consoles required to manage the lifecycle of Dell PowerEdge servers.
This management solution supports Dell's strategy of unifying, streamlining and delivering automation. OpenManage Enterprise manages approximately 50% of all Dell servers currently deployed, highlighting how valuable and useful customers find this solution*. The standard version of OME is free, with advanced features such as server deployment and power management requiring additional licenses.
Starting June 20th, 2022, Dell has added a new Advanced+ license that enables even more OME functionality. It includes the license for the new OME plugin for VMware integration OpenManage Enterprise integration of VMware vCenter (OMEVV), and the bundling in of the ServiceNow integration license. It will also include the OpenManage Enterprise Microsoft System Center Integration plugin (OMEMSSC) which will be available early in 2023.
Here’s a summary of OME features and licensing:
OME Free | OME Advanced | OME Advanced+ |
|
|
|
Note: These licenses are tied to an individual server and hosted on the iDRAC but are different from iDRAC licensing (such as iDRAC Datacenter) because they do not enable iDRAC features. Instead, they enable external software and features such as OME, as shown in the table above.
Conclusion
As server administration teams are asked to manage more infrastructure, in less time than ever before, it is crucial for these teams to leverage any new solutions to drive efficiency.
To enable the new features and benefits of the Advanced+ license, including OMEVV, ask your Dell sales team about OMEVV and for a quote for the OME Advanced+ license.
To learn more, see:
- OpenManage Portfolio Software Licensing Guide
- Server System Management Software
- Follow this link for a trial 90 day Advanced+ license
- OpenManage Enterprise Product information
- Dell OpenManage Enterprise support site
* 50% in claim based on attached license sales and OME downloads
Author: Mark Maclean, PowerEdge Technical Marketing Engineering

OpenManage Enterprise: Security Built In
Sun, 10 Jul 2022 15:50:17 -0000
|Read Time: 0 minutes
I've heard it said that the two biggest cybersecurity fears that customer security teams have are: everyone who works at the company and everyone who doesn't.
Given this fact, this blog describes the most common security features designed in to open manage enterprise, Dell's on-premise server life cycle management solution.
So let’s review the security built into Dell OpenManage Enterprise (or “OME” for short). OME has many security features to protect data held within the appliance and to guard against unauthorized access and use. The Dell server management team aims to provide best in class, on-premise, one-to-many PowerEdge server management capabilities with OME, and ensures that these can be used while meeting customers security requirements.
In December 2021, Dell Technologies released OpenManage Enterprise 3.8.4 update with a mitigation for Apache Log4j Java vulnerability. This Java Vulnerability was a catalyst for many customers to have a broader security review of many commonly used IT tools and solutions.
Since then, Dell has released OME 3.9 that includes an updated plugin for Dell CloudIQ with the new PowerEdge Cybersecurity feature (see the video Building & Tracking Dell CloudIQ Cyber Security Policies for PowerEdge Servers).
Secure foundations
OpenManage Enterprise “OME” is a systems management appliance that is delivered in a virtual machine format, ready to be deployed. This virtual appliance is based on hardened Security-Enhanced Linux (SELinux) with an internal firewall configured. Policies ensure data protection and managed access to the OME workflows. OME stores all sensitive data encrypted with the OME generated encryption key. All user credentials are stored with a one-way hash and cannot be decrypted. In addition to local user authentication, OME offers authentication by means of AD/LDAP or OpenID Connect. Of course, OME supports only user connections over a TLS v1.2 channel and redirects all HTTP requests to HTTPS to ensure that communications follow a secure channel.
Role and scope access control
OME has Role Based Access Control (RBAC) that clearly defines the user privileges for the three built-in roles—Administrator, Device Manager, and Viewer. Scope-based Access Control (SBAC) is an extension of the RBAC feature that allows an administrator to restrict a Device Manager role to a subset of device groups, called “scope”. For more information about RBAC and SBAC, see Role and scope-based access control in OpenManage Enterprise on the Dell Support site.
Login policies
OME security configuration settings allow customers to restrict incoming connections to the appliance. This can be done by a restricted “allowed” network IP range, so that only certain IP addresses are valid for access. Also, a “lockout” policy can be created, using either username or an IP address to block multiple unauthorized access attempts.
Network interfaces
OpenManage Enterprise enables customers to add multiple network interfaces that allow for the configuration of a more secure management network. For example, applying different firewall rules to the interface can provide a greater level of security for the external-facing network interface.
In addition, OME supports customizing the TCP ports used by core https console access and for the NFS share. IPv6 Protocol, including communications to and from iDRACs, is also supported as an option.
Auditing and logging
Auditing provides a historical view of the users and activity on the system. For example, an audit log is recorded when a group is assigned, access permissions change, or a user role is modified.
These events are written to the OME audit log files and can be exported to CSV file format. In addition, if an administrator enables forwarding to a syslog system and configures an appropriate event rule, OME can forward event message(s) to the syslog server.
To wrap up
This blog has highlighted some of the key methods and features Dell uses to keep OpenManage Enterprise secure, so that customers can use it with confidence.
Resources
To learn more about OME and related topics, see:
- OpenManage Enterprise
- Dell OpenManage Enterprise Security Features Video
- Dell OpenManage Enterprise 3.8.2 Security Configuration Guide
- Dell Response to Apache Log4j Remote Code Execution Vulnerability (CVE-2021-44228)
- Role and scope-based access control in OpenManage Enterprise
Author: Mark Maclean, PowerEdge Technical Marketing Engineering