


Related Documents

iDRAC9 Virtual Power Cycle: Remotely power cycle Dell EMC PowerEdge Servers

Mon, 16 Jan 2023 17:55:02 -0000
|Read Time: 0 minutes
Summary
Dell EMC PowerEdge servers stand out for offering the ability to remotely invoke an A/C power cycle to the Baseboard Management Controller. With distributed and scaled-out IT environments, the means of restoring or resetting power states in as little time as possible takes on added importance.
Introduction
On those occasions when it’s necessary for an IT admin to reboot a server, whether due to a faulty hardware component or an operating system ‘stuck’ in an unresponsive state, it may be necessary to drain all power to the server. This step is rare but could be the essential means to drain auxiliary power from capacitors to recover a device in a hung state and reboot the physical device’s firmware stack.
Since it is increasingly unlikely that a server room is located ‘down the hall’, and more likely across town within a ‘lights out’ co-location datacenter, the means of restoring or resetting power states in as little time as possible takes on added importance.
iDRAC9 enables remote power cycles
With the integrated Dell Remote Access Controller (iDRAC), standard on all Dell EMC PowerEdge servers, IT administrators can mimic a power cycle and restore the system without having to go to the datacenter, find the server in the hot aisle, and pull the plug. The following solutions will work for either AC or DC power supplies.
Invoking Virtual A/C Power Cycle
Dell EMC PowerEdge servers with iDRAC9 offer 2 options for invoking a virtual A/C (vAC) power cycle:
- Use of iDRAC9 out-of-band capabilities
- Use of an iDRAC Service Module (iSM) installed on Windows, Linux, or ESXi
Both options eliminate the need for physical presence, to locate the correct server in a hot aisle, and pull out the power cord before plugging it back in.
The path chosen is likely predicated on situation particulars:
- Using iDRAC, assuming no operating system dependencies:
- Set “Full Power Cycle” using GUI/Redfish/RACADM
- ‘Power Cycle’ – perform a power cycle of the server via iDRAC
- To note, the virtual A/C power cycle is always available and can be performed regardless of the host state; indeed, it may be required if the host operating system is not responding properly
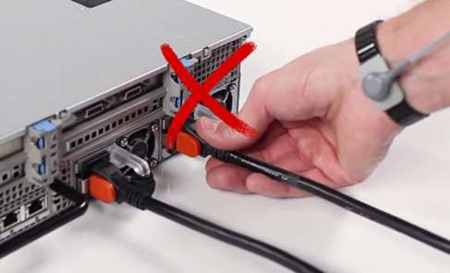
- Of further note, this process applies to rack/tower systems, whereas for modular systems, it’s best to use the “virtual reseat” of the server option.
- iSM – sending commands to an agent through the operating system or hypervisor:
- Two commands are issued, one to activate the vAC, and one to perform a graceful power-down of the host
- May be necessary whenever the iDRAC is in an unresponsive state
- Requires PowerEdge servers with iDRAC9
Invoking a remote virtual A/C power cycle
With iDRAC, via the:
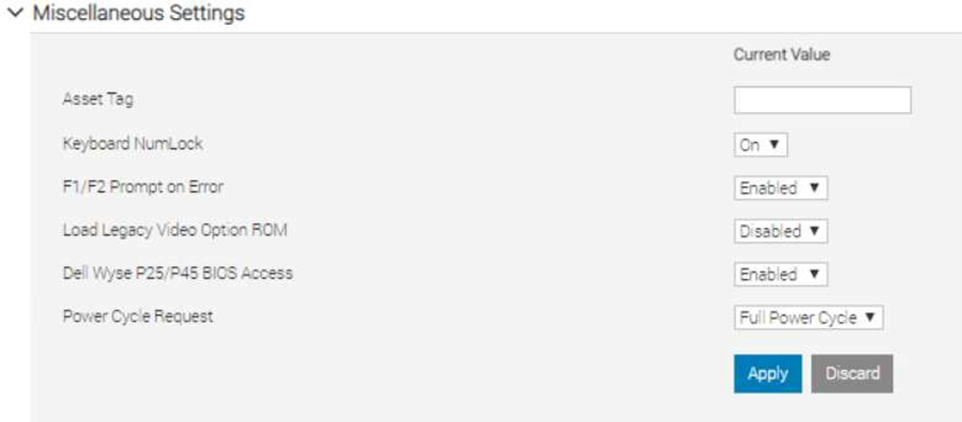
- GUI – navigate to Configuration > BIOS Settings > Miscellaneous Settings > Power Cycle Request
RACADM
- racadm set BIOS.MiscSettings.PowerCycleRequest FullPowerCycle
- racadm jobqueue create BIOS.Setup.1-1
- reboot host when ready.
Redfish
- PATCH / redfish/v1/Systems/System.Embedded.1/Bios/Settings with
{
“Attributes”: {
“PowerCycleRequest”: “FullPowerCycle:
},
"@Redfish.SettingsApplyTime": {
"@odata.type": "#Settings.v1_1_0.PreferredApplyTime", "ApplyTime": "OnReset"
}
}
When the patch command has successfully completed, a 202 “Accepted” status message will be returned along with the Task URI for newly created job.
- POST /redfish/v1/Systems/System.Embedded.1/Actions/ComputerSystem.Reset
{
"ResetType":"On" /// If Powered Off
}
or
{
"ResetType":"GracefulRestart" /// If already Powered On
}
This will restart the Host and start the Task/Job, wait for it to complete.
- iSM
- For Windows operating system – Shortcut menus are available for the FullPowerCycle Activate (request), FullPowerCycle Cancel and FullPowerCycle get status operations.
- To request FullPowerCycle on your system, type Invoke-FullPowerCycle –status request cmdlets in power shell console
- To get the status of the Full Power Cycle on your system, type Invoke-FullPowerCycle –status Get cmdlets in power shell console
- To cancel the Full Power Cycle on your system, type Invoke-FullPowerCycle –status cancel cmdlets in power shell console
- For Windows operating system – Shortcut menus are available for the FullPowerCycle Activate (request), FullPowerCycle Cancel and FullPowerCycle get status operations.
- For Linux operating system –
- To request Full Power Cycle on your system, type /opt/dell/svradmin/iSM/bin/Invoke-FullPowerCycle request
- To get the status of the Full Power Cycle on your system, type /opt/dell/svradmin/iSM/bin/Invoke-FullPowerCycle get-status
- To cancel the Full Power Cycle on your system, type /opt/dell/svradmin/iSM/bin/Invoke-FullPowerCycle cancel
Note: After running the command, a host power cycle (cold boot) is necessary for FullPowerCycle to take effect.
Conclusion
With servers increasingly managed remotely, a means of performing the virtual equivalent of pulling out the power cord and pushing it back in is a necessary capability in order to occasionally ‘unstick’ the operating system. With the Dell EMC PowerEdge iDRAC9 virtual power cycle feature, IT admins have access to console or agent-based routines to restore or reset power states in minutes rather than hours. This remote capability is essential to keeping distributed and scaled- out IT environments running smoothly.
Resources
iDRAC9 whitepapers and videos www.dell.com/support/idrac
iDRAC Manuals and User Guides www.dell.com/idracmanuals
iDRAC Service Module
www.dell.com/idracmanuals (select iDRAC Service Module)

Transform Datacenter Analytics with iDRAC9 Telemetry Streaming
Mon, 16 Jan 2023 16:51:18 -0000
|Read Time: 0 minutes
Summary
Telemetry Streaming, a new feature in iDRAC9 v4.0 enabled by the new Datacenter License, can produce more high-value (comprehensive and accurate) data faster than with previous versions. There is a huge amount of untapped machine data in your IT infrastructure: use iDRAC9 Telemetry Streaming and analytics to leverage that data to optimize your server management and operations.
Introduction
With the advent of the new iDRAC9 v4.00.00.00 firmware release and the Datacenter license, IT managers can now integrate advanced telemetry about the server hardware operation into their existing analytics solutions. This telemetry is provided as granular, time-series data that can be streamed versus using inefficient, legacy polling methods. The advanced agent-free architecture in iDRAC9 provides over 180 data metrics (with more coming) related to server and peripherals operations that are precisely time-stamped and internally buffered to allow highly efficient data stream collection and processing with minimal network loading. This comprehensive telemetry can be fed to popular analytics tools to predict failure events, optimize server operation, and enhance cyber-resiliency.
Telemetry and Analytics
Telemetry has been around for decades and has been used in various business applications, from hospitals monitoring patients to oil and gas drilling systems to weather balloons transmitting meteorological data. The definition of Telemetry is an “automated communications process by which measurements are made, and other data collected at remote or inaccessible points are transmitted to receiving equipment for monitoring.”
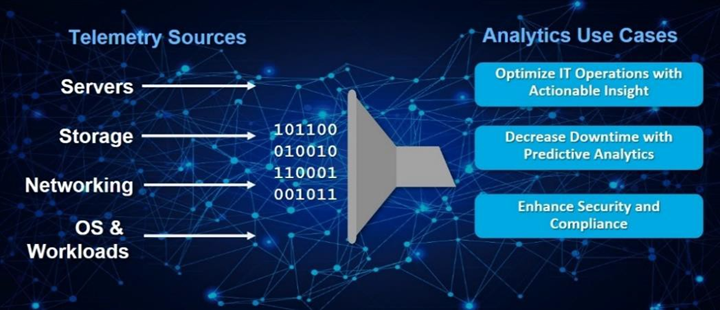
Figure 1. Telemetry Monitoring in a Typical Data Center
In the era of “Big Data,” IT managers leverage a wide range of telemetry from their infrastructure in their monitoring tools, as shown in Figure 1. However, increasingly that telemetry is also used in AI-based analytics to gain operational insight into their datacenter operations. This is far more powerful than using simple alerting and monitoring techniques that typically only report health and status via SNMP alerts or IMPI traps.
Using analytics tools, IT managers can more proactively manage by analyzing trends and discovering insightful relationships between seemingly unrelated events and operations. A recent survey found that 61% of IT decision-makers considered data and analytics very important to their business growth strategy/digital transformation efforts.1
Some of the use cases for data center analytics are:
- Predictive analytics: Customers can perform an in-depth analysis of server telemetry, including device parametric data to proactively replace failing devices. In one case, an IT team used analytics on telemetry from memory devices to develop an algorithm that predicted eventual failure. This allows proactive replacement of suspect devices during scheduled maintenance windows, significantly improving uptime and SLA quality.
- Optimized IT operations: You can perform time-series analysis of vital server metrics to gain insights into optimizing server operation, including tracking of power, temperature, CPU, and I/O performance, etc. One industry that makes extensive use of analytics is High-Frequency Trading, where every millisecond of compute counts in accelerating automated trades. Detailed telemetry is commonly used to discover ways to squeeze out more performance from servers, which becomes a key competitive advantage in this industry.
- Security: AI-based analytics can respond far faster to security events. You can enhance security AI and forensics by monitoring the say of unusual user login activity or physical intrusion events on your servers.
However, to perform effective analytics, you need data: lots and lots of it to feed Machine or Deep Learning techniques effectively. The larger the data set, the more accurate the analysis becomes as evidenced by the petabytes of data that social media uses in analytics of user attributes and buying behaviors.
The Streaming Advantage in iDRAC9
Telemetry streaming’s big performance advantage is in reducing the overhead needed to get the complete data stream from a remote device. Retrieving telemetry using polling can result in an enormous number of discrete commands being issued, which is very challenging in scaling across a large datacenter. With iDRAC9 Telemetry Streaming, you get time-series and detailed statistics reports delivered directly to a variety of analytics collection tools with higher efficiency by removing the need for issuing individual commands for each piece of data. The streaming configuration is flexible so users can modify the number of metrics they require, the report interval (30 seconds for example), and enable reports to be sent immediately upon detection of critical events in the server (like a PSU failure say).
In summary, the advantages of Streaming over Polling are:
- Better Scalability: Polling requires a lot of scripting work and CPU cycles to aggregate data and suffers from scaling issues when we are talking about 100’s or 1000’s of servers. Streaming data, in contrast, can be pushed directly into popular analytics tools like Prometheus, ELK stack, InfluxDB, Splunk without the overhead and network loading associated polling.
- More Accuracy: Polling can also lead to data loss or “gaps” in sampling for time series analysis; it is usually only a snapshot of current states, not the complete picture over time. You might miss critical peaks or excursions in data.
- Less Delay: Data can be severely delayed in time due to needing multiple commands to get a complete set of data and the inability to poll simultaneously from a central management host. Streaming more accurately preserves the time-series context of data samples.
Consequently, streaming is a far more efficient and accurate way to gather telemetry.
Telemetry Excellence with the iDRAC9 Datacenter License
iDRAC9 v4.0, with the Datacenter license, offers over 180 telemetry metrics on various server devices and sensors. These metrics also form the basis of our SupportAssist Collection Report, an incredibly useful tool that captures over 5,000 pieces of diagnostic data and log files for troubleshooting server issues. iDRAC9 Telemetry Streaming does all the heavy lifting for you by internally sampling and storing all the data points and then streaming them out in reports at a frequency that fits your needs. iDRAC9 can deliver almost 3 million metrics a day to transform the accuracy of analytics processing for your data center!
Telemetry can be delivered via the following methods:
- Redfish Server-Sent Events (SSE), a DMTF standard for streaming data2
- Redfish subscription for pushing events, another DMTF standard
- Remote Syslog, a protocol for pushing logs for centralized monitoring
- Non-streaming, scripted polling via the iDRAC9 RESTful API (though not as efficient as streaming as discussed earlier)
The data is formatted using JSON (JavaScript Object Notation) and can be easily adapted to connect many analytics solutions on the market, as shown in Figure 2.
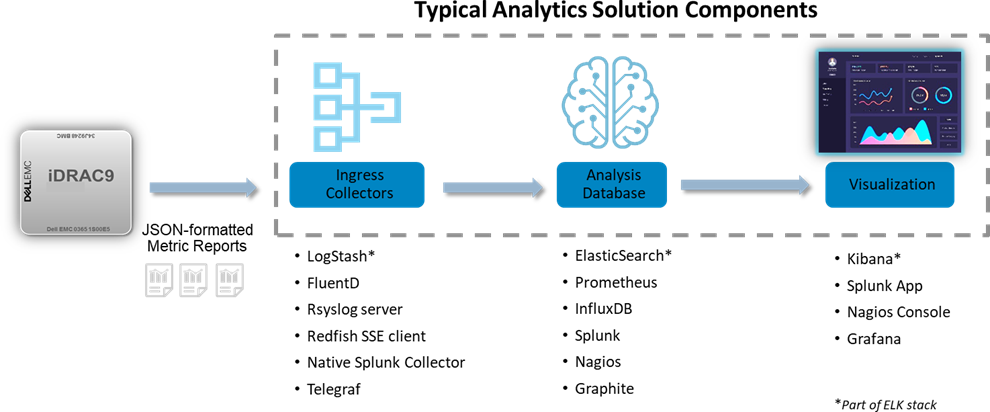
Figure 2. Integrating iDRAC9 Telemetry Streaming with Popular Analytics Solutions
Types of Telemetry Data
A summary of the types of telemetry that iDRAC9 has are:
New Telemetry Data with iDRAC9 4.0:
- Serial Data Log messages
- GPU Accelerator Inventory & Monitoring
- Advanced CPU Metrics
- Storage Drive SMART logs
- Advanced Memory Monitoring
- SFP+ Optical Transceiver Inventory & Monitoring
Existing Telemetry Data:
- Configuration – comprehensive settings for all devices (BIOS, iDRAC, NICs, RAID, etc.)
- Inventory: comprehensive server hardware and firmware reporting
- Performance: CPU, memory bandwidth and I/O usage (Compute Usage Per Second or CUPS)
- Performance and diagnostic statistics: PERC, NICs, Fiber Channel
- Sensors: voltage, temperature, power, connectivity status, intrusion detection
- Logs: SEL log, iDRAC diagnostics, Lifecycle Controller Log
Figure 3 illustrates an external analytics solution capturing and visualizing iDRAC9 Telemetry Streaming. In this case, CUPS performance data was streamed to InfluxDB for the data analysis, and Grafana then used for the visualization.
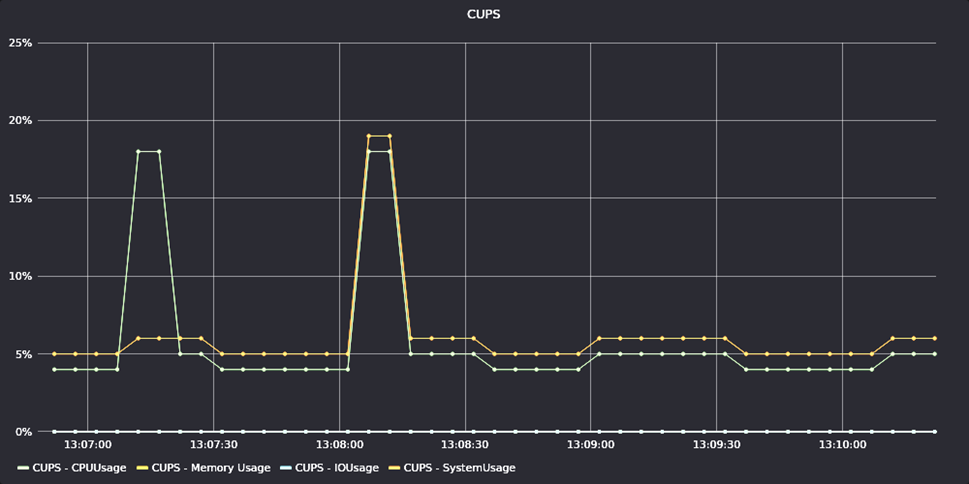
Figure 3. Example of iDRAC9 Telemetry for CUPS Performance Data
In Conclusion
Dell EMC continues to introduce innovations that help our customers automate the management of their IT infrastructure. iDRAC9 Telemetry Streaming represents a huge step forward in helping our customers leverage the extensive data available in their PowerEdge servers. Customers can easily stream this telemetry into their analytics tools and leverage advanced AI techniques to automate their IT systems management and operations further.
- “2020 Global State of Enterprise Analytics”, published by MicroStrategy.
- Server-Sent Events (SSE) is a server push technology (part of HTML5) enabling a client to receive automatic updates from a server via an HTTP/S internet connection.