


Related Documents

Getting Started with Integrated Dell Remote Access Controller (iDRAC)


Fri, 27 Jan 2023 16:53:49 -0000
|Read Time: 0 minutes
Integrated Dell Remote Access Controller (iDRAC) is a baseboard management controller (BMC) built into Dell PowerEdge servers. iDRAC allows IT administrators to monitor, manage, update, troubleshoot, and remediate Dell servers from any location without the use of agents and out-of-band. It consists of both hardware and software that provides extensive features compared to a basic baseboard management controller.
Key features of iDRAC
iDRAC is designed to make you more productive as a system administrator and improve the overall availability of Dell servers. iDRAC alerts you to system issues, helps you to perform remote management, and reduces the need for physical access to the system.
Ease of use
- Remote management: Server management can be performed remotely, reducing the need for an administrator to physically visit the server. By providing secure access to remote servers, administrators can perform critical management functions while maintaining server and network security. This remote capability is essential to keeping distributed and scaled-out IT environments running smoothly. Using the GUI, an administrator can perform firmware maintenance and configuration of BIOS, iDRAC, RAID, and NICs; deploy operating systems; and install drivers.
- Agent-free monitoring: iDRAC is not dependent on the host operating system and does not spend CPU cycles on agent execution, intensive inventory collection, and so on.
- Thermal management: iDRAC’s Thermal Manage feature provides key thermal telemetry and associated controls that allow customers to monitor the thermal radiation dynamics and run their environment efficiently.
- Virtual power cycle: With servers increasingly being managed remotely, a means of performing the virtual equivalent of pulling out the power cord and pushing it back in is a necessary capability to occasionally ”unstick” the operating system. With the PowerEdge iDRAC9 virtual power cycle feature, IT admins have access to console or agent-based routines to restore or reset power states in minutes rather than hours.
Security features
iDRAC offers security features that adhere to and are certified against well-known NIST, Common Criteria, and FIPS-140-2 standards.
- Automatic certificate renewal and enrollment: This feature makes it easy for users to secure network connections using TLS/SSL certificates. The iDRAC web server has a self-signed TLS/SSL certificate by default. The self-signed certificate can be replaced with a custom certificate, a custom signing certificate, or a certificate signed by a well-known certificate authority (CA). Automated certificate upload can be accomplished by using Redfish scripts. iDRAC9 automatic certificate enrollment and renewal automatically ensures that SSL/TLS certificates are in place and up to date for both bare-metal and previously installed systems. Automatic certificate enrollment and renewal requires the iDRAC9 Datacenter license.
- Secure supply chain: The iDRAC boot process uses its own independent silicon-based Root of Trust that verifies the iDRAC firmware image. The iDRAC Root of Trust also provides a critical trust anchor for authenticating the signatures of Dell firmware update packages (DUPs).
- Authentication: iDRAC offers a simple two-factor authentication option to enhance login security for local users. RSA SecurID can be used as another means of authenticating a user on a system.
Scalable data analytics with telemetry streaming
Using analytics tools, IT managers can more proactively manage systems by analyzing trends and discovering relationships between seemingly unrelated events and operations. iDRAC9 telemetry streaming with over 180 metrics/sensors can provide data on server status with no performance impact on the main server. Telemetry streaming’s big performance advantage is in reducing the overhead needed to get the complete data stream from a remote device. Advantages of iDRAC telemetry streaming include:
- Better scalability: Polling requires a lot of scripting work and CPU cycles to aggregate data and suffers from scaling issues when we are talking about hundreds or thousands of servers. Streaming data, in contrast, can be pushed directly into popular analytics tools such as Prometheus, ELK stack, InfluxDB, and Splunk without the overhead and network loading associated polling.
- More accuracy: Polling can also lead to data loss or “gaps” in sampling for time series analysis; it is usually only a snapshot of current states, not the complete picture over time. You might miss critical peaks or excursions in data.
- Less delay: Data can be severely delayed in time due to needing multiple commands to get a complete set of data and the inability to poll simultaneously from a central management host. Streaming more accurately preserves the time-series context of data samples.
Resources
You can explore the following resources to learn more about iDRAC. Also, you can see for yourself the capabilities of PowerEdge iDRAC in our virtual lab setting.
Tech notes
- Telemetry streaming
- Thermal management
- Improved iDRAC9 Security using TLS 1.3 over HTTPS
- iDRAC9 Virtual Power Cycle
- iDRAC9 System Lockdown: Preventing Unintended Server Changes
- Automatic SSL/TLS certificate enrollment
Benchmark studies by industry analysts
- Deployment with zero touch provisioning
- Automated renewal of SSL certificates
- Telemetry streaming
- Splunk integration with iDRAC telemetry
Videos
- Large scale iDRAC telemetry and integration with Splunk
- Advanced Thermal Management with iDRAC9
- Automatic Certificate Enrollment with iDRAC9
- System lockdown to prevent unwanted drift in server configurations
Other resources:
- Explainer video covering what’s new in the GUI of iDRAC9 v4.0
- Deep dive demo of Server Configuration Profile feature of iDRAC9
- Deep-dive webinar on Telemetry Streaming feature for large-scale server management

Reduce Server Power Usage and Save Money with Power Manager


Mon, 16 Jan 2023 18:41:07 -0000
|Read Time: 0 minutes
Summary
Between the substantial rise in energy costs and organizations’ sustainable initiatives to reduce global warming, lowering data center power usage is a key strategy for many IT teams. This Direct from Development Tech Note describes the capabilities of Dell OpenManage Enterprise Power Manager version 3.0, which is a fully integrated extension to Dell OpenManage Enterprise. Power Manager provides increased visibility of server power data, including consumption, anomalies, and utilization. Customers can use this tool to discover and then proactively manage server power consumption plus server thermals while also assessing their carbon footprint.
Introduction
The phrase “you can’t manage what you can’t measure” is often attributed to W. Edwards Deming, the statistician. In terms of server power usage, this adage means that organizations need data plus tools to manage and lower server power usage, resulting in a reduced carbon footprint. With Dell OpenManage Enterprise Power Manager, PowerEdge customers can both monitor and actively manage server power usage. In addition to reporting power and thermal data, Power Manager can also cap server power consumption and manage thermal events. Version 3.0 also introduces a new carbon usage calculation feature for customers who want to understand their server estate emissions.
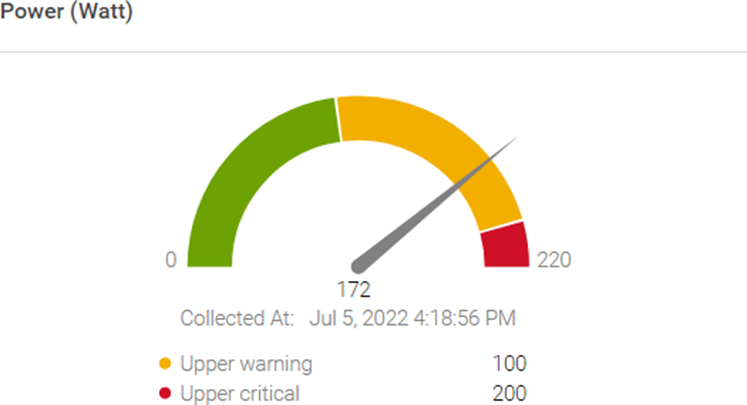
Figure 1. Server power usage data and threshold
Power reduction strategy
OpenManage Enterprise Power Manager supports creating a power reduction strategy easily and efficiently through several key elements.
Current usage
Discovering the current usage across an entire server estate is simple. Each managed server’s iDRAC gathers various metrics, such as power consumption, thermal utilization, and server utilization. OpenManage Enterprise collects and displays the data in dashlet graphs (mini dashboards), such as Power History (Watt) (shown in Figure 2). Within the tool, administrators can place servers into racks, aisles, and then data center collections to reflect the real-world environment to assist with reporting and actions. These dashlets offer powerful visualization of the data, from one server to an entire server fleet, for the last few hours or up to an entire year. If required, customers can add power values for unmonitored devices for a more complete view of data center power usage. An OpenManage Enterprise Advanced or Advanced+ license is required on each server to enable Power Manager.
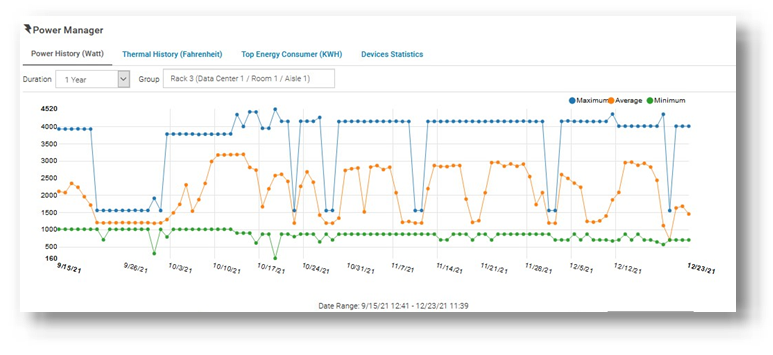
Figure 2. Power history for one group of servers
Review and analyze
Through its dashlets, Power Manager accelerates customers’ understanding by providing relevant data that highlights servers that should be reviewed. These include top energy consumers (kWh), as shown in Figure 3.
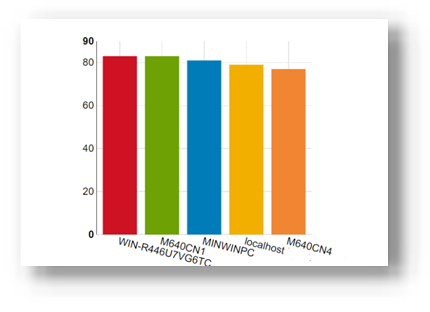
Figure 3. Top energy-consuming servers (kWh)
This data is also consolidated into reports and is available in the custom report builder as well. The prebuilt library contains numerous useful reports, including Power Manager: Server Utilization Report and Power Manager: Power and Thermal Report (shown in Figure 4). These reports highlight underutilized and idle servers that could be candidates for consolidation or decommissioning.
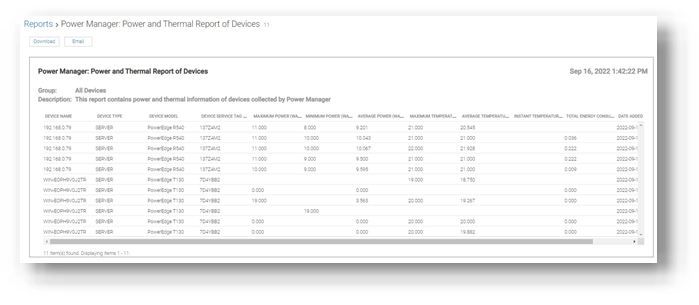
Figure 4. Power and thermal report
Administrators can assess power draw by virtual machines (VMware ESXi and Microsoft Hyper-V hosts) as well as power draw by key components such as CPU, RAM, server fans, and local storage.
Customers who want carbon footprint data can use the integrated greenhouse gas emissions reports that detail energy consumed (kWh) and greenhouse gas emissions per server and per group. All report data can be exported as HTML, PDF, CSV, or XLS, and any report can be run ad hoc or automatically delivered by email on a regular basis through the OpenManage Enterprise report schedule.
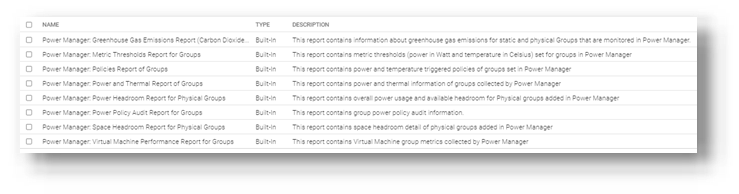
Figure 5. List of power-related reports
Take action
Administrators can consider using power capping during hours that are outside of normal operations or in test and development environments. Modern servers are relatively efficient when idling; however, the introduction of power capping can guarantee low power usage. Administrators can use Power Manager’s static policies to set budget power for a device or group, or even the entire server estate, as shown in Figure 6. Power caps can be set in watts or percentage.
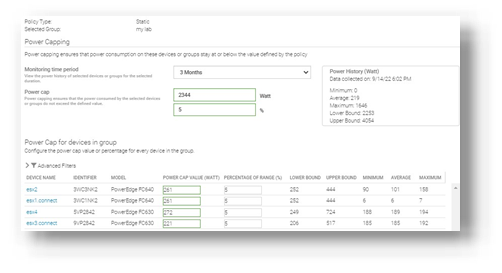
Figure 6. Creating a power-capping policy for multiple servers
For example, an administrator might have no power capping policies during the day when full server performance is required and configure a lower power cap for evenings and weekends when server workload is less.
Additional suggestions to decrease power consumption and carbon footprint include:
- Review and change the server BIOS system profile. For example, change Maximum Performance to Performance Per Watt. Expect Power Manager to manage this profile setting in future releases.
- Replace or consolidate older servers that use outdated CPU technology. Those older servers are not as power- efficient as the latest generation of PowerEdge. Tools such as Dell Live Optics, through which you can review current server operating system performance data such as RAM capacity and storage performance, and Dell Enterprise Infrastructure Planning Tool (EIPT) can help with further investigation and “what-if” migration modeling.
- Improve the overall efficiency of data center cooling, thereby improving power usage effectiveness (PUE). For example, review air flow for more effective cooling, resolving data center hot spots/cold spots, or implement highly efficient liquid-cooled Dell servers.
- Move to renewable energy sources/suppliers to aid in decreasing carbon emissions.
References
- Dell OpenManage Enterprise Power Manager Support site
- Usage of Reports in Data Center through Dell OpenManage Enterprise Power Manager
- iDRAC, CMC, OpenManage Enterprise, OpenManage Integration with Microsoft Windows Admin Center, OpenManage Integration with ServiceNow, and DPAT trial licenses