


Dell PowerEdge – iDRAC Automatic Certificate Enrollment
Download PDF
Summary
In the latest generation of Dell EMC PowerEdge Servers, iDRAC v4.0, has implemented a new automated security feature to keep your iDRAC SSL/TLS certificates current. The iDRAC’s Automatic Certificate feature automatically assures SSL/TLS certificates are in place and up-to-date for both bare-metal and previously installed systems.
Introduction
Dell EMC PowerEdge server’s Integrated Dell Remote Access Controller (iDRAC) v4.0 offers a new security feature, Secure Sockets Layer (SSL)/ Transport Layer Security (TLS) Automatic Certificate Enrollment that helps the Data Center Manager maintain security with less effort.
Data Center Managers need to be vigilant to make sure that their compute environment is protected from a range of threats and attacks. Monitoring and assuring that all security measures are current and in place is time- consuming and imperative to prevent unauthorized access and manipulation of your servers.
iDRAC Web User Interface and SSL/TLS Certificates
The iDRAC enables remote system management and reduces the need for physical access to the system. The iDRAC Web User Interface can be reached with any supported browser and uses an SSL/TLS certificate to authenticate itself to web browsers and command-line utilities running on management stations thereby establishing an encrypted link.
If the Certificate Authority that issued the certificate is not trusted by the management station, warning messages will be displayed on the management station. Having an iDRAC SSL/TLS certificate in place ensures a validated and secure connection.
Previously, creating and renewing iDRAC SSL/TLS certificates required a mostly manual, time-consuming effort. Monitoring approaching expiration dates and arranging for new certificates to be generated from a CA authority is just one aspect. IT admins then had to update scripts to deploy the certificates to embedded devices like the iDRAC.
iDRAC SCEP Client Support - Automatic Certificate Enrollment
iDRAC has added a client for Simple Certificate Enrollment Protocol (SCEP) support. SCEP is a protocol standard used for managing certificates to large numbers of network devices using an automatic enrollment process. The iDRAC can now integrate with SCEP-compatible servers like Microsoft Server’s NDES service to maintain SSL/TLS Certificates automatically. This feature can be used to enroll and refresh a soon-to-be-expired web server certificate.
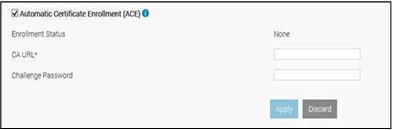
ACE- Automatic Certificate Enrollment
Automatic Certificate Enrollment will enroll and monitor the iDRAC web server SSL/TLS certificate. It enrolls to the specified Certificate Authority (CA) credentials provided. This can be done 1x1 in the iDRAC GUI, set via Server Configuration Profile, or scripted via tools such as Racadm.
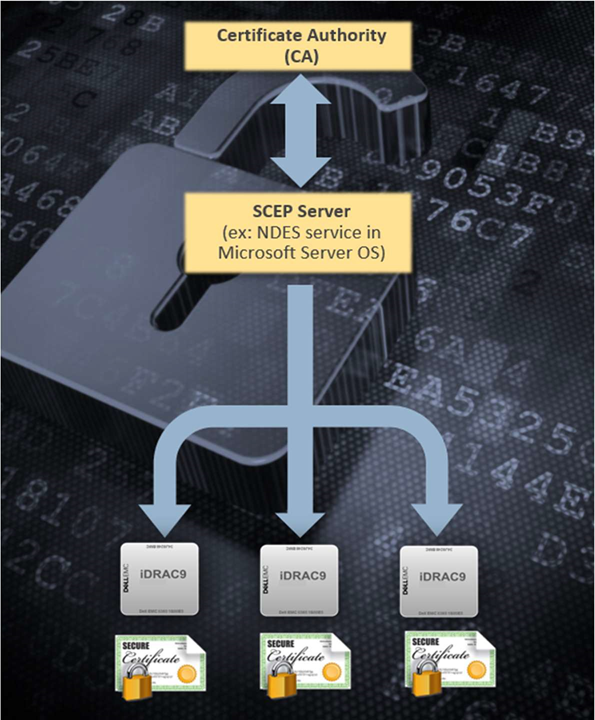
iDRAC Integration with MS-NDES over SCEP
In Conclusion
Monitoring and assuring that all security measures are current and in place is both time-consuming and essential to prevent unauthorized access and manipulation of your servers. The Automatic Certificate Enrollment feature in iDRAC9 v4.0, is just another way Dell EMC is helping you to keep your data center secure.
Related Documents

Server Power Consumption Reporting and Management


Mon, 16 Jan 2023 18:31:46 -0000
|Read Time: 0 minutes
Summary
Between customers’ sustainability initiatives to reduce carbon emissions, and demands to control energy consumption and costs, the ability to report, analyze and action server power usage data has become a key initiative. This DfD tech note explores the rich server power usage data available from Dell PowerEdge servers and the various methods to collect, report, analyze, and act upon it.
What is server power consumption?
A wide variety of server power information is offered by the iDRAC. The amount and frequency of information varies by iDRAC version and licensed features and the choice of optional tools and consoles.
One-to-one and one-to-many
There are multiple ways to view power consumption data from the iDRAC, depending on needs and preferences. One way is to open the web interface GUI. Another way is using scripts, either Racadm or Redfish, to retrieve the data. iDRAC can also send data to the OpenManage Enterprise Power Manager Plugin. OpenManage Enterprise can also forward this information to CloudIQ for PowerEdge. For those customers looking for the ultimate solution, iDRAC9 can stream these power statistics as telemetry data to analytics solutions such as Splunk or ELK Stack for real-time in-depth analysis.
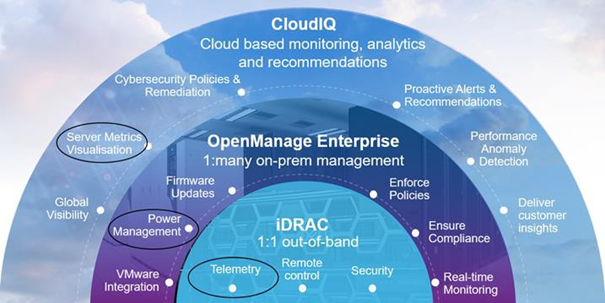
Figure 1. PowerEdge management stack, with power management and data reporting highlighted
PowerEdge server power data
Embedded with every Dell PowerEdge server, the integrated Dell Remote Access Controller (iDRAC) enables secure and remote server access for out-of-band and agent-free server management tasks. Features include BIOS configuration, OS deployment, firmware updates, health monitoring, and maintenance. One key set of data that iDRAC provides is power usage. IT admins have used iDRAC data to view and react to power issues for over 10 years. The iDRAC engineering teams have continued to expand the capabilities within the iDRAC UI as well as the information available to “one to many” consoles such as OpenManage Enterprise. iDRAC9 with Datacenter feature set enabled extends the solution even further with telemetry streaming.
iDRAC
iDRAC monitors the power consumption, processes, and reports continuously at the individual server level. The browser user interface displays the following power values:
- Power consumption warning and critical thresholds
- Cumulative power, peak power, and peak amperage values
- Power consumption over the last hour, last day, or last week
- Average, minimum, and maximum power consumption with historical peak values and peak timestamps
- Peak headroom and instantaneous headroom values (for rack and tower servers)
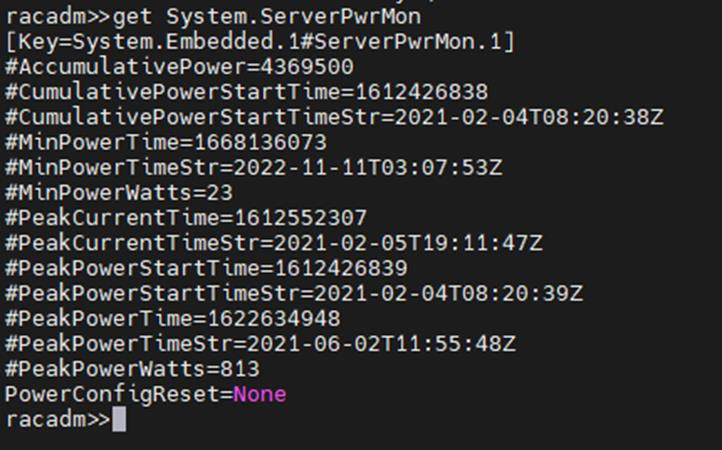
iDRAC9 provides a graphical view of these power metrics such as the power consumption example shown here.
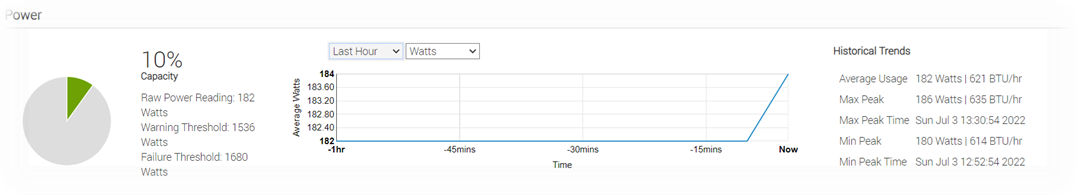
Figure 2. iDRAC9 GUI power consumption data
iDRAC9 connects to all critical server components and, in conjunction with the Datacenter license, can collect over 180 server metrics in near-real-time. These metrics include granular, time-stamped data for critical functions such as processor and memory utilization, network card, power, thermal, and more. iDRAC9 can stream this telemetry data in real time.
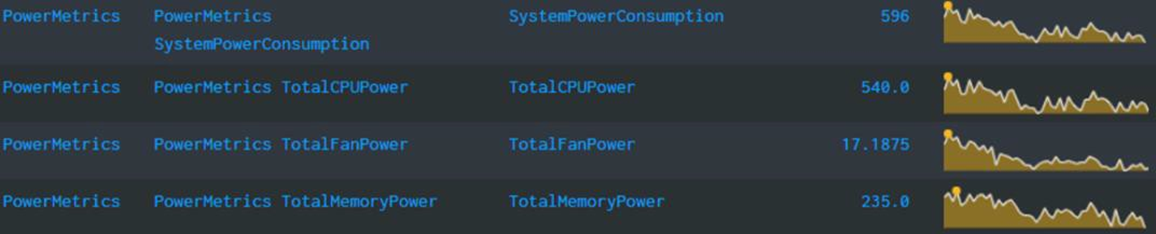
Figure 3. iDRAC power telemetry data collected by Splunk
Get Server Power – RACADM CLI Examples
The RACADM command-line provides a basic scriptable interface that enables you to retrieve server power either locally or remotely. In addition to the CLI interface, iDRAC also supports the Redfish RESTful API. Example Powershell and Python scripts that can be used to collect power data can be download from the Dell area in github.com. The RACADM CLI can be access from the following interfaces:
- Local - Supports running RACADM commands from the managed server's operating system (Linux/Windows). To run local RACADM commands, install the OpenManage DRAC Tools software on the managed server.
- SSH or Telnet (also known as Firmware RACADM) - Firmware RACADM is accessible by logging into iDRAC using SSH or Telnet.
- Remote - Supports running RACADM commands from a remote management station such as a laptop or desktop running Windows or Linux. To run remote RACADM commands, install the OpenManage DRAC Tools software on the management station.
Here are some examples using the remote iDRAC9 SSH CLI method, post authentication.
- Instantaneous server power usage:

- Server power stats:
OpenManage Enterprise Power Manager
The Power Manager Plugin for OpenManage Enterprise uses the power data securely collected from iDRACs to observe, alert, report, and, if required, place power caps on servers. For ease of management, servers can be logically grouped together, such as in a rack, a row, or in custom grouping, such as a workload. Using this data, customers can drive data center efficiency in several ways, such as by easily identifying idle servers for repurposing or retirement. Using built in reports or creating a custom report, customers can identify server racks not using their full available power capacity to deploy new hardware without needing additional power. Customers can mitigate risk by detecting when groups of servers are nearing their power capacity during specific timeframes. Using automated policies, customers can maximize power available to business-critical applications by reducing noncritical consumption by using scheduled or permanent power capping.
Important in today’s climate concerns are reports on carbon emissions based on server usage. Power Manager provides reports on the carbon emissions for individual servers as well as racks and custom groups of servers. This information can be used to identify areas of concern and to show progress in carbon emission reductions based on power policies, removal of idle servers, and other initiatives such as consolidation and refresh.
The power data is displayed by applets integrated into OpenManage Enterprise. (See examples in the following figure.) There are also several predefined reports built into the report library designed around power usage. Power Manager automates actions driven by specific power or thermal events, including running scripts, applying power caps, and forwarding alerts. Power Manager collects this power data and stores it for up to 365 days.
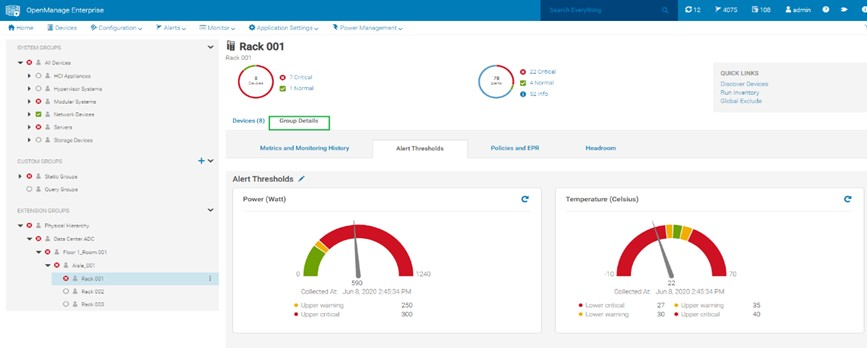
Figure 4. View of a rack group alert threshold graphic for power and thermal
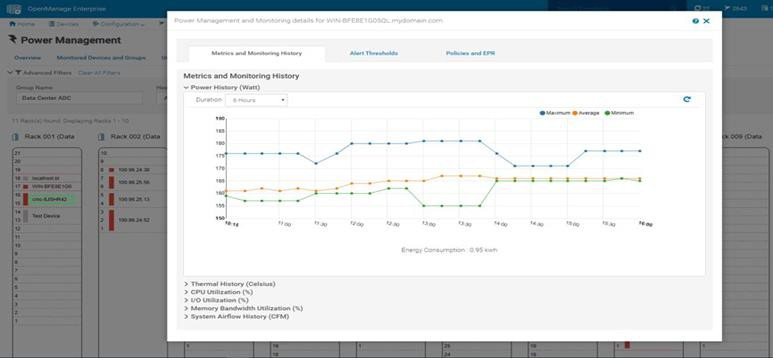 Figure 5. Rack view showing max/min/avg power for the last six hours
CloudIQ for PowerEdge – Reporting Server Power
Another method to visualize and report the power data is by CloudIQ. Utilizing the OpenManage Enterprise CloudIQ Plugin, customers can connect their PowerEdge servers to the Dell hosted CloudIQ secure portal. This is a cloud based software-as-a-service portal, hosted in the Dell data centers, that provides powerful analytic, health, and performance monitoring for servers. CloudIQ can consolidate multiple OpenManage Enterprise instances, providing a truly global view of an organization’s server estate. Within CloudIQ, power data can be graphed and reported on over time. These graphs can easily be exported or emailed as PDFs and the raw data exported as CSV for further reviews. In fact, in addition to collecting power metrics, CloudIQ can track and collect over 50 server metrics for users to review. CloudIQ also interfaces with other elements of Dell’s infrastructure, including storage and networking, giving customers the ability to correlate data, events, and trends across multiple technologies. CloudIQ is offered at no additional cost for all PowerEdge servers with ProSupport or higher contracts.
When power data is collected in CloudIQ, advanced AI algorithms process this data and automatically flag whether the server power usage behavior is outside normal parameters, based on historic data from that particular server.
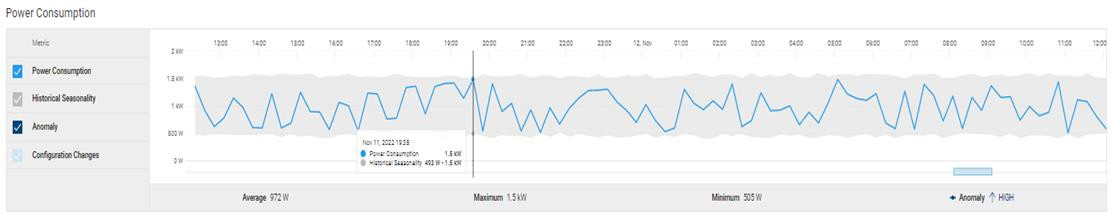
Fiure 6. individual server power data with historical seasonality – no anomaly
Multiple servers can be put onto the same graph, making it easy to identify any rogue behavior by individual servers.
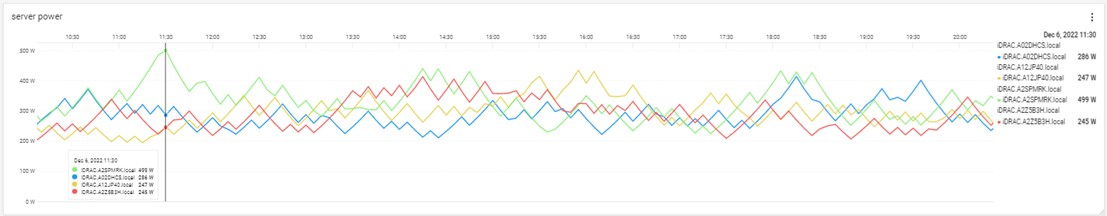
Figure 7. Multi server power usage report
The visualization of this data can be displayed from just hours to a whole year, with the ability to zoom in on a particular time.
Conclusion
Dell PowerEdge servers offer an extensive amount of data about power consumption by the advanced capabilities of the iDRAC. This power information is available on the iDRAC UI, as is telemetry information ready to be consumed by analytic solutions such as Splunk. This information is also accessible from the RACAMD CLI and RESTful API. Dell Technologies’ own one to many management solutions can also collect, collate, and report this information. Dell lets server admins select from a wide variety of tools and methodologies to meet the needs of their datacenter server power management requirements.
References
iDRAC
- Documentation, white papers and videos www.dell.com/support/idrac
- Transform datacenter analytics with iDRAC9 Telemetry Streaming
- iDRAC9 Telemetry Streaming Visualization with Splunk (a Tolly report)
- iDRAC Telemetry and Splunk Video Overview
- How to Integrate iDRAC9 Telemetry Data into the Splunk Platform
- Integrated Dell Remote Access Controller 9 - CLI Guide
OpenManage Enterprise Power Manager
- Documentation, white papers and videos Support for Power Manager
- Reduce Server Power Usage and Save Money with Power Manager
- Improve sustainability through energy insights (a Principled Technology study)
- Guide to OpenManage Enterprise Power Manager API
CloudIQ for PowerEdge
- Documentation, white papers and videos Support for CloudIQ For PowerEdge
- CloudIQ Provides Data Driven Server Management Decisions
GitHub for Dell Technologies, including iDRAC and OME/ Power Manager examples Dell Technologies · GitHub
API guide and landing page for developers including iDRAC & OME/ Power Manager https://developer.dell.com/

“Thermal Manage” Features and Benefits

Mon, 16 Jan 2023 17:06:35 -0000
|Read Time: 0 minutes
Summary
This Tech Note covers the features and benefits of using the “Thermal Manage” features within the iDRAC Datacenter license.
Introduction
With increasing server densities and the desire to maximize compute power per unit area at the datacenter level, there is an increasing need for better telemetry and controls related to power and thermals to manage and optimize data center efficiency.
“Thermal Manage” includes features of the iDRAC Datacenter license and provides key thermal telemetry and associated control features that facilitate deployment and customization challenges.
Thermal Manage – Feature Overview
Thermal Manage allows customers to customize the thermal operation of their PowerEdge servers with the following benefits:
- Optimize server-related power and cooling efficiencies across their datacenters.
- Integrates seamlessly with OpenManage Enterprise Power Manager for optimized management experience.
- Provides a state-of-the-art PCIe cooling management dashboard.
Represented in the following diagram (See figure 1) and listed below is a summary of the features and its utilities.
- System Airflow Consumption: Displays the real-time system airflow consumption (in CFM), allowing airflow balancing at rack and datacenter level.
- Custom Delta-T: Limit air temperature rise from inlet air to exhaust to right-size your infrastructure level cooling.
- Exhaust Temperature Control: Specify the temperature limit of the air exiting the server to match your datacenter needs.
- Custom PCIe inlet temperature: Choose the right input inlet temperature to match 3rd party device requirements.
- PCIe airflow settings: Provides a comprehensive PCIe device cooling view of the server and allows cooling customization of 3rd party cards.
Details and Use Cases
By default, Dell server thermal controls algorithm works to minimize system airflow consumption and maximize exhaust air temperature.
The higher the air exhaust temperature going into the HVAC (CRAC units) – the higher capacity they exhibit.
- It is directly proportional to the temperature difference between return air (exhaust) and the cooling coil for a given coil flow rate.
- This could result in lower CRAC capital costs if you can cool more with fewer CRAC units and an operational savings of cooling with less equipment.
Some customers, however, have challenges with high exhaust temperatures in the hot aisle, namely:
- Technicians don’t like the extra heat while working in the hot aisle.
- Components in the hot aisle (PDUs, cables, network switches) may have exceeded their ambient temperatures.
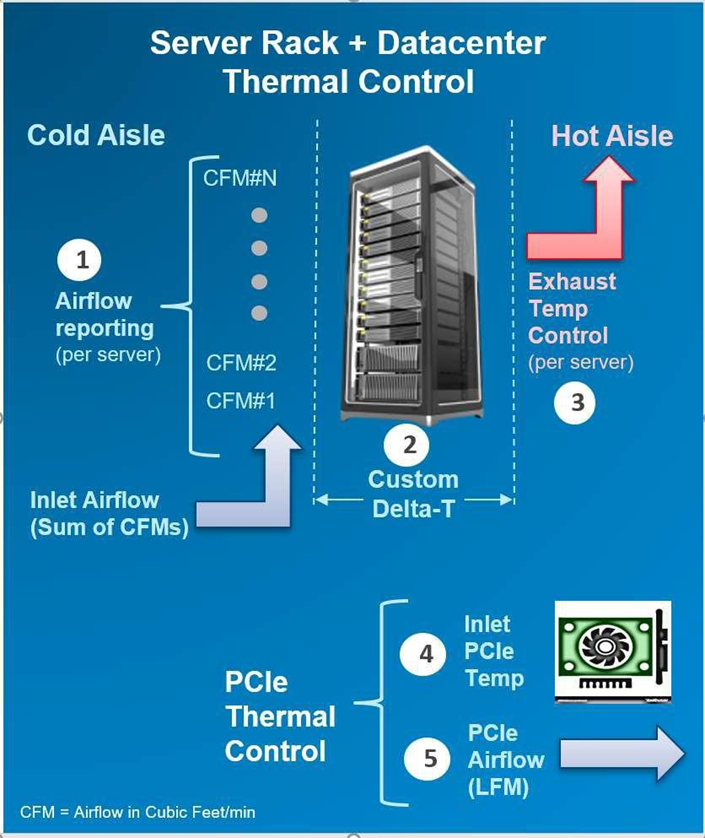
Figure 1 displays the features and its utilities.
In either case, we allow customization of this exhaust temperature via iDRAC interfaces.
Using the real-time airflow telemetry, a datacenter can create a good balance of airflow delivery vs. airflow demand at the server. A reduction in CFM also can be monetized on a dollar/CFM basis.
- In an example analysis using a 17 KW rack, a drop in CFM by 10% could result in capital savings (CRAC costs of $257/rack) and an annual operational savings of $93 per rack based on the typical energy cost and data center efficiencies assumed.
- However, the greater benefit is the potential ability to fit more racks on the floor (or more servers in a rack), if airflow balancing is achieved by closely matching the server/rack airflow consumption.
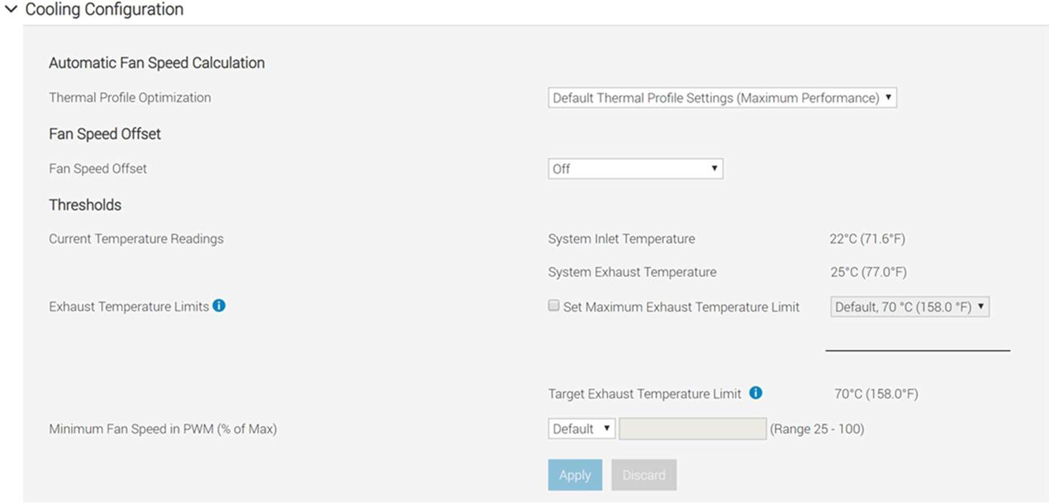
iDRAC Thermal Manage features require an iDRAC Datacenter license. Here is an image from the iDRAC GUI showing the thermal telemetry and customization options:
Deploying 3rd party PCIe cards in PowerEdge servers is a common practice. The PCIe airflow settings feature allows a better understanding of the cooling state of the PCIe devices. This helps customers protect their high-value PCIe card with the right amount of cooling. Additionally, this optimizes system airflow, which ties into the earlier point of data center airflow management.
By default, the presence of a 3rd party card may cause the system fan speeds to increase based on internal algorithms. However, this additional cooling may be more or less than required and hence the need for allowing customers to customize airflow delivery to their custom card.
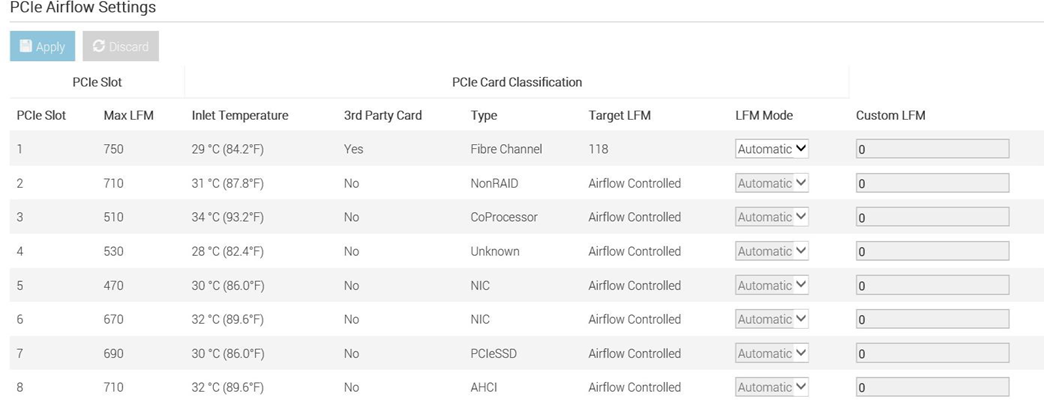
In the iDRAC GUI under PCIe Airflow Settings (Dashboard » System » Overview » Cooling » Configure Cooling – see example snapshot below), the system displays high-level cooling details for each slot in which a card is present. It also displays the max airflow capability of each slot. This airflow information is provided in units of LFM (Linear Feet per Minute), which is industry standard for defining the airflow needs for a card. Only for the 3rd Party Card, customers can see min LFM value delivered to the card and either disable the custom cooling response for that card or disable and then set custom LFM value desired (based on card vendor specifications).
NOTE: For Dell standard devices, the correct power and cooling requirements are part of the iDRAC code, which allows for the appropriate airflow.
In Conclusion
Thermal Manage features within the iDRAC Datacenter provides industry-leading custom thermal control options that provides valuable custom cooling and efficiency optimization options for both the system and data center level.