


Value Optimized AX-6515 for ROBO Use Cases
Introduction
Small offices and remote branch office (ROBO) use cases present special challenges for IT organizations. The issues tend to revolve around how to implement a scalable, resilient, secure, and highly performant platform at an affordable TCO. The infrastructure must be capable enough to efficiently run a highly diversified portfolio of applications and services and yet be simple to deploy, update, and support by a local IT generalist. Dell Technologies and Microsoft help you accelerate business outcomes in these unique ROBO environments with our Dell EMC Solutions for Microsoft Azure Stack HCI.
In this blog post, we share VMFleet results observed in the Dell Technologies labs for our newest AX-6515 two-node configuration – ideal for ROBO environments. Optimized for value, the small but powerful AX-6515 node packs a dense, single-socket 2nd Gen AMD EPYC processor in a 1RU chassis delivering peak performance and excellent TCO. We also included the Dell EMC PowerSwitch S5212F-ON in our testing to provide 25GbE network connectivity for the storage, management, and VM traffic in a small form factor. The Dell EMC Solutions for Azure Stack HCI Deployment Guide was followed to construct the test lab and applies only to infrastructure that is built with validated and certified AX nodes running Microsoft Windows Server 2019 Datacenter from Dell Technologies.
We were quite impressed with the VMFleet results. First, we stressed the cluster’s storage subsystem to its limits using scenarios aimed at identifying maximum IOPS, latency, and throughput. Then, we adjusted the test parameters to be more representative of real-world workloads. The following summary of findings indicated to us that this two-node, AMD-based, all-flash cluster could meet or exceed the performance requirements of workload profiles often found in ROBO environments:
- Achieved over 1 million IOPS at microsecond latency using a 4k block size and 100% random-read IO pattern.
- Achieved over 400,000 IOPS at 4 millisecond latency using a 4k block size and 100% random-write IO pattern.
- Using 512k block sizes, drove 6 GB/s and 12 GB/s throughput for 100% sequential-write and 100% sequential-read IO patterns, respectively.
- Using a range of real-world scenarios, the cluster achieved hundreds of thousands of IOPS at under 7 milliseconds latency and drove between 5 – 12 GB/s of sustained throughput.
Lab Setup
The following diagram illustrates the environment created in the Dell Technologies labs for the VMFleet testing. Ancillary services required for cluster operations such as DNS, Active Directory, and a file server for cluster quorum are not depicted.
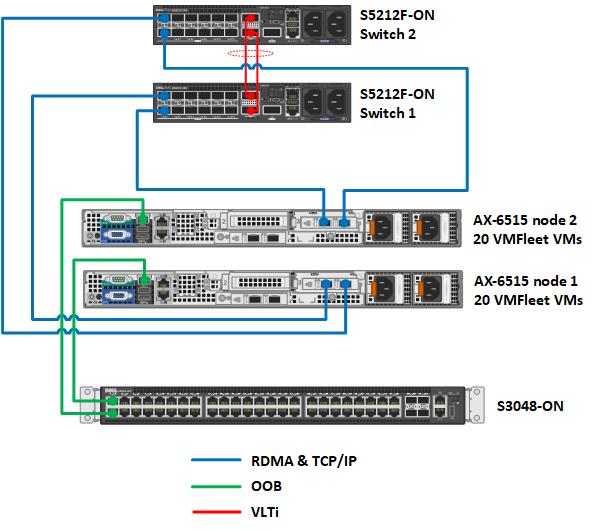
Figure 1 Network topology
Table 1 Cluster configuration
Cluster Design Elements | Description |
Number of cluster nodes | 2 |
Cluster node model | AX-6515 nodes |
Number of network switches for RDMA and TCP/IP traffic | 2 |
Network switch model | Dell EMC PowerSwitch S5212F-ON |
Network topology | Fully-converged network configuration. RDMA and TCP/IP traffic traversing 2 x 25GbE network connections from each host. |
Network switch for OOB management | Dell EMC PowerSwitch S3048-ON |
Resiliency option | Two-way mirror |
Usable storage capacity | Approximately 12 TB |
Table 2 Cluster node resources
Resources per Cluster Node | Description |
CPU | Single-socket AMD EPYC 7702P 64-Core Processor |
Memory | 256 GB DDR4 RAM |
Storage controller for OS | BOSS-S1 adapter card |
Physical drives for OS | 2 x Intel 240 GB M.2 SATA drives configured as RAID 1 |
Storage controller for Storage Spaces Direct (S2D) | HBA330 Mini |
Physical drives | 8 x 1.92 TB Mixed Use KIOXIA SAS SSDs |
Network adapter | Mellanox ConnectX-5 Dual Port 10/25GbE SFP28 Adapter |
Operating System | Windows Server 2019 Datacenter |
The architectures of Azure Stack HCI solutions are highly opinionated and prescriptive. Each design is extensively tested and validated by Dell Technologies Engineering. Here is a summary of the key quality attributes that define these architectures followed by a section devoted to our performance findings.
- Efficiency – Many customers are interested in improving performance and gaining efficiencies by modernizing their aging virtualization platforms with HCI. Using Azure Stack HCI helps avoid a DIY approach to IT infrastructure, which is prone to human error and is more labor intensive.
- Maintainability – Our solution makes it simple to incorporate hybrid capabilities to reduce operational burden using Microsoft Windows Admin Center (WAC). Services in Azure can also be leveraged to avoid additional on-premises investments for management, monitoring, BCDR, security, and more. We have also developed the Dell EMC OpenManage Integration with Microsoft Windows Admin Center to assist with hardware monitoring and to simplify updates with Cluster Aware Updates (CAU).
- Availability – Using a two-way mirror, we always have two copies of our data. This configuration can survive a single drive failure in one node or survive an entire node failure. However, the cluster cannot survive two failures simultaneously on both nodes. In case greater resiliency is desired, volumes can be created using nested resiliency. Nested resiliency is discussed in more detail in the "Optional modifications to the architecture" section later in this blog post.
- Supportability – Support is provided by dedicated Dell Technologies ProSupport Plus and ProSupport for Software technicians who have expertise specifically tailored to Azure Stack HCI solutions.
Testing Results
We leveraged VMFleet to benchmark the storage subsystem of our 2-node cluster. Many Microsoft customers and partners rely on this tool to help them stress test their Azure Stack HCI clusters. VMFleet consists of a set of PowerShell scripts that deploy virtual machines to a Hyper-V cluster and execute Microsoft’s DiskSpd within those VMs to generate IO. The following table presents the range of VMFleet and DiskSpd parameters used during our testing in the Dell Technologies labs.
Table 3 Test parameters
VMFleet and DiskSpd Parameters | Values |
Number of VMs running per node | 20 |
vCPUs per VM | 2 |
Memory per VM | 8 GB |
VHDX size per VM | 40 GB |
VM Operating System | Windows Server 2019 |
0 | |
Block sizes (B) | 4k – 512k |
Thread count (T) | 2 |
Outstanding IOs (O) | 32 |
Write percentages (W) | 0, 20, 50, 100 |
IO patterns (P) | Random, Sequential |
We first selected DiskSpd scenarios aimed at identifying the maximum IOPS, latency, and throughput thresholds of the cluster. By pushing the limits of the storage subsystem, we confirmed that the networking, compute, operating systems, and virtualization layer were configured correctly according to our Deployment Guide and Network Integration and Host Network Configuration Options guide. This also ensured that that no misconfiguration occurred during initial deployment that could skew the real-world storage performance results. Our results are depicted in Table 4.
Table 4 Maximums test results
Scenario | Parameter Values Explained | Performance Metric |
B4-T2-O32-W0-PR | Block size: 4k Thread count: 2 Outstanding IO: 32 IO pattern: 100% random read | IOPS: 1,146,948 Read latency: 245 microseconds CPU utilization: 48% |
B4-T2-O32-W100-PR | Block size: 4k Thread count: 2 Outstanding IO: 32 IO pattern: 100% random write | IOPS: 417,591 Write latency: 4 milliseconds CPU utilization: 25% |
B512-T2-O2-W0-PSI | Block size: 512k Thread count: 2 Outstanding IO: 8 IO pattern: 100% sequential read | Throughput: 12 GB/s |
B512-T2-O2-W100-PSI | Block size: 512k Thread count: 2 Outstanding IO: 8 IO pattern: 100% sequential write | Throughput: 6 GB/s |
We then stressed the storage subsystem using IO patterns more reflective of the types of workloads found in a ROBO use case. These applications are typically characterized by smaller block sizes, random I/O patterns, and a variety of read/write ratios. Examples include general enterprise and small office LOB applications and OLTP workloads. The testing results in Figure 2 below indicate that the cluster has the potential to accelerate OLTP workloads and make enterprise applications highly responsive to end users.
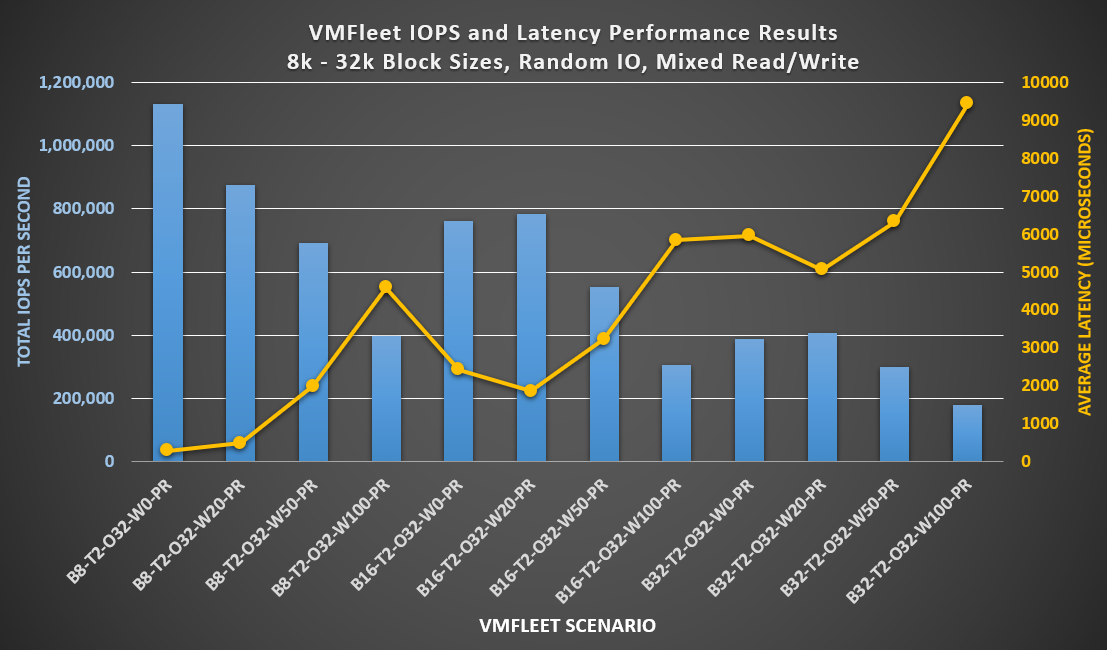
Figure 2 Performance results with smaller block sizes
Other services like backups, streaming video, and large dataset scans have larger block sizes and sequential IO patterns. With these workloads, throughput becomes the key performance indicator to analyze. The results shown in the following graph indicate an impressive sustained throughput that can greatly benefit this category of IT services and applications.
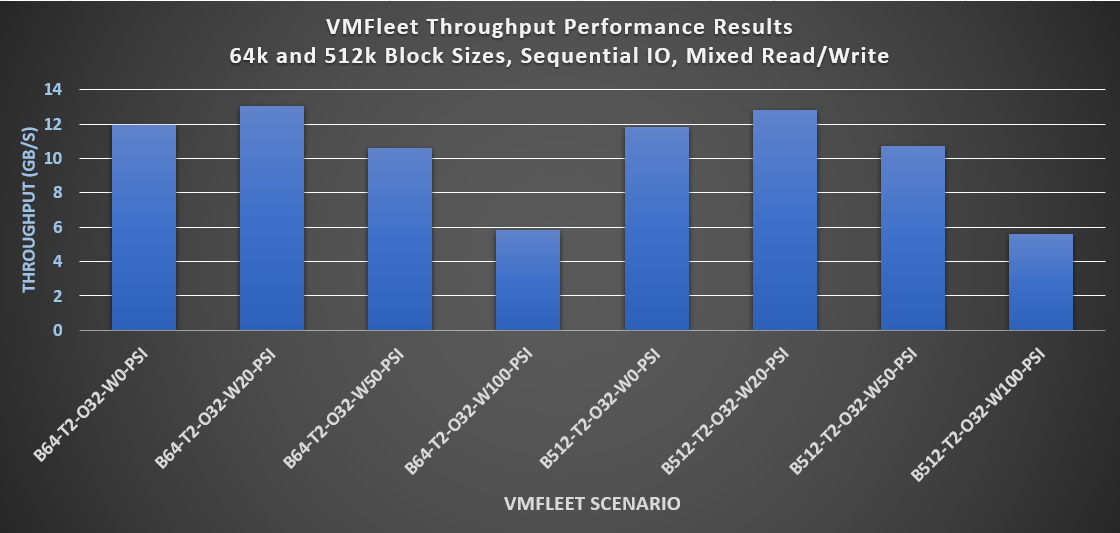
Figure 3 Performance results with larger block sizes
Optional modifications to the architecture
Customers could make modifications to the lab configuration to accommodate different requirements in the ROBO use case. For example, Dell Technologies completely supports a dual-link full mesh topology for Azure Stack HCI. This non-converged storage switchless topology eliminates the need for network switches for storage communications and enables you to use existing infrastructure for management and VM traffic. This approach will result in similar or improved performance metrics versus those mentioned in this blog due to the 2 x 25 GB direct connections between the nodes and the isolation of the storage traffic on these dedicated connections.
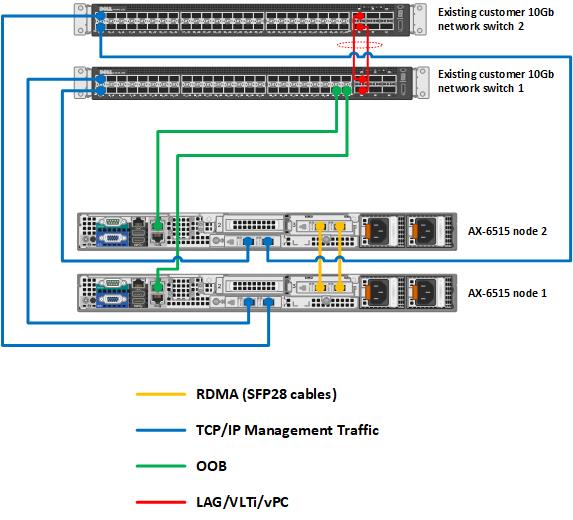
Figure 4 Two-node back-to-back architecture option
There may be situations in ROBO scenarios where there are no IT generalists near the site to address hardware failures. When a drive or entire node fails, it may take days or weeks before someone can service the nodes and return the cluster to full functionality. Consider nested resiliency instead of two-way mirroring to handle multiple failures on a two-node cluster. Inspired by RAID 5 + 1 technology, workloads remain online and accessible even in the following circumstances:
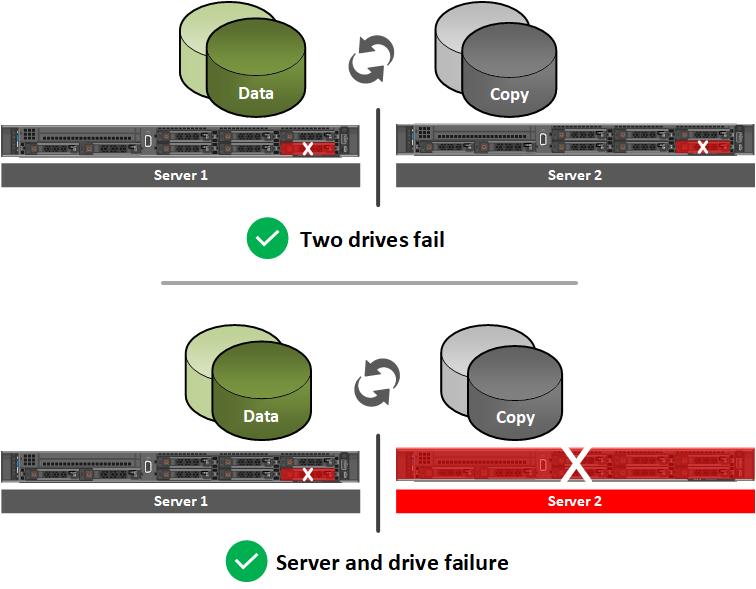
Figure 5 Nested resiliency option
Be aware that there is a capacity efficiency cost when using nested resiliency. Two-way mirroring is 50% efficient, meaning 1 TB of data takes up 2 TB of physical storage capacity. Depending on the type of nested resiliency you choose to configure, capacity efficiency can range between 25% - 40%. Therefore, ensure you have an adequate amount of raw storage capacity if you intend to use this technology. Performance is also going to be affected when using nested resiliency – especially on workloads with a higher percentage of write IO since more copies of the data need to be maintained on the cluster.
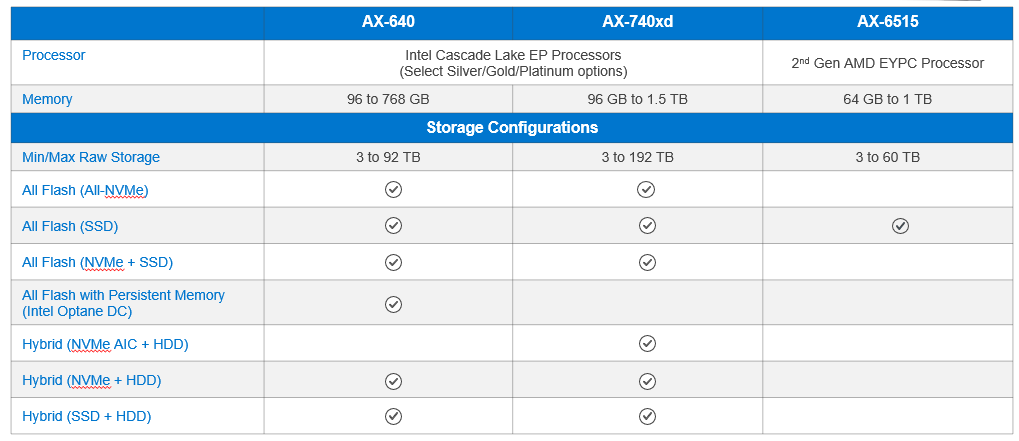
If you need greater flexibility in cluster resources, Dell Technologies offers Azure Stack HCI configurations to meet any workload profile and business requirement. The table below shows the different resource options available for each AX node. To find more detailed specifications about these configurations, please review the detailed product specifications on our product page.
Table 5 Azure Stack HCI configuration options
Visit our website for more details on Dell EMC Solutions for Azure Stack HCI.
Related Blog Posts

Boost Performance on Dell EMC HCI Solutions for Microsoft Server using Intel Optane Persistent Memory
Wed, 16 Jun 2021 13:35:49 -0000
|Read Time: 0 minutes
Modern IT applications have a broad range of performance requirements. Some of the most demanding applications use Online Transactional Processing (OLTP) database technology. Typical organizations have many mission critical business services reliant on workloads powered by these databases. Examples of such services include online banking in the financial sector and online shopping in the retail sector. If the response time of these systems is slow, customers will likely suffer a poor user experience and may take their business to competitors. Dissatisfied customers may also express their frustration through social media outlets resulting in incalculable damage to a company’s reputation.
The challenge in maintaining an exceptional consumer experience is providing databases with performant infrastructure while also balancing capacity and cost. Traditionally, there have been few cost-effective options that cache database workloads, which would greatly improve end-user response times. Intel Optane persistent memory (Intel Optane PM) offers an innovative path to accelerating database workloads. Intel Optane PM performs almost as well as DRAM, and the data is preserved after a power cycle. We were interested in quantifying these claims in our labs with Dell EMC HCI Solutions for Microsoft Windows Server.
Windows Server HCI running Microsoft Windows Server 2019 provides industry-leading virtual machine performance with Microsoft Hyper-V and Microsoft Storage Spaces Direct technology. The platform supports Non-Volatile Memory Express (NVMe), Intel Optane PM, and Remote Direct Memory Access (RDMA) networking. Windows Server HCI is a fully productized, validated, and supported HCI solution that enables enterprises to modernize their infrastructure for improved application uptime and performance, simplified management and operations, and lower total cost of ownership. AX nodes from Dell EMC, powered by industry-leading PowerEdge server platforms, offer a high-performance, scalable, and secure foundation on which to build a software-defined infrastructure.
In our lab testing, we wanted to observe the impact on performance when Intel Optane PM was added as a caching tier to a Windows Server HCI cluster. We set up two clusters to compare. One cluster was configured as a two-tier storage subsystem with Intel Optane PM in the caching tier and SATA Read-Intensive SSDs in the capacity tier. We inserted 12 x 128 GB Intel Optane PM modules into this cluster for a total of 1.5 TB per node. The other cluster’s storage subsystem was configured as a single-tier of SATA Read-Intensive SSDs. With respect to CPU selection, memory, and Ethernet adapters, the two clusters were configured identically.
Only the Dell EMC AX-640 nodes currently accommodate Intel Optane PM. The clusters were configured as follows:
Cluster Resources | Without Intel Optane PM | With Intel Optane PM |
Number of nodes | 4 | 4 |
CPU | 2 x Intel 6248 CPU @ 2.50 GHz (3.90 GHz with TurboBoost) | 2 x Intel 6248 CPU @ 2.50 GHz (3.90 GHz with TurboBoost) |
Memory | 384 GB RAM | 384 GB RAM |
Disks | 10 x 2.5 in. 1.92 TB Intel S4510 RI SATA SSD | 10 x 2.5 in. 1.92 TB Intel S4510 RI SATA SSD |
NICs | Mellanox ConnectX-5 EX Dual Port 100 GbE | Mellanox ConnectX-5 EX Dual Port 100 GbE |
Persistent memory | None | 12 x 128 GB Intel Optane PM per node |
Volumes were created using three-way mirroring for the best balance between performance and resiliency. Three-way mirroring protects data by enabling the cluster to safely tolerate two hardware failures. For example, data on a volume would be successfully preserved even after the simultaneous loss of an entire node and a drive in another node.
Intel Optane PM has two operating modes – Memory Mode and App Direct Mode. Our tests used App Direct Mode. In App Direct Mode, the operating system uses Intel Optane PM as persistent memory distinct from DRAM. This mode enables extremely high performing storage that is byte-addressable-like, memory coherent, and cache coherent. Cache coherence is important because it ensures that data is a uniformly shared resource across all nodes. In the four-node Windows Server HCI cluster, cache coherence ensured that when data was read or written from one node that the same data was available across all nodes.
VMFleet is a storage load generation tool designed to perform I/O and capture performance metrics for Microsoft failover clusters. For the small block test, we used VMFleet to generate 100 percent reads at a 4K block size. The baseline configuration without Intel Optane PM sustained 2,103,412 IOPS at 1.5-millisecond (ms) average read latency. These baseline performance metrics demonstrated outstanding performance. However, OLTP databases target 1 ms or less latency for reads.
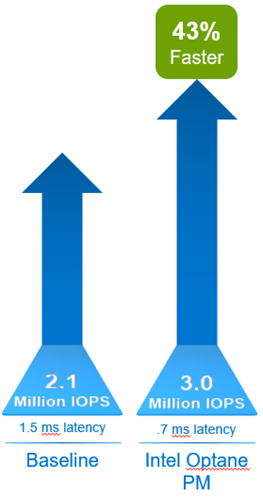
Comparatively, the Intel Optane PM cluster demonstrated 43 percent faster IOPS and decreased latency by 53 percent. Overall, this cluster sustained slightly over 3 million IOPS at .7 ms average latency. Benefits include:
- Significant performance improvement in IOPS means transactional databases and similar workloads will improve in scalability.
- Applications reading from storage will receive data faster, thus improving transactional response times.
- Intel Optane PM coherent cache provides substantial performance benefits without sacrificing availability.
When exploring storage responsiveness, testing large block read and write requests is also important. Data warehouses and decision-support systems are examples of workloads that read larger blocks of data. For this testing, we used 512 KB block sizes and sequential reads as part of the VMFleet testing. This test provided insight into the ability of Intel Optane PM cache to improve storage system throughput.
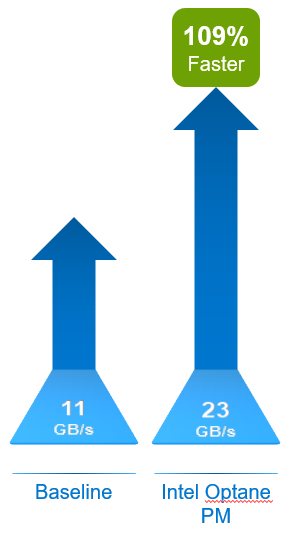
The cluster populated with Intel Optane PM was 109% faster than the baseline system. Our comparisons of 512 KB sequential reads found total throughput of 11 GB/s for the system without Intel Optane PM and 23 GB/s for the system with Intel Optane PM caching. Benefits include:
- Greater throughput enables faster scans of data for data warehouse systems, decision-support systems, and similar workloads.
- The benefit to the business is faster reporting and analytics.
- Intel Optane PM coherent cache provides substantial throughput benefits without sacrificing availability.
Overall, the VMFleet tests were impressive. Both Windows Server HCI configurations had 40 SSDs across the four nodes for approximately 76 TB of performant storage. To accelerate the entire cluster required 12 Intel Optane PM 128 GB modules per server for a total of 48 modules across the four nodes. Test results show that both OLTP and data-warehouse type workloads would exhibit significant performance improvements.
Testing 100 percent reads of 4K blocks showed:
- 43 percent performance improvement in IOPS.
- 53 percent decrease in average read latency.
- Improved scaling and faster transaction processing. Overall, application performance would be significantly accelerated, improving end-user experience.
Testing 512 KB sequential reads showed:
- 109 percent increased throughput.
- Faster reporting and faster time to analytics and data insights.
The configuration presented in this lab testing scenario will not be appropriate for every application. Any Windows Server HCI solution must be properly scoped and sized to meet or exceed the performance and capacity requirements of its intended workloads. Work with your Dell Technologies account team to ensure that your system is correctly configured for today’s business challenges and ready for expansion in the future. To learn more about Microsoft HCI Solutions from Dell Technologies, visit our Info Hub page.
GPU-Accelerated AI and ML Capabilities
Mon, 14 Dec 2020 15:37:06 -0000
|Read Time: 0 minutes
Dell EMC Integrated System for Microsoft Azure Stack Hub has been extending Microsoft Azure services to customer-owned data centers for over three years. Our platform has enabled organizations to create a hybrid cloud ecosystem that drives application modernization and to address business concerns around data sovereignty and regulatory compliance.
Dell Technologies, in collaboration with Microsoft, is excited to announce upcoming enhancements that will unlock valuable, real-time insights from local data using GPU-accelerated AI and ML capabilities. Actionable information can be derived from large on-premises data sets at the intelligent edge without sacrificing security.
Partnership with NVIDIA
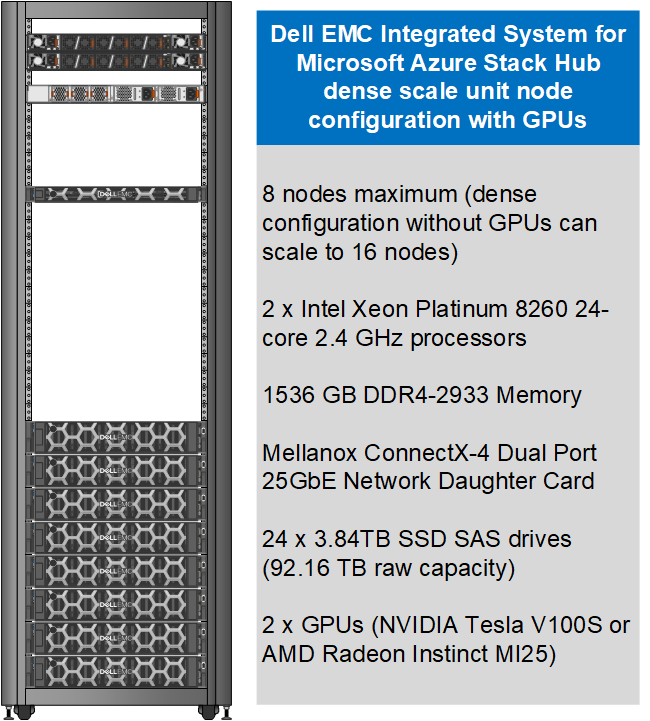
Today, customers can order our Azure Stack Hub dense scale unit configuration with NVIDIA Tesla V100S GPUs for running compute-intensive AI processes like inferencing, training, and visualization from virtual machine or container-based applications. Some customers choose to run Kubernetes clusters on their hardware-accelerated Azure Stack Hub scale units to process and analyze data sent from IoT devices or Azure Stack Edge appliances. Powered by the Dell EMC PowerEdge R840 rack server, these NVIDIA Tesla V100S GPUs use Discrete Device Assignment (DDA), also known as GPU pass-through, to dedicate one or more GPUs to an Azure Stack Hub NCv3 VM.
The following figure illustrates the resources installed in each GPU-equipped Azure Stack Hub dense configuration scale unit node.
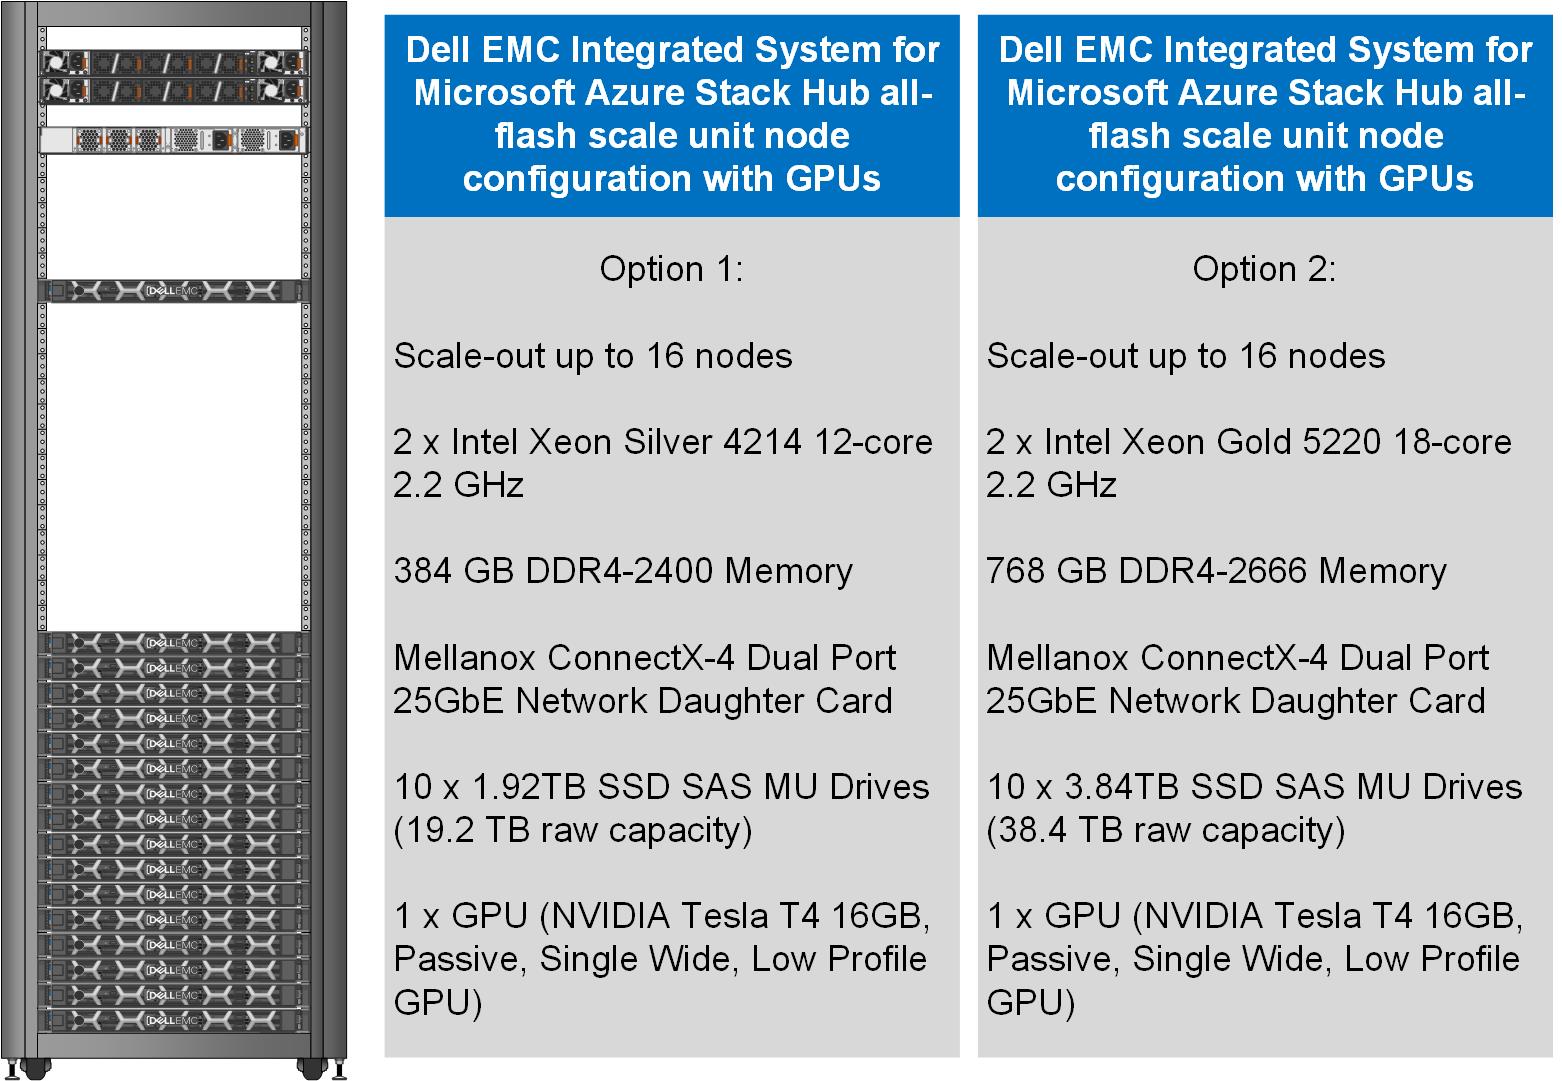
This month, our Dell EMC Azure Stack Hub release 2011 will also support the NVIDIA T4 GPU – a single-slot, low-profile adapter powered by NVIDIA Turing Tensor Cores. These GPUs are perfect for accelerating diverse cloud-based workloads, including light machine learning, inference, and visualization. These adapters can be ordered with Dell EMC Azure Stack Hub all-flash scale units powered by Dell EMC PowerEdge R640 rack servers. Like the NVIDIA Tesla V100S, these GPUs use DDA to dedicate one adapter’s powerful capabilities to a single Azure Stack Hub NCas_v4 VM. A future Azure Stack Hub release will also enable GPU partitioning on the NVIDIA T4.
The following figure illustrates the resources installed in each GPU-equipped Azure Stack Hub all-flash configuration scale unit node.
Partnership with AMD
We are also pleased to announce a partnership with AMD to deliver GPU capabilities in our Dell EMC Integrated System for Microsoft Azure Stack Hub. Available today, customers can order our dense scale unit configuration with AMD Radeon Instinct MI25 GPUs aimed at graphics intensive visualization workloads like simulation, CAD applications, and gaming. The MI25 uses GPU partitioning (GPU-P) technology to allow users of an Azure Stack Hub NVv4 VM to consume only a portion of the GPU’s resources based on their workload requirements.
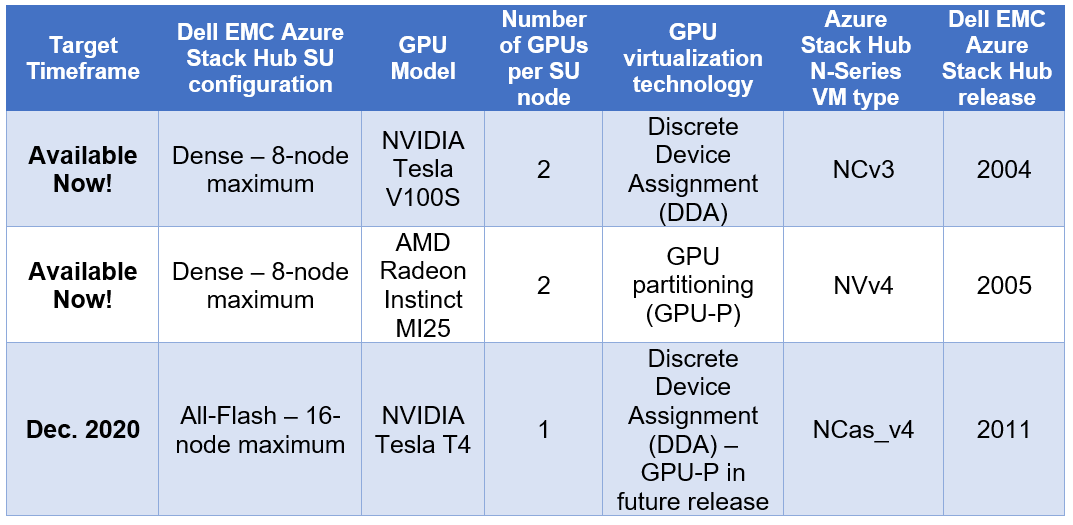
The following table is a summary of our hardware acceleration capabilities.
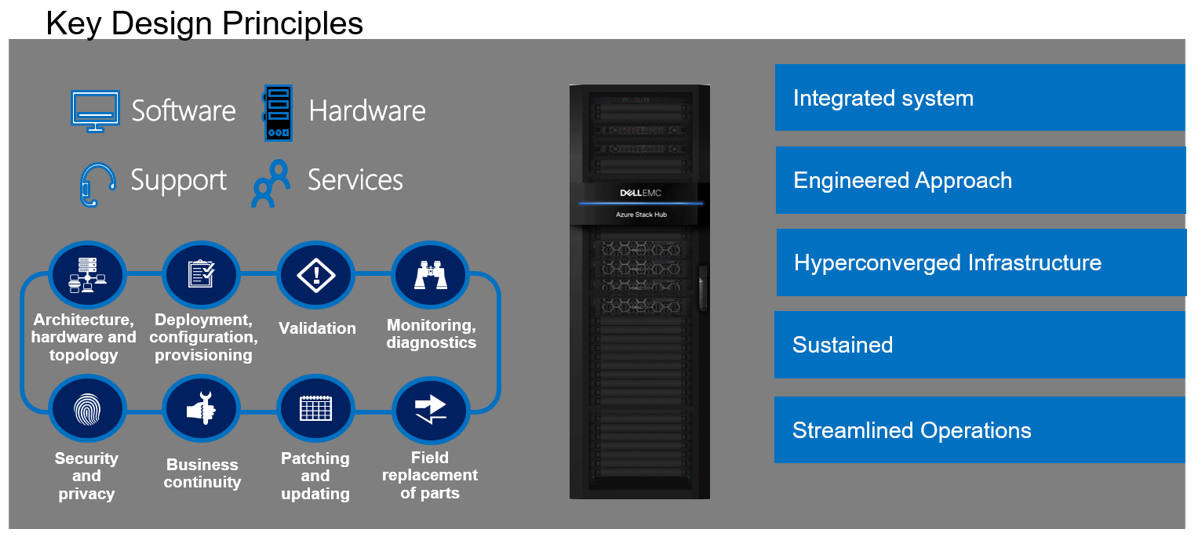
An engineered approach
Following our stringent engineered approach, Dell Technologies goes far beyond considering GPUs as just additional hardware components in the Dell EMC Integrated System for Microsoft Azure Stack Hub portfolio. We apply our pedigree as leaders in appliance-based solutions to the entire lifecycle of all our scale unit configurations. The dense and all-flash scale unit configurations with integrated GPUs are designed to follow best practices and use cases specifically with Azure-based workloads, rather than workloads running on traditional virtualization platforms. Dell Technologies is also committed to ensuring a simplified experience for initial deployment, patch and update, support, and streamlined operations and monitoring for these new configurations.
Additional considerations
There are a couple of additional details worth mentioning about our new Azure Stack Hub dense and all-flash scale unit configurations with hardware acceleration:
- The use of the GPU-backed N-Series VMs in Azure Stack Hub for compute-intensive AI and ML workloads is still in preview. Dell Technologies is very interested in speaking with customers about their use cases and workloads supported by this configuration. Please contact us at mhc.preview@dell.com to speak with one of our engineering technologists.
- The Dell EMC Integrated System for Microsoft Azure Stack Hub configurations with GPUs can be delivered fully racked and cabled in our Dell EMC rack. Customers can also elect to have the scale unit components re-racked and cabled in their own existing cabinets with the assistance of Dell Technologies Services.
Resources for further study
- At the time of publishing this blog post, only the NCv3 and NVv4 VMs are available in the Azure Stack Hub marketplace. The NCas_v4 currently is not visible in the portal. Please proceed to the Azure Stack Hub User Documentation for more information on these VM sizes.
- Customers may want to explore the Train Machine Learning (ML) model at the edge design pattern in the Azure Hybrid Documentation. This may prove to be a good starting point for putting this technology to work for their organization.
- Customers considering running AI and ML workloads on Dell EMC Integrated System for Microsoft Azure Stack Hub can also greatly benefit from storage-as-a-service with Dell EMC PowerScale. PowerScale can help enable faster training and validation of AI models, improve model accuracy, drive higher GPU utilization, and increase data science productivity. Visit Artificial Intelligence with Dell EMC PowerScale for more information.