


Supercharge Inference Performance at the Edge using the Dell EMC PowerEdge XE2420 (June 2021 revision)
Mon, 07 Jun 2021 13:42:14 -0000
|Read Time: 0 minutes
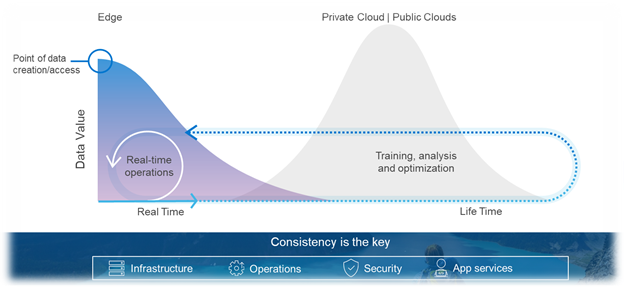
Deployment of compute at the Edge enables the real-time insights that inform competitive decision making. Application data is increasingly coming from outside the core data center (“the Edge”) and harnessing all that information requires compute capabilities outside the core data center. It is estimated that 75% of enterprise-generated data will be created and processed outside of a traditional data center or cloud by 2025.[1]
This blog demonstrates the high power-performance potential of the Dell EMC PowerEdge XE2420, an edge-friendly, short-depth server. Utilizing up to four NVIDIA T4 GPUs, the XE2420 can perform AI inference operations faster while efficiently managing power-draw. The XE2420 is capable of classifying images at 23,309 images/second while drawing an average of 794 watts, all while maintaining its equal performance with other conventional rack servers.
XE2420 Features and Capabilities
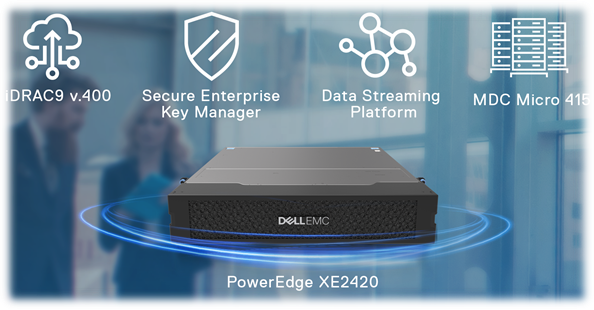
The Dell EMC PowerEdge XE2420 is a 16” (400mm) deep, high-performance server that is purpose-built for the Edge. The XE2420 has features that provide dense compute, simplified management and robust security for harsh edge environments.

- Built for performance: Powerful 2U, two-socket performance with the flexibility to add up to four accelerators per server and a maximum local storage of 132TB.
- Designed for harsh edge environments: Tested to Network Equipment-Building System (NEBS3) guidelines, with extended operating temperature tolerance of 5˚-45˚C, and an optional filtered bezel to guard against dust. Short depth for edge convenience and lower latency.
- Integrated security and consistent management: Robust, integrated security with cyber-resilient architecture, and the new iDRAC9 with Datacenter management experience. Front accessible and cold-aisle serviceable for easy maintenance.
- Power efficiency: High-end capacity supporting 2x 2000W AC PSUs or 2x 1100W DC PSUs to support demanding configurations, while maintaining efficient operation minimizing power draw
The XE2420 allows for flexibility in the type of GPUs you use in order to accelerate a wide variety of workloads including high-performance computing, deep learning training and inference, machine learning, data analytics, and graphics. It can support up to 2x NVIDIA V100/S PCIe, 2x NVIDIA RTX6000, or up to 4x NVIDIA T4.
Edge Inferencing with the T4 GPU
The NVIDIA T4 is optimized for mainstream computing environments and uniquely suited for Edge inferencing. Packaged in an energy-efficient 70-watt, small PCIe form factor, it features multi-precision Turing Tensor Cores and RT Cores to deliver power efficient inference performance. Combined with accelerated containerized software stacks from NGC, the XE2420 combined with NVIDIA T4s is a powerful solution to deploy AI application at scale on the edge.
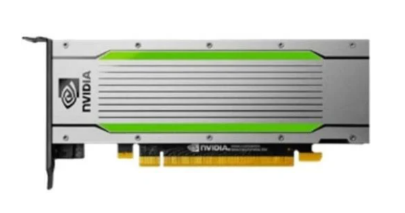
Fig 1: NVIDIA T4 Specifications
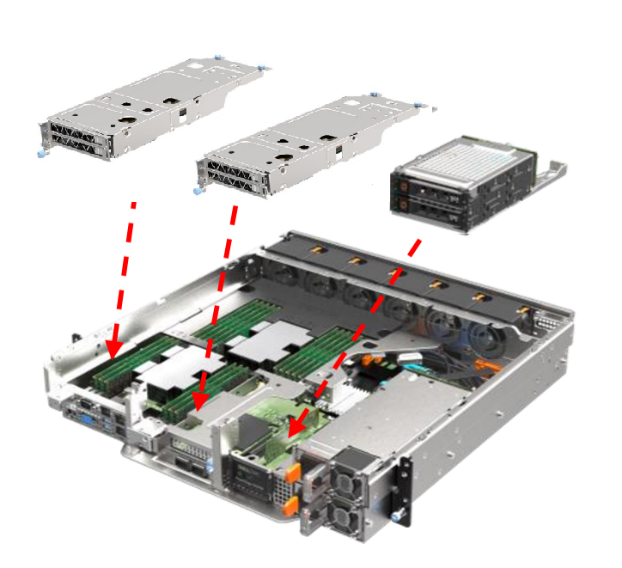
Fig 2: Dell EMC PowerEdge XE2420 w/ 4x T4 & 2x 2.5” SSDs
Dell EMC PowerEdge XE2420 MLPerf™ Inference v1.0 Tested Configuration
Processors | 2x Intel Xeon Gold 6252 CPU @ 2.10GHz |
Storage
| 1x 2.5" SATA 250GB |
1x 2.5" NVMe 4TB | |
Memory | 12x 32GB 2666MT/s DDR4 DIMM |
GPUs | 4x NVIDIA T4 |
OS | Ubuntu 18.04.4 |
Software
| TensorRT 7.2.3 |
CUDA 11.1 | |
cuDNN 8.1.1 | |
Driver 460.32.03 | |
DALI 0.30.0 | |
Hardware Settings | ECC on |
Inference Use Cases at the Edge
As computing further extends to the Edge, higher performance and lower latency become vastly more important in order to increase throughput, while decreasing response time and power draw. One suite of diverse and useful inference workload benchmarks is the MLPerf™ suite from MLCommons™. MLPerf™ Inference demonstrates performance of a system under a variety of deployment scenarios, aiming to provide a test suite to enable balanced comparisons between competing systems along with reliable, reproducible results.
The MLPerf™ Inference v1.0 suite covers a variety of workloads, including image classification, object detection, natural language processing, speech-to-text, recommendation, and medical image segmentation. Specific datacenter scenarios covered include “offline”, which represents batch processing applications such as mass image classification on existing photos, and “Server”, which represents an application where query arrival is random, and latency is important. An example of server is any consumer-facing website where a consumer is waiting for an answer to a question. For MLPerf™ Inference v1.0, we also submitted using the edge scenario of “SingleStream”, representing an application that delivers single queries in a row, waiting to deliver the next only when the first is finished; latency is important to this scenario. One example of SingleStream is smartphone voice transcription: Each word is rendered as it spoken, and the second word does not render the next until the first is done. Many of these workloads are directly relevant to Telco & Retail customers, as well as other Edge use cases where AI is becoming more prevalent.
MLPerf™ Inference v1.0 now includes power benchmarking. This addition allows for measurement of power draw under active test for any of the benchmarks, which provide accurate and precise power metrics across a range of scenarios, and is accomplished by utilization of the proprietary measurement tool belonging to SPECPower – PTDaemon®. SPECPower is an industry-standard benchmark built to measure power and performance characteristics of single or multi-node compute servers. Dell EMC regularly submits PowerEdge systems to SPECPower to provide customers the data they need to effectively plan server deployment. The inclusion of comparable power benchmarking to MLPerf™ Inference further emphasizes Dell’s commitment to customer needs.
Measuring Inference Performance using MLPerf™
We demonstrate inference performance for the XE2420 + 4x NVIDIA T4 accelerators across the 6 benchmarks of MLPerf™ Inference v1.0 with Power v1.0 in order to showcase the workload versatility of the system. Dell tuned the XE2420 for best performance and measured power under that scenario to showcase the optimized NVIDIA T4 power cooling algorithms. The inference benchmarking was performed on:
- Offline, Server, and SingleStream scenarios at 99% accuracy for ResNet50 (image classification), RNNT (speech-to-text), and SSD-ResNet34 (object detection), including power
- Offline and Server scenarios at 99% and 99.9% for DLRM (recommendation), including power
- Offline and SingleStream scenario at 99% and 99.9% accuracy for 3D-Unet (medical image segmentation)
These results and the corresponding code are available at the MLPerf™ website. We have submitted results to both the Datacenter[2] & the Edge suites[3].
Key Highlights
At Dell, we understand that performance is critical, but customers do not want to compromise quality and reliability to achieve maximum performance. Customers can confidently deploy inference workloads and other software applications with efficient power usage while maintaining high performance, as demonstrated below.
The XE2420 is a compact server that supports 4x 70W NVIDIA T4 GPUs in an efficient manner, reducing overall power consumption without sacrificing performance. This high-density and efficient power-draw lends it increased performance-per-dollar, especially when it comes to a per-GPU performance basis.
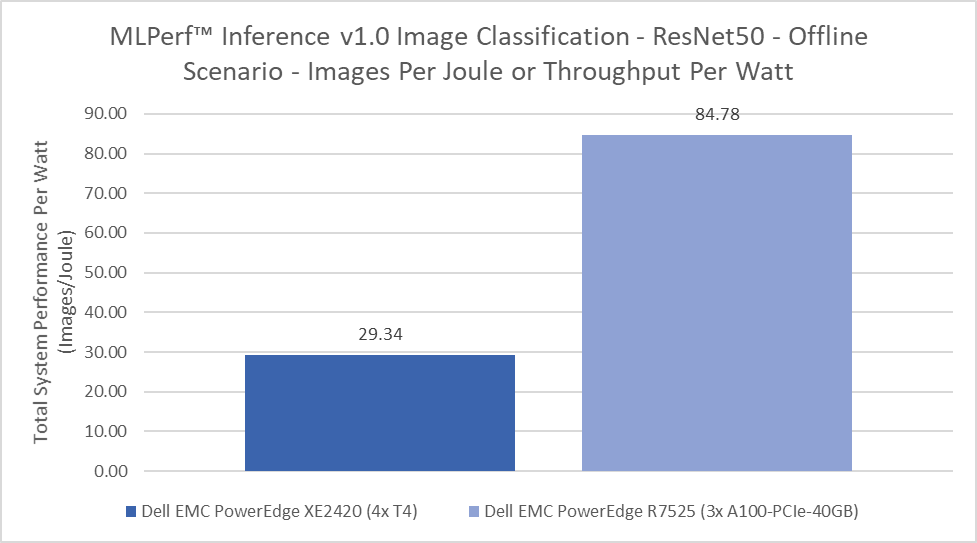
Dell is a leader in the new addition of MLPerf™ Inference v1.0 Power measurements. Due to the leading-edge nature of the measurement, limited datasets are available for comparison. Dell also has power measurements for the core datacenter R7525, configured with 3x NVIDIA A100-PCIe-40GB. On a cost per throughput per watt comparison, XE2420 configured with 4x NVIDIA T4s gets better power performance in a smaller footprint and at a lower price, all factors that are important for an edge deployment.
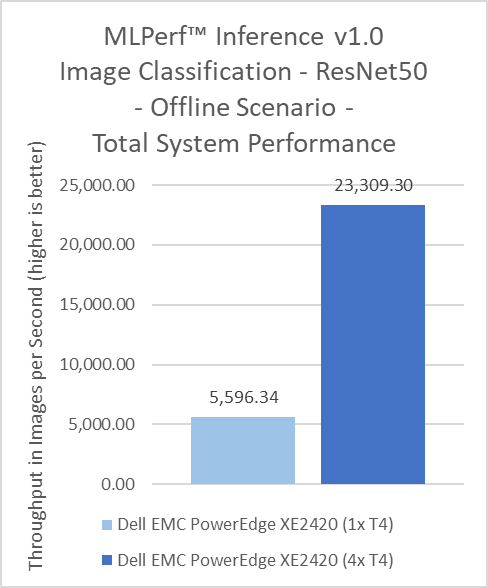
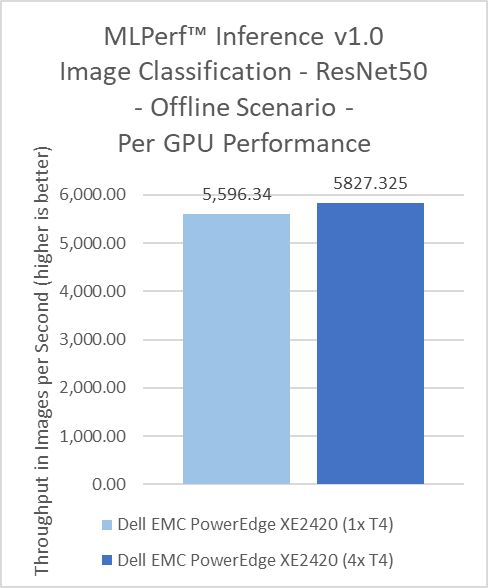
Inference benchmarks tend to scale linearly within a server, as this type of workload does not require GPU P2P communication. However, the quality of the system can affect that scaling. The XE2420 showcases above-average scaling; 4 GPUs provide more than 4x performance increase! This demonstrates that operating capabilities and performance were not sacrificed to support 4 GPUs in a smaller depth and form-factor.
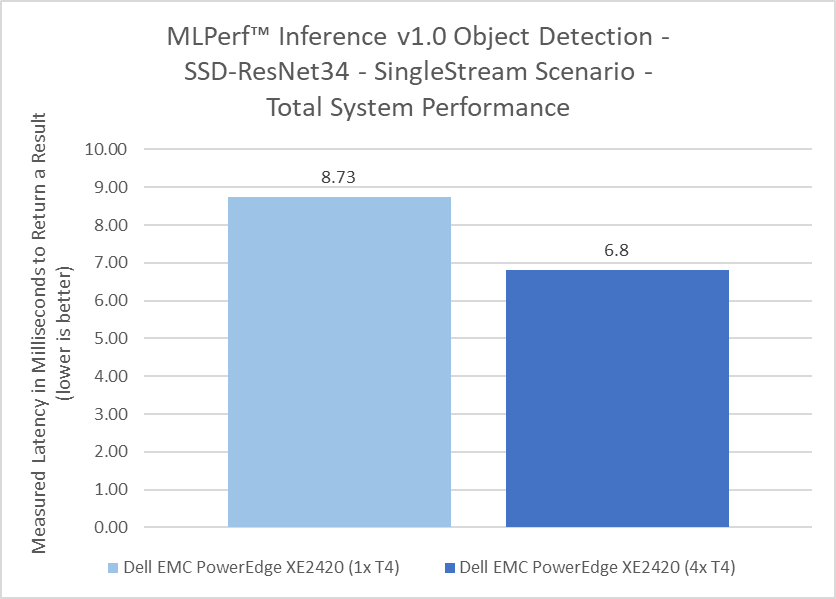
Dell submitted to the Edge benchmark suite of MLPerf™ Inference v1.0 for the third round of MLPerf Inference Testing. The unique scenario in this suite is “SingleStream”, discussed above. With SingleStream, system latency is paramount, as the server cannot move onto the second query until the first is finished. The fewer milliseconds, the faster the system, and the better suited it is for the Edge! System architecture affects latency, so depending on where the GPU is located latency may increase or decrease. This figure can be read as a best and worst case scenario; ie the XE2420 will return results on average in between 6.8 to 8.73 milliseconds, below the range of human-recongnizable delay for the SSD-ResNet34 benchmark. Not every server will meet this bar on every benchmark, and the XE2420 scores below this range on many of the submissions.
Comparisons to MLPerf™ Inference v0.7 XE2420 results will show that v1.0 results are slightly different in terms of total system and per-GPU throughput. This is due to a changed requirement between the two test suites. In v0.7, ECC could be turned off, which is common to improve performance of GDDR6 based GPUs. In v1.0, ECC is turned on. This better reflects most customer environments and use cases, since administrators will typically be alerted to any memory errors that could affect accuracy of results.
Conclusion: Better Performance-per-Dollar and Flexibility at the Edge without sacrificing Performance
MLPerf™ inference benchmark results clearly demonstrate that the XE2420 is truly a high-performance, efficient, half-depth server ideal for edge computing use cases and applications. The capability to support four NVIDIA T4 GPUs in a short-depth, edge-optimized form factor, while keeping them sufficiently cool enables customers to perform AI inference operations at the Edge on par with traditional mainstream 2U rack servers deployed in core data centers. The compact design provides customers new, powerful capabilities at the edge to do more even faster without extra cost or increased power requirements. The XE2420 is capable of true versatility at the edge, demonstrating strong performance not only for mundane workloads but also for a broad range of tested workloads, applicable in a number of Edge industries from Retail to Manufacturing to Autonomous driving. Dell EMC offers a complete portfolio of trusted technology solutions to aggregate, analyze and curate data from the edge to the core to the cloud and XE2420 is a key component of this portfolio to meet your compute needs at the Edge.
XE2420 MLPerf™ Inference v1.0 Full Results
The raw results from the MLPerf™ Inference v1.0 published benchmarks are displayed below, where the performance metric is throughput (items per second) for Offline and Server and latency (length of time to return a result, in milliseconds) for SingleStream. The power metric is Watts for Offline and Server and Energy (Joules) per Stream for SingleStream.
|
| 3d-unet-99 | 3d-unet-99.9 | ||
|
| Offline | SingleStream | Offline | SingleStream |
XE2420_T4x1_TRT | Performance | - | - | - | - |
Power/Energy | - | - | - | - | |
XE2420_T4x4_TRT | Performance | 31.22 (imgs/sec) | 171.73 (ms) | 31.22 (imgs/sec) | 171.73 (ms) |
Power/Energy | - | - | - | - | |
|
| dlrm-99.9 | dlrm-99 | ||
|
| Offline | Server | Offline | Server |
XE2420_T4x1_TRT | Performance | - | - | - | - |
Power/Energy | - | - | - | - | |
XE2420_T4x4_TRT | Performance | 135,149.00 (imgs/sec) | 126,531.00 (imgs/sec) | 135,189.00 (imgs/sec) | 126,531.00 (imgs/sec) |
Power/Energy | 829.09 (W) | 835.52 (W) | 830.13 (W) | 835.91 (W) | |
|
| resnet50 | ||
|
| Offline | Server | SingleStream |
XE2420_T4x1_TRT | Performance | 5,596.34 (imgs/sec) | - | 0.83 (ms) |
Power/Energy | - | - | - | |
XE2420_T4x4_TRT | Performance | 23,309.30 (imgs/sec) | 21,691.30 (imgs/sec) | 0.91 (ms) |
Power/Energy | 794.46 (W) | 792.69 (W) | 0.59 (Joules/Stream) | |
|
| rnnt | ||
|
| Offline | Server | SingleStream |
XE2420_T4x1_TRT | Performance | - | - | - |
Power/Energy | - | - | - | |
XE2420_T4x4_TRT | Performance | 5,704.60 (imgs/sec) | 4,202.02 (imgs/sec) | 71.75 (ms) |
Power/Energy | 856.80 (W) | 862.46 (W) | 31.77 (Joules/Stream) | |
|
| ssd-resnet34 | ||
|
| Offline | Server | SingleStream |
XE2420_T4x1_TRT | Performance | 129.28 (imgs/sec) | - | 8.73 (ms) |
Power/Energy | - | - | - | |
XE2420_T4x4_TRT | Performance | 557.43 (imgs/sec) | 500.96 (imgs/sec) | 6.80 (ms) |
Power/Energy | 792.85 (W) | 790.83 (W) | 4.81 (Joules/Stream) | |
Related Blog Posts
Dell Validated Design Guides for Inferencing and for Model Customization – March ’24 Updates
Fri, 15 Mar 2024 20:16:59 -0000
|Read Time: 0 minutes
Continuous Innovation with Dell Validated Designs for Generative AI with NVIDIA
Since Dell Technologies and NVIDIA introduced what was then known as Project Helix less than a year ago, so much has changed. The rate of growth and adoption of generative AI has been faster than probably any technology in human history.
From the onset, Dell and NVIDIA set out to deliver a modular and scalable architecture that supports all aspects of the generative AI life cycle in a secure, on-premises environment. This architecture is anchored by high-performance Dell server, storage, and networking hardware and by NVIDIA acceleration and networking hardware and AI software.
Since that introduction, the Dell Validated Designs for Generative AI have flourished, and have been continuously updated to add more server, storage, and GPU options, to serve a range of customers from those just getting started to high-end production operations.
A modular, scalable architecture optimized for AI
This journey was launched with the release of the Generative AI in the Enterprise white paper.
This design guide laid the foundation for a series of comprehensive resources aimed at integrating AI into on-premises enterprise settings, focusing on scalable and modular production infrastructure in collaboration with NVIDIA.
Dell, known for its expertise not only in high-performance infrastructure but also in curating full-stack validated designs, collaborated with NVIDIA to engineer holistic generative AI solutions that blend advanced hardware and software technologies. The dynamic nature of AI presents a challenge in keeping pace with rapid advancements, where today's cutting-edge models might become obsolete quickly. Dell distinguishes itself by offering essential insights and recommendations for specific applications, easing the journey through the fast-evolving AI landscape.
The cornerstone of the joint architecture is modularity, offering a flexible design that caters to a multitude of use cases, sectors, and computational requirements. A truly modular AI infrastructure is designed to be adaptable and future-proof, with components that can be mixed and matched based on specific project requirements and which can span from model training, to model customization including various fine-tuning methodologies, to inferencing where we put the models to work.
The following figure shows a high-level view of the overall architecture, including the primary hardware components and the software stack:
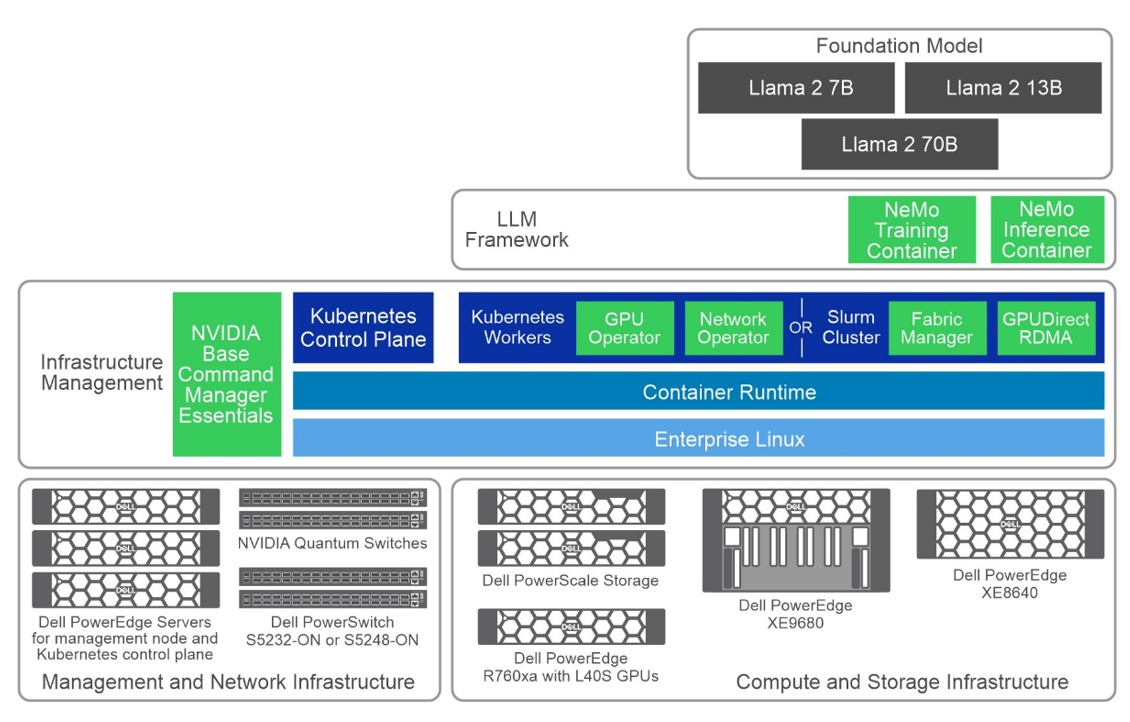
Figure 1: Common high-level architecture
Generative AI Inferencing
Following the introductory white paper, the first validated design guide released was for Generative AI Inferencing, in July 2023, anchored by the innovative concepts introduced earlier.
The complexity of assembling an AI infrastructure, often involving an intricate mix of open-source and proprietary components, can be formidable. Dell Technologies addresses this complexity by providing fully validated solutions where every element is meticulously tested, ensuring functionality and optimization for deployment. This validation gives users the confidence to proceed, knowing their AI infrastructure rests on a robust and well-founded base.
Key Takeaways
- In October 2023, the guide received its first update, broadening its scope with added validation and configuration details for Dell PowerEdge XE8640 and XE9680 servers. This update also introduced support for NVIDIA Base Command Manager Essentials and NVIDIA AI Enterprise 4.0, marking a significant enhancement to the guide's breadth and depth.
- The guide's evolution continues into March 2024 with its third iteration, which includes support for the PowerEdge R760xa servers equipped with NVIDIA L40S GPUs.
- The design now supports several options for NVIDIA GPU acceleration components across the multiple Dell server options. In this design, we showcase three Dell PowerEdge servers with several GPU options tailored for generative AI purposes:
- PowerEdge R760xa server, supporting up to four NVIDIA H100 GPUs or four NVIDIA L40S GPUs
- PowerEdge XE8640 server, supporting up to four NVIDIA H100 GPUs
- PowerEdge XE9680 server, supporting up to eight NVIDIA H100 GPUs
The choice of server and GPU combination is often a balance of performance, cost, and availability considerations, depending on the size and complexity of the workload.
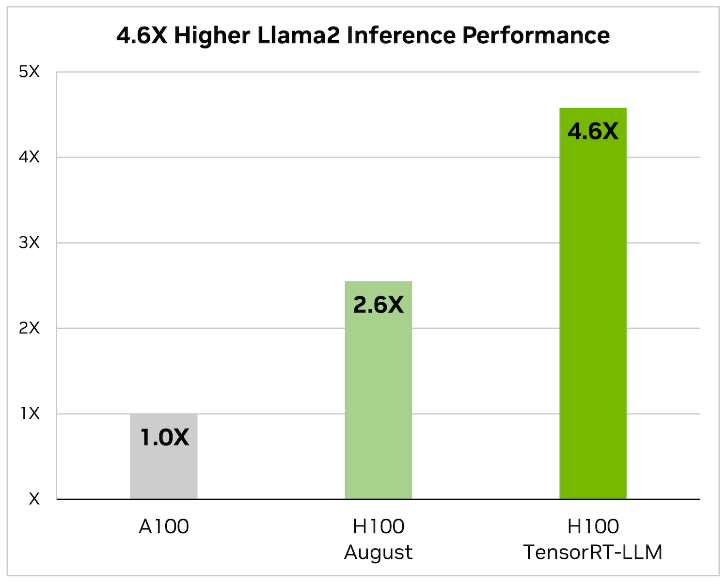
- This latest edition also saw the removal of NVIDIA FasterTransformer, replaced by TensorRT-LLM, reflecting Dell’s commitment to keeping the guide abreast of the latest and most efficient technologies. When it comes to optimizing large language models, TensorRT-LLM is the key. It ensures that models not only deliver high performance but also maintain efficiency in various applications.
The library includes optimized kernels, pre- and postprocessing steps, and multi-GPU/multi-node communication primitives. These features are specifically designed to enhance performance on NVIDIA GPUs.
It uses tensor parallelism for efficient inference across multiple GPUs and servers, without the need for developer intervention or model changes.
- Additionally, this update includes revisions to the models used for validation, ensuring users have access to the most current and relevant information for their AI deployments. The Dell Validated Design guide covers Llama 2 and now Mistral as the foundation models for inferencing with this infrastructure design with Triton Inference Server:
- Llama 2 7B, 13B, and 70B
- Mistral
- Falcon 180B
- Finally (and most importantly) performance test results and sizing considerations showcase the effectiveness of this updated architecture in handling large language models (LLMs) for various inference tasks. Key takeaways include:
- Optimized Latency and Throughput—The design achieved impressive latency metrics, crucial for real-time applications like chatbots, and high tokens per second, indicating efficient processing for offline tasks.
- Model Parallelism Impact—The performance of LLMs varied with adjustments in tensor and pipeline parallelism, highlighting the importance of optimal parallelism settings for maximizing inference efficiency.
- Scalability with Different GPU Configurations—Tests across various NVIDIA GPUs, including L40S and H100 models, demonstrated the design’s scalability and its ability to cater to diverse computational needs.
- Comprehensive Model Support—The guide includes performance data for multiple models (as we already discussed) across different configurations, showcasing the design’s versatility in handling various LLMs.
- Sizing Guidelines—Based on performance metrics, updated sizing examples are available to help users determine the appropriate infrastructure based on their specific inference requirements (these guidelines very welcome)
All this highlights Dell’s commitments and capability to deliver high-performance, scalable, and efficient generative AI inferencing solutions tailored to enterprise needs.
Generative AI Model Customization
The validated design guide for Generative AI Model Customization was first released in October 2023, anchored by the PowerEdge XE9680 server. This guide detailed numerous model customization methods, including the specifics of prompt engineering, supervised fine-tuning, and parameter-efficient fine-tuning.
The updates to the Dell Validated Design Guide from October 2023 to March 2024 included the initial release, the addition of validated scenarios for multi-node SFT and Kubernetes in November 2023, updated performance test results, and new support for PowerEdge R760xa servers, PowerEdge XE8640 servers, and PowerScale F710 all-flash storage as of March 2024.
Key Takeaways
- The validation aimed to test the reliability, performance, scalability, and interoperability of a system using model customization in the NeMo framework, specifically focusing on incorporating domain-specific knowledge into Large Language Models (LLMs).
- The process involved testing foundational models of sizes 7B, 13B, and 70B from the Llama 2 series. Various model customization techniques were employed, including:
- Prompt engineering
- Supervised Fine-Tuning (SFT)
- P-Tuning, and
- Low-Rank Adaptation of Large Language Models (LoRA)
- The design now supports several options for NVIDIA GPU acceleration components across the multiple Dell server options. In this design, we showcase three Dell PowerEdge servers with several GPU options tailored for generative AI purposes:
- PowerEdge R760xa server, supporting up to four NVIDIA H100 GPUs or four NVIDIA L40S GPUs. While the L40S is cost-effective for small to medium workloads, the H100 is typically used for larger-scale tasks, including SFT.
- PowerEdge XE8640 server, supporting up to four NVIDIA H100 GPUs.
- PowerEdge XE9680 server, supporting up to eight NVIDIA H100 GPUs.
As always, the choice of server and GPU combination depends on the size and complexity of the workload.
- The validation used both Slurm and Kubernetes clusters for computational resources and involved two datasets: the Dolly dataset from Databricks, covering various behavioral categories, and the Alpaca dataset from OpenAI, consisting of 52,000 instruction-following records. Training was conducted for a minimum of 50 steps, with the goal being to validate the system's capabilities rather than achieving model convergence, to provide insights relevant to potential customer needs.
The validation results along with our analysis can be found in the Performance Characterization section of the design guide.
What’s Next?
Looking ahead, you can expect even more innovation at a rapid pace with expansions to the Dell’s leading-edge generative AI product and solutions portfolio.
For more information, see the following resources:
- Dell Generative AI Solutions
- Dell Technical Info Hub for AI
- Generative AI in the Enterprise white paper
- Generative AI Inferencing in the Enterprise Inferencing design guide
- Generative AI in the Enterprise Model Customization design guide
- Dell Professional Services for Generative AI
~~~~~~~~~~~~~~~~~~~~~
Unlocking the Power of Large Language Models and Generative AI: A Dell and Run:ai Joint Solution
Tue, 30 Jan 2024 19:47:13 -0000
|Read Time: 0 minutes
In the fast-paced landscape of AI, the last year has undeniably been marked as the era of Large Language Models (LLMs), especially in the Generative AI (GenAI) field. Models like GPT-4 and Falcon have captured our imagination, showcasing the remarkable potential of these LLMs. However, beneath their transformative capabilities lie a substantial challenge: the insatiable hunger for computational resources.
The demand for compute: fueling innovation with computational power
GenAI applications span from media industry to software development, driving innovation across industries. OpenAI's release of GPT-3 was a turning point, demonstrating the capabilities of language models and their potential to revolutionize every sector. On one hand, startups and tech giants have introduced closed-source models, offering APIs for their usage, exemplified by OpenAI and GPT-4. On the other hand, an active open-source community has emerged, releasing powerful models such as Falcon and Llama 2. These models, both closed- and open-source, have spurred a wave of interest, with companies racing to use their potential.
While the promise of LLMs is enormous, they come with a significant challenge—access to high-performance GPUs. Enterprises aiming to deploy these models in their private data centers or cloud environments must contend with the need for substantial GPU power. Security concerns further drive the preference for in-house deployments, making GPU accessibility critical.
The infrastructure required to support LLMs often includes high-end GPUs connected through fast interconnects and storage solutions. These resources are not just expensive and scarce but are also in high demand, leading to bottlenecks in machine learning (ML) development and deployment. Orchestrating these resources efficiently and providing data science and ML teams with easy and scalable access becomes a Herculean task.
Challenges with GPU allocation
In this landscape, GPUs are the backbone of the computational power that fuels these massive language models. Due to the limited availability of on-premises and cloud resources, the open-source community has taken steps to address this challenge. Libraries like bits and bytes (by Tim Dettmers) and ggml (by Georgi Gerganov) have emerged, using various optimization techniques such as quantization to fine-tune and deploy these models on local devices.
However, the challenges are not limited to model development and deployment. These LLMs demand substantial GPU capacity to maintain low latency during inference and high throughput during fine-tuning. In the real world, the need for capacity means having an infrastructure that dynamically allocates GPU resources to handle LLM fine-tuning and inference operations, all while ensuring efficiency and minimal wasted capacity.
As an example, consider loading LLama-7B using half precision (float16). Such a model requires approximately 12GB of GPU memory─a figure that can be even lower with the use of lower precision. In instances where high-end GPUs, like the NVIDIA A100 GPU with 40 GB (or 80 GB) of memory, are dedicated solely to a single model, severe resource waste results, especially when done at scale. The wasted resource does not only translate to financial inefficiencies but also reduced productivity in data science teams, and an increased carbon footprint due to the excessive underutilization of running resources over extended periods.
Some LLMs are so large that they must be distributed across multiple GPUs or multiple GPU servers. Consider Falcon-180B using full precision. Such a model requires approximately 720 GB and the use of more than 16 NVIDIA A100 GPUs with 40 GB each. Fine tuning such models and running them in production requires tremendous computing power and significant scheduling and orchestration challenges. Such workloads require not only a high-end compute infrastructure but also a high-end performant software stack that can distribute these workloads efficiently without bottlenecks.
Apart from training jobs, serving these models also requires efficient autoscaling on hardware. When there is high demand, these applications must be able to scale up to hundreds of replicas rapidly, while in low demand situations, they can be scaled down to zero to save costs.
Optimizing the management of LLMs for all these specific needs necessitates a granular view of GPU use and performance as well as high-level scheduling view of compute-intensive workloads. For instance, it is a waste if a single model like LLama-7B (12 GB) is run on an NVIDIA A100 (40GB) with almost 60 percent spare capacity instead of using this remaining capacity for an inference workload.
Concurrency and scalability are essential, both when dealing with many relatively small, on-premises models, each fine-tuned and tailored to specific use cases as well as when dealing with huge performant models needing careful orchestration. These unique challenges require a resource orchestration tool like Run:ai to work seamlessly on top of Dell hardware. Such a solution empowers organizations to make the most of their GPU infrastructure, ensuring that every ounce of computational power is used efficiently. By addressing these challenges and optimizing GPU resources, organizations can harness the full potential of LLMs and GenAI, propelling innovation across various industries.
Dell Technologies and Run:ai: joint solution
To address these bottlenecks, which hinder the rapid adoption of GenAI in organizations, Run:ai, a compute orchestration solution, teams up with Dell Technology.
The Dell Generative AI Solutions portfolio, a comprehensive suite of Dell products and services (Dell PowerEdge XE9680, PowerEdge 760XA, and PowerEdge XE8640 servers) in collaboration with NVIDIA, enables customers to build GenAI models on-premises quickly and securely, accelerate improved outcomes, and drive new levels of intelligence. Dell Validated Designs for Generative AI now support both model tuning and inferencing, allowing users to deploy GenAI models quickly with pretested and proven Dell infrastructure, software, and services to power transformative business outcomes with GenAI. The Validated designs integrate end-to-end AI solutions including all the critical components (server, networking, storage, and software) for AI systems, while Run:ai introduces two key technological components that unlock the true potential of these AI models: GPU optimization and a sophisticated scheduling system for training and inference workloads. Extending the Dell GenAI approaches with Run:ai orchestration enables customers to optimize GenAI and AI operations to build and train AI models and run inferencing with greater speed and efficiency.
AI-optimized compute: maximizing GPU utilization
Dell Technologies offers a range of acceleration-optimized PowerEdge servers, purpose-built for high-performance workloads like AI and demanding use-cases in generative AI, as part of the extensive server portfolio that supports various NVIDIA GPUs. Dell PowerEdge servers advance accelerated compute to drive enhanced AI workload outcomes with greater insights, inferencing, training, and visualization. However, one of the primary challenges in training and deploying LLMs is GPU use. Together with Dell PowerEdge servers, Run:ai's GPU optimization layer enables features like fractionalizing GPUs and GPU oversubscription. These features ensure that multiple workloads (training and inference), even small models, can efficiently run on the same GPU. By making better use of existing GPU resources, costs are reduced, and bottlenecks are mitigated.
Advanced scheduling: efficient workload management
Run:ai's advanced scheduling system integrates seamlessly into Kubernetes environments on top of PowerEdge servers. It is designed to tackle the complexities that arise when multiple teams and users share a GPU cluster and when running large multi-GPU or multi-node workloads. The scheduler optimizes resource allocation, ensuring efficient utilization of GPUs among various workloads, including training, fine-tuning, and inference.
Autoscaling and GPU optimization for inference workloads
Run:ai's autoscaling functionality enables dynamic adjustments to the number of replicas, allowing for efficient scaling based on demand. In times of increased workload, Run:ai optimally uses the available GPU, scaling up the replicas to meet performance requirements. Conversely, during periods of low demand, the number of replicas can be scaled down to zero, minimizing resource use and leading to cost savings. While there might be a brief cold start delay with the first request, this approach provides a flexible and effective solution to adapt to changing inference demands while optimizing costs.
Beyond autoscaling, deploying models for inference using Run:ai is a straightforward process. Internal users can effortlessly deploy their models and access them through managed URLs or user-friendly web interfaces like Gradio and Streamlit. This streamlined deployment process facilitates sharing and presentation of deployed LLMs, fostering collaboration and delivering a seamless experience for stakeholders.
AI networking
To achieve high throughput in multi-node training and low latency when hosting a model on multiple machines, most GenAI models require robust and highly performant networking capabilities on hardware, which is where Dell's networking capabilities and offerings come into play. The network interconnects the compute nodes among each other to facilitate communications during distributed training and inferencing. The Dell PowerSwitch Z-series are high-performance, open, and scalable data center switches ideal for generative AI, as well as NVIDIA Quantum InfiniBand switches for faster connectivity.
Fast access to your data
Data is a crucial component for each part of the development and deployment steps. Dell PowerScale storage supports the most demanding AI workloads with all-flash NVMe file storage solutions that deliver massive performance and efficiency in a compact form factor. PowerScale is an industry-leading storage platform purpose-built to handle massive amounts of unstructured data, ideal for supporting datatypes required for generative AI.
Streamlined LLM tools
To simplify the experience for researchers and ML engineers, Run:ai offers a suite of tools and frameworks. They remove the complexities of GPU infrastructure with interfaces like command-line interfaces, user interfaces, and APIs on top of Dell hardware. With these tools, training, fine-tuning, and deploying models become straightforward processes, enhancing productivity, and reducing time-to-market. As a data scientist, you can take pretrained models from the Huggingface model hub and start working on them with your favorite IDE and experiment with management tools in minutes, a testament to the efficiency and ease of the Dell and Run:ai solution.
Benefits of the Dell and Run:ai solution for customers
Now that we have explored the challenges posed by LLMs and the joint solution of Dell Technologies and Run:ai to these bottlenecks, let's dive into the benefits that this partnership between Dell Technologies and Run:ai and offers to customers:
1. Accelerated time-to-market
The combination of Run:ai's GPU optimization and scheduling solutions, along with Dell's robust infrastructure, significantly accelerates the time-to-market for AI initiatives. By streamlining the deployment and management of LLMs, organizations can quickly capitalize on their AI investments.
2. Enhanced productivity
Data science and ML engineering teams, often unfamiliar with the complexities of AI infrastructure, can now focus on what they do best: building and fine-tuning models. Run:ai's tools simplify the process, reducing the learning curve and improving productivity.
3. Cost efficiency
Optimizing GPU use not only provides performance but also provides cost-effectiveness. By running multiple workloads on the same GPU, organizations can achieve better cost efficiency, get the most out of their infrastructure, thus making AI initiatives more financially viable.
4. Increased scalability and GPU availability
Run:ai's advanced scheduling system ensures that workloads are efficiently managed, even during peak demand. This scalability is crucial for organizations that need to serve language models in real time to a growing user base. In addition, the scheduling component ensures fair and optimized allocation of GPU resources between multiple users, teams, and tasks, preventing resource bottlenecks and contention and increasing availability of GPUs to allow more users, teams, and AI services to get access and use available GPU resources effectively.
5. Innovation unleashed
The solution empowers enterprise teams to innovate and experiment with LLMs and GenAI without being hindered by infrastructure complexities. Researchers and ML engineers can easily fine-tune and deploy models using abstraction tools, fostering innovation and exploration in AI projects.
Summary
The joint solution offered by Dell Technologies and Run:ai addresses the critical challenges faced by organizations ramping up with GenAI for their business needs and working with LLMs. By enhancing GPU accessibility, optimizing scheduling, streamlining workflows, and saving costs, this solution empowers businesses to fully harness the potential of LLMs in GenAI applications while simplifying the challenges. With AI initiatives becoming increasingly vital in today's world, this partnership offers businesses new ways to automate and simplify their GenAI strategy and drive more business innovation.
For information about how to get started with Dell Technologies and Run:ai on your GenAI journey, see these resources:
- Dell AI Solutions
- GPU Optimization with Run:ai Atlas technical whitepaper
- Accelerate AI by Optimizing Compute Resources
- Run:ai
Authors: Justin King, Ekin Karabulut
Contributor: James Yung