


Resiliency Explained — Understanding the PowerFlex Self-Healing, Self-Balancing Architecture
Mon, 17 Aug 2020 21:36:11 -0000
|Read Time: 0 minutes
My phone rang. When I picked up it was Rob*, one of my favourite PowerFlex customers who runs his company’s Storage Infrastructure. Last year, his CTO made the decision to embrace digital transformation across the entire company, which included a software-defined approach. During that process, they selected the Dell EMC PowerFlex family as their Software-Defined Storage (SDS) infrastructure because they had a mixture of virtualised and bare-metal workloads, needed a solution that could handle their unpredictable storage growth, and also one powerful enough to support their key business applications.
During testing of the PowerFlex system, I educated Rob on how we give our customers an almost endless list of significant benefits – blazingly fast block storage performance that scales linearly as new nodes are added to the system; a self-healing & self-balancing storage platform that automatically ensures that it always gives the best possible performance; super-fast rebuilds in the event of disk or node failures, plus the ability to engineer a system that will meet or exceed his business commitments to uptime & SLAs.
PowerFlex provides all this (and more) thanks to its “Secret Sauce” – its Distributed Mesh-Mirror Architecture. It ensures there are always two copies of your application data – thus ensuring availability in case of any hardware failure. Data is intelligently distributed across all the disk devices in each of the nodes within a storage pool. As more nodes are added, the overall performance increases nearly linearly, without affecting application latencies. Yet at the same time, adding more disks or nodes also makes rebuild times during those (admittedly rare) failure situations decrease – which means that PowerFlex heals itself more quickly as the system grows!
PowerFlex automatically ensures that the two copies of each block of data that gets written to the Storage Pool reside on different SDS (storage) nodes, because we need to be able to get a hold of the second copy of data if a disk or a storage node that holds the first block fails at any time. And because the data is written across all the disks in all the nodes within a Storage Pool, this allows for super-quick IO response times, because we access all data in parallel.
Data also gets written to disk using very small chunk sizes – either 1MB or 4KB, depending on the Storage Pool type. Why is this? Doing this ensures that we always spread the data evenly across all the disk devices, automatically preventing performance hot-spots from ever being an issue in the first place. So, when a volume is assigned to a host or a VM, that data is already spread efficiently across all the disks in all Storage Nodes. For example, a 4-Node PowerFlex system, with 3 volumes provisioned from it, will look something like the following:
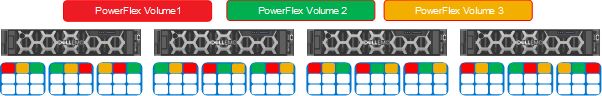
Figure 1: A Simplified View of a 4-Node PowerFlex System Presenting 3 Storage Volumes
Now, here is where the magic begins. In the event of a drive failure, the PowerFlex rebuild process utilizes an efficient many-to-many scheme for very fast rebuilds. It uses ALL the devices in the storage pool for rebuild operations and will always rebalance the data in the pool automatically whenever new disks or nodes are added to the Storage Pool. This means that, as the system grows, performance increases linearly – which is great for future-proofing your infrastructure if you are not sure how your system will grow. But this also gives another benefit – as your system grows in size, rebuilds get faster!
Customers like Rob typically raise their eyes at that last statement – until we provide a simple example to get the point across – and then they have a lightbulb moment. Think about what happens if we used a 4-node PowerFlex system, but only had one disk drive in each storage node. All data would be spread evenly across the 4 Nodes, but we also have some spare capacity reserved, which is also spread evenly across each drive. This spare capacity is needed to rebuild data into, in the event of a disk or a node failure and it usually equates to either the capacity of an entire node or 10% of the entire system, whichever is largest. At a superficial level, a 4-Node system would look something like this:
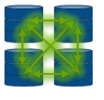
Figure 2: A Simplified View of a 4-Node PowerFlex System & Available Dataflows
If one of those drives (or nodes) failed, then obviously we would end up rebuilding between the three remaining disks, one disk per node:
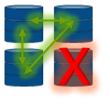
Figure 3: Our Simplified 4-Node PowerFlex System & Available Dataflows with One Failed Disk
Now of course, in this scenario, that rebuild is going to take some time to complete. We will be performing lots of 1MB or 4KB copies between the three remaining nodes, in both directions, as we rebuild into the spare capacity available on the remaining nodes & get back to having two copies of data in order to be fully protected again. It is worth pointing out here that a node typically contains 10 or 24 drives, not just one, so PowerFlex isn’t just protecting you from “a” drive failure, we’re able to protect you from a whole pile of drives. This is not your typical RAID card schema.
Now – let the magic of PowerFlex begin! What happens if we were to add a fifth storage node into the mix? And what happens when a disk or node fails in this scenario??
Figure 4: Dataflows in a Normally Running 5-Node PowerFlex System … & Available Dataflows with One Failed Disk or Node
It should be clear for all to see that we now have more disks - and nodes - to participate in the rebuild process, making the rebuild complete substantially faster than in our previous 4 node scenario. But PowerFlex nodes do not have just a single disk inside them - They typically have 10 or 24 drive slots, hence even for a small deployment with 4 nodes, each having 10 disks, we will have data placed intelligently and evenly across all 40 drives, configured as one Storage Pool. Now, with today’s flash media, that is a heck of a lot of performance capability available at your fingertips, that can be delivered with consistent sub-millisecond latencies.
Let me also highlight the “many-to-many” rebuild scheme used by each Storage Pool. This means that any data within a Storage Pool can be rebuilt to all the other disks in the same Pool. If we have 40 drives in our pool, it means that when one drive fails, the other 39 drives will be utilised to rebuild the data of the failed drive. This results in extremely quick rebuilds that occur in parallel, with minimum impact to application performance if we lose a disk:
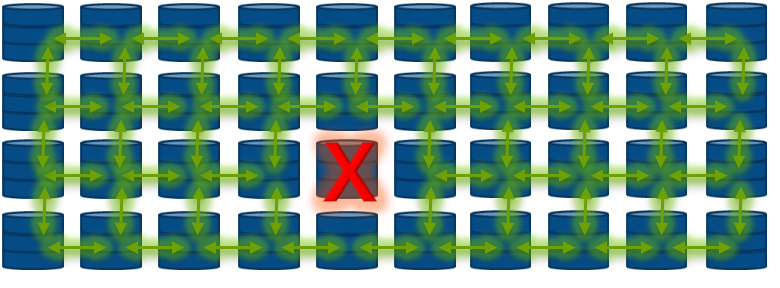
Figure 5: A 40-disk Storage Pool, with a Disk Failure… Showing The Magic of Parallel Rebuilds
Note that we had to over-simplify the dataflows between the disks in the figure above, because if we tried to show all the interconnects at play, we would simply have a tangle of green arrows!
Here’s another example to explain the difference between PowerFlex and conventional RAID-type drive protection. The initial rebuild test on an empty system usually takes little more than a minute for the rebuild to complete. This is because PowerFlex will only ever rebuild chunks of application data, unlike a traditional RAID controller, which will rebuild disk blocks whether they contain data or not. Why waste resources rebuilding empty zeroes of data when you need to repair from a failed disk or node as quickly as possible?
The PowerFlex Distributed Mesh-Mirror architecture is truly unique and gives our customers the fastest, most scalable and most resilient block storage platform available on the market today! Please visit www.DellTechnologies.com/PowerFlex for more information.
* Name changed to protect the innocent!
Related Blog Posts

An Introduction to the Unified PowerFlex Manager Platform

Tue, 16 Aug 2022 14:56:28 -0000
|Read Time: 0 minutes
We have all heard the well-known quote that “Change is the only constant in life”. Nowhere is this concept more apparent than in the world of IT, where digital transformation has become accepted as a fact of life and standing still is not an option. Anyone - or anything - that stands still in the world of IT faces becoming extinct, or irrelevant, when faced with responding to the ever-changing challenges that businesses must solve to survive and grow in the 21st Century. IT infrastructure has had to evolve to provide the answers needed in today’s business landscape – a world where Dev Ops and automation is driving business agility and productivity, where flexibility is key, and where consolidation and optimization are essential in the face of ever-shrinking budgets.
When dealing with the ever-changing IT landscape, software-defined infrastructure is ideally suited to delivering answers for business change. Indeed, many Dell Technologies customers choose PowerFlex as their software-defined infrastructure solution of choice because as a product, it has changed and evolved as much as customers themselves have had to change and evolve.
However, there are times when evolution itself is not enough to bring about inevitable changes that must occur - sometimes there must be a revolution! When it comes to IT infrastructure, managers are often given the “coin toss” of only being able to pick from either evolution or revolution. Faced with such a decision, managers often choose evolution over revolution – a simpler, more palatable path.
This was the dilemma that PowerFlex developers faced – continue with various separate management planes or unify them. Our developers were already planning to introduce several new features in PowerFlex 4.0, including PowerFlex File Services and NVMe/TCP connectivity. Adding new features to existing products generally means having to change the existing management tools and user interfaces to integrate the new functionality into the existing toolset. PowerFlex has a broad product portfolio and a broad set of management tools to match, as shown in the following figure. The uptake of customers using PowerFlex Manager was proof-positive that customers liked to use automation tools to simplify their infrastructure deployments and de-risk life-cycle management (LCM) tasks.
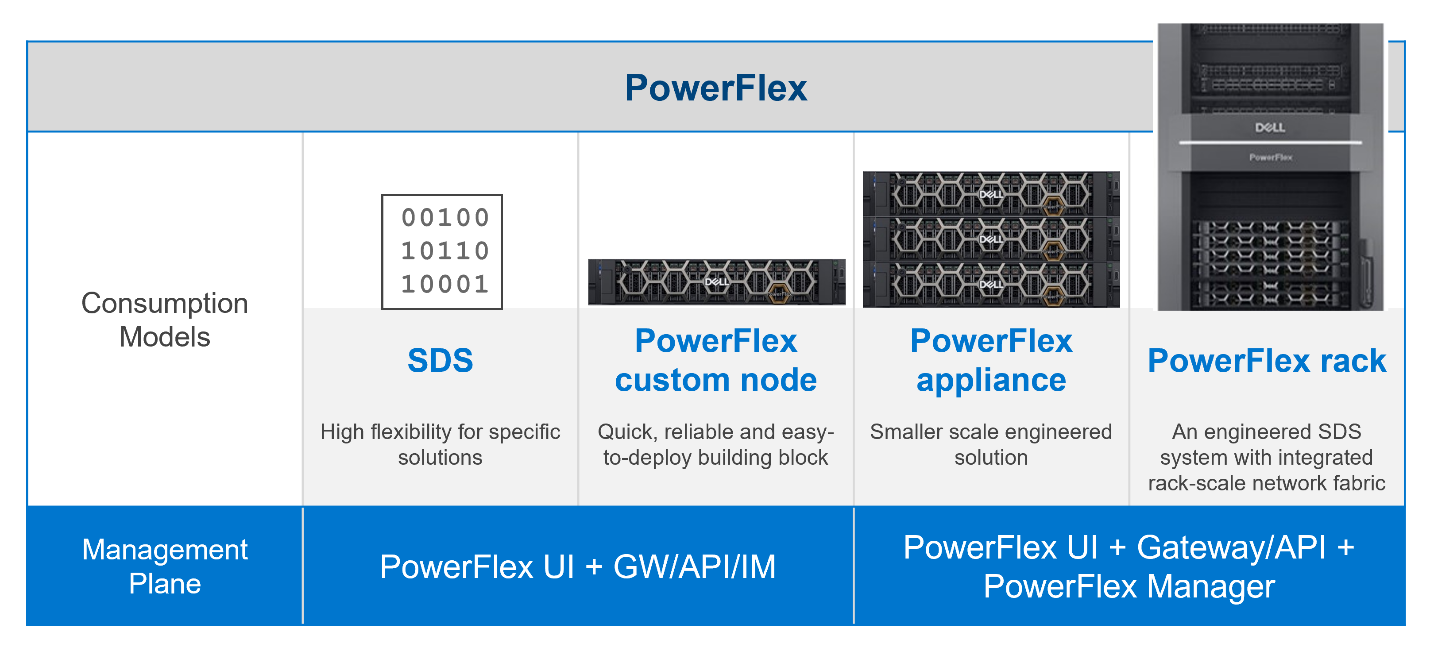
Figure 1: PowerFlex management planes, before PowerFlex 4.0
In addition to the multiple demands they had to contend with, the PowerFlex team was aware that new, as-yet unthought of demands would inevitably come to the surface in the future, as the onward progression of IT transformation continues.
Aiming to enhance the hybrid datacenter infrastructure that our customers are gravitating towards, simply evolving the existing management planes was not going to be sufficient. The time had come for revolution instead of evolution for the world of PowerFlex management.
The answer is simple to state, but not easy to achieve – design a new Management & Orchestration platform that reduces complexity for our customers. The goal was to simplify things by having a single management plane that is suitable for all customers, regardless of their consumption model. Revolution indeed!
Given a blank drawing board, the PowerFlex Team drew up a list of requirements needed for the new PowerFlex Management stack. The following is a simplified list:
- Unified RBAC and User Management. Implement single sign-on for authentication and authorization, ensuring that only a single set of roles is needed throughout PowerFlex.
- Have a single, unified web UI – but make it extensible, so that as new functionality becomes available, it can easily be added to the UI without breaking it. The addition of “PowerFlex File Services” with PowerFlex 4.0 is proof that this approach works!
- Create a single REST endpoint for all APIs, to ensure that both the legacy and the modern endpoints are accessible through a standardized PowerAPI.
- Ensure that the management stack is highly available, self-healing, and resilient.
- Centralize all events from all PowerFlex components – the SDS itself, switches, nodes, and resources, so that it simplifies the generation of alerts and call home operations.
Faced with this wish list, the team decided to build a new “unified” PowerFlex Manager to satisfy the “one management pane” requirement. But how to deliver a UI that is flexible enough to deal with serving different applications from a single web UI? How can this support a highly available and extensible management platform? It became clear to all that a new M&O stack was needed to achieve these aims and that the answer was to leverage the use of microservices, running as part of a larger, containerized platform.
Around the same time, the Dell ISG Development Team had been working internally on a new shared services platform. It was now ready for primetime. This Dell-developed Kubernetes distribution provides internal shared services that are required by nearly any IT infrastructure: logging services, database-as-a-service, certificate management, identity management, secrets management. It also manages Docker and Helm registries.
Using this new platform as a base, the PowerFlex Team then deployed additional microservices on top of it to micro-manage services specific to PowerFlex. Different micro-frontends can be called upon, depending on the operational context. While the overall PowerFlex Manager GUI application can be run as one “generic” UI, it can call out to different micro-frontends when required. This means that implementing and using microservices simplifies the transfer of previous element managers into the unified PowerFlex Manager world. For example, the traditional PowerFlex Block UI (the PowerFlex Presentation Server UI from PowerFlex 3.6) is now treated as one microservice, while the PowerFlex Manager Lifecycle Manager is now handled by several microservices all working in tandem. Plus, it becomes simple to add a new micro-frontend to handle the “PowerFlex File” functionality that has been released with PowerFlex 4.0 into the GUI as well. Because each GUI section now has its own micro-frontend, the UI now meets the “flexible and extensible” requirement.
This flexibility gives our existing PowerFlex customers assurance as they move from version 3.6 to 4.0. And equally important, it means there is now a single unified manager that can cover all consumption models, as shown in the following figure:
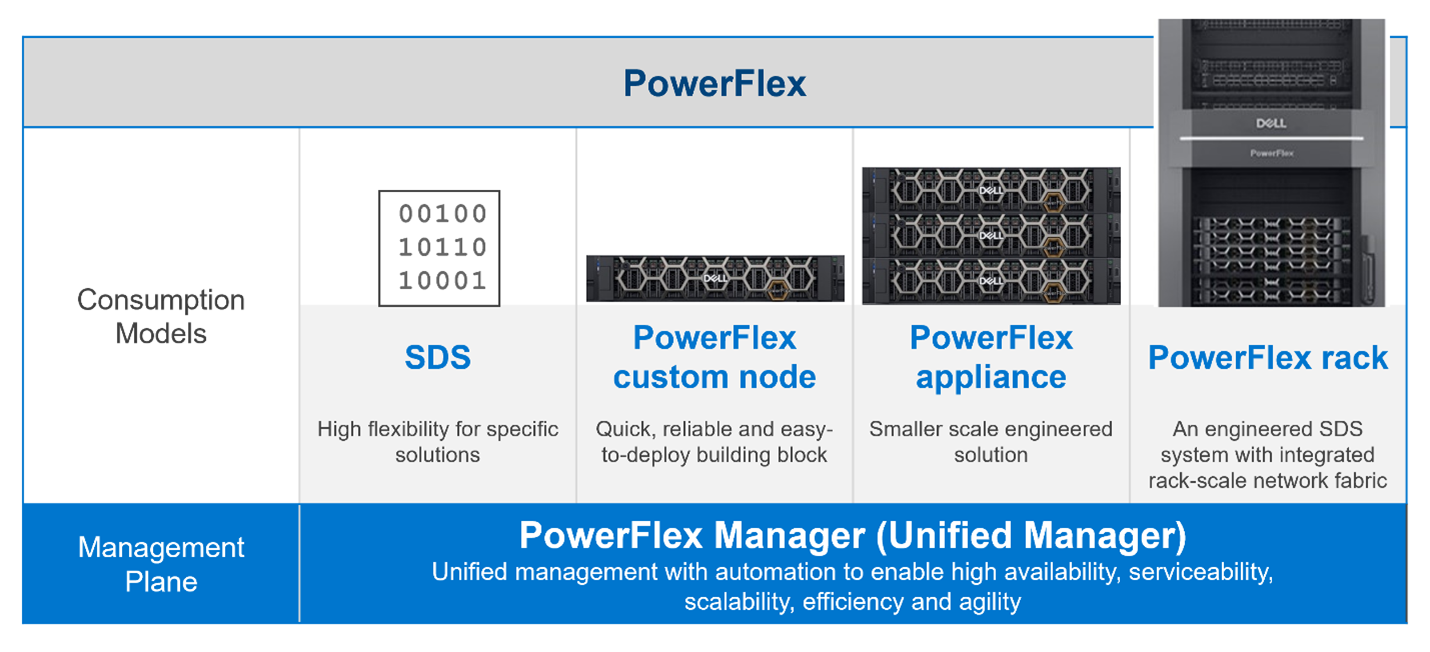
Figure 2. The unified PowerFlex Management Plane with PowerFlex 4.0
Finally, what does the new unified PowerFlex Manager look like? Existing PowerFlex users will be pleased to see that the new unified PowerFlex Manager still has the same “look and feel” that PowerFlex Manager 3.x had. We hope this will make it easier for operations staff when they decide to upgrade from PowerFlex 3.x to PowerFlex 4.0. The following figures show the Block and File Services tabs respectively:
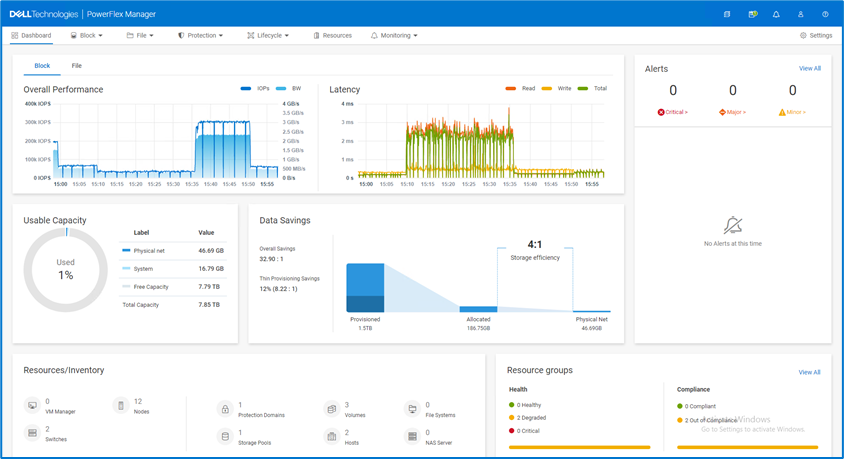
Figure 3. The unified PowerFlex Manager 4.0 Dashboard

Figure 4. The unified PowerFlex Manager 4.0 – Resources
While we cannot stop progress, we can always excel when faced with an ever-changing landscape. Customers already choose PowerFlex when they want to deploy highly performant, scalable, resilient, and flexible software-defined infrastructures. They can now also choose to move to PowerFlex 4.0, safe in the knowledge that they have also future-proofed the management of their infrastructure. While they may not know what changes are in store, the unified PowerFlex Manager Platform will help ensure that those future changes, whatever they are, can be handled easily when deployed on top of PowerFlex.
The enhancements made to PowerFlex provide many possibilities for modern datacenters and their administrators, especially when faced with the constant digital transformation seen in IT today. This is seen in how the various PowerFlex management consoles have been unified to allow continued change and growth to meet organizations’ needs. Yet, there is also continuity with previous versions of the UI, ensuring an easy transition for users when they have migrated to 4.0. If you are interested in finding out more about PowerFlex and all it has to offer your organization, reach out to your Dell representative.
Authors: Simon Stevens, PowerFlex Engineering Technologist, EMEA.
Tony Foster, Senior Principal Technical Marketing Engineer.
Twitter: @wonder_nerd
LinkedIn

Q1 2024 Update for Terraform Integrations with Dell Infrastructure

Tue, 02 Apr 2024 14:45:56 -0000
|Read Time: 0 minutes
This post covers all the new Terraform resources and data sources that have been released in the last two quarters: Q4’23 and Q1 ‘24. You can check out previous releases of Terraform providers here: Q1-2023, Q2-2023, and Q3-2023. I also covered the first release of PowerScale provider here.
Here is a summary of the Dell Terraform Provider versions released over the last two quarters:
- v1.1 and v1.2 of the provider for PowerScale
- v1.3 and v1.4 of the provider for PowerFlex
- v1.3 and v1.4 of the provider for PowerStore
- v1.2 of the Provider for OME
- v1.1 and v1.2 of the Provider for Redfish
PowerScale Provider v1.1 and v1.2
PowerScale received the most number of new Terraform capabilities in the last few months. New resources and corresponding data sources have been under the following workflow categories:
- Data Management
- User and Access Management
- Cluster Management
Data management
Following is the summary for the different resource-datasource pairs introduced to automate operations related to Data management on PowerScale:
Snapshots: CRUD operations for Snapshots
Here's an example of how to create a snapshot resource within a PowerScale storage environment using Terraform:
resource "powerscale_snapshot" "example_snapshot" {
  name        = "example-snapshot"
  filesystem  = powerscale_filesystem.example_fs.id
  description = "Example snapshot description"
  // Add any additional configurations as needed
}- name: Specifies the name of the snapshot to be created.
- filesystem: References the PowerScale filesystem for which the snapshot will be created.
- description: Provides a description for the snapshot.
Here's an example of how to retrieve information about existing snapshots within a PowerScale environment using Terraform:
data "powerscale_snapshot" "existing_snapshot" {
  name = "existing-snapshot"
}

output "snapshot_id" {
  value = data.powerscale_snapshot.existing_snapshot.id
}- name: Specifies the name of the existing snapshot to query.
Snapshot schedules: CRUD operations for Snapshot schedules
Following is an example of how to define a snapshot schedule resource:
resource "powerscale_snapshot_schedule" "example_schedule" {
  name                = "example-schedule"
  filesystem          = powerscale_filesystem.example_fs.id
  snapshot_type       = "weekly"
  retention_policy    = "4 weeks"
  snapshot_start_time = "23:00"
  // Add any additional configurations as needed
}- name: Specifies the name of the snapshot schedule.
- filesystem: References the PowerScale filesystem for which the snapshot schedule will be applied.
- snapshot_type: Specifies the type of snapshot schedule, such as "daily", "weekly", and so on.
- retention_policy: Defines the retention policy for the snapshots created by the schedule.
- snapshot_start_time: Specifies the time at which the snapshot creation process should begin.
Data Source Example:
The following example shows how to retrieve information about existing snapshot schedules within a PowerScale environment using Terraform. The powerscale_snapshot_schedule data source fetches information about the specified snapshot schedule. An output is defined to display the ID of the retrieved snapshot schedule:
data "powerscale_snapshot_schedule" "existing_schedule" {
  name = "existing-schedule"
}

output "schedule_id" {
  value = data.powerscale_snapshot_schedule.existing_schedule.id
}- name: Specifies the name of the existing snapshot schedule to query.
File Pool Policies: CRUD operations for File Pool Policies
File policies in PowerScale help establish policy-based workflows like file placement and tiering of files that match certain criteria. Following is an example of how the new file pool policy resource can be configured:
resource "powerscale_filepool_policy" "example_filepool_policy" {
  name = "filePoolPolicySample"
  is_default_policy = false

  file_matching_pattern = {
    or_criteria = [
      {
        and_criteria = [

          {
            operator = ">"
            type     = "size"
            units    = "B"
            value    = "1073741824"
          },
          {
            operator          = ">"
            type              = "birth_time"
             use_relative_time = true
            value             = "20"
          },
          {
            operator          = ">"
            type              = "metadata_changed_time"
             use_relative_time = false
            value             = "1704742200"
          },
          {
            operator          = "<"
            type              = "accessed_time"
             use_relative_time = true
            value             = "20"
          }
        ]
      },
      {
        and_criteria = [
          {
            operator          = "<"
            type              = "changed_time"
             use_relative_time = false
            value             = "1704820500"
          },
          {
             attribute_exists = false
            field            = "test"
            type             = "custom_attribute"
            value            = ""
          },
          {
            operator = "!="
            type     = "file_type"
            value    = "directory"
          },
          {
             begins_with    = false
            case_sensitive = true
            operator       = "!="
            type           = "path"
            value          = "test"
          },
          {
            case_sensitive = true
            operator       = "!="
            type           = "name"
            value          = "test"
          }
        ]
      }
    ]
  }
  # A list of actions to be taken for matching files. (Update Supported)
  actions = [

    {
       data_access_pattern_action = "concurrency"
      action_type                = "set_data_access_pattern"
    },
    {
       data_storage_policy_action = {
        ssd_strategy = "metadata"
        storagepool  = "anywhere"
      }
      action_type = "apply_data_storage_policy"
    },
    {
       snapshot_storage_policy_action = {
        ssd_strategy = "metadata"
        storagepool  = "anywhere"
      }
      action_type = "apply_snapshot_storage_policy"
    },
    {
       requested_protection_action = "default"
      action_type                 = "set_requested_protection"
    },
    {
       enable_coalescer_action = true
      action_type             = "enable_coalescer"
    },
    {
      enable_packing_action = true,
      action_type           = "enable_packing"
    },
    {
      action_type = "set_cloudpool_policy"
       cloudpool_policy_action = {
         archive_snapshot_files = true
        cache = {
          expiration = 86400
          read_ahead = "partial"
          type       = "cached"
        }
        compression                  = true
        data_retention               = 604800
        encryption                   = true
         full_backup_retention        = 145152000
         incremental_backup_retention = 145152000
        pool                         = "cloudPool_policy"
         writeback_frequency          = 32400
      }
    }
  ]

  description = "filePoolPolicySample description"

  apply_order = 1
}
You can import existing file pool policies using the file pool policy ID:
terraform import powerscale_filepool_policy.example_filepool_policy <policyID>
or by simply referencing the default policy:
terraform import powerscale_filepool_policy.example_filepool_policy is_default_policy=true
The data source can be used to get a handle to a particular file pool policy:
data "powerscale_filepool_policy" "example_filepool_policy" {
  filter {
    # Optional list of names to filter upon
    names = ["filePoolPolicySample", "Default policy"]
  }
}
or to get the complete list of policies including the default policy:
data "powerscale_filepool_policy" "all" {
}
You can then deference into the data structure as needed.
User and Access management
Following is a summary of the different resource-datasource pairs introduced to automate operations related to User and Access management on PowerScale:
LDAP Providers: CRUD operations
To create and manage LDAP providers, you can use the new resource as follows:
resource "powerscale_ldap_provider" "example_ldap_provider" {
  # Required params for creating and updating.
  name = "ldap_provider_test"
  # root of the tree in which to search identities.
  base_dn = "dc=tthe,dc=testLdap,dc=com"
  # Specifies the server URIs. Begin URIs with ldap:// or ldaps://
  server_uris = ["ldap://10.225.108.54"]
}
You can import existing LDAP providers using the provider name:
terraform import powerscale_ldap_provider.example_ldap_provider <ldapProviderName>
and also get a handle using the corresponding data source using a variety of criteria:
data "powerscale_ldap_provider" "example_ldap_provider" {
  filter {
    names = ["ldap_provider_name"]
    # If specified as "effective" or not specified, all fields are returned. If specified as "user", only fields with non-default values are shown. If specified as "default", the original values are returned.
    scope = "effective"
  }
}
ACL Settings: CRUD operations
PowerScale OneFS provides very powerful ACL capabilities, including a single namespace for multi-protocol access and its own internal ACL representation to perform access control. The internal ACL is presented as protocol-specific views of permissions so that NFS exports display POSIX mode bits for NFSv3 and shows ACL for NFSv4 and SMB. Now, we have a new resource to manage the global ACL settings for a given cluster:
resource "powerscale_aclsettings" "example_acl_settings" {
  # Optional fields both for creating and updating
  # Please check the acceptable inputs for each setting in the documentation
  #     access                  = "windows"
  #     calcmode                = "approx"
  #     calcmode_group          = "group_aces"
  #     calcmode_owner          = "owner_aces"
  #     calcmode_traverse       = "ignore"
  #     chmod                   = "merge"
  #     chmod_007               = "default"
  #     chmod_inheritable       = "no"
  #     chown                   = "owner_group_and_acl"
  #     create_over_smb         = "allow"
  #     dos_attr                = "deny_smb"
  #     group_owner_inheritance = "creator"
  #     rwx                     = "retain"
  #     synthetic_denies        = "remove"
  #     utimes                  = "only_owner"
}
Import is supported, and there is corresponding data source for the resource as well.
Smart Quotas: CRUD operations
Following is an example that shows how to define a quota resource:
resource "powerscale_quota" "example_quota" {
  name         = "example-quota"
  filesystem   = powerscale_filesystem.example_fs.id
  size         = "10GB"
  soft_limit   = "8GB"
  hard_limit   = "12GB"
  grace_period = "7d"
  // Add any additional configurations as needed
}- name: Specifies the name of the quota.
- filesystem: References the PowerScale filesystem to associate with the quota.
- size: Sets the size of the quota.
- soft_limit: Defines the soft limit for the quota.
- hard_limit: Defines the hard limit for the quota.
- grace_period: Specifies the grace period for the quota.
Data Source Example:
The following code snippet illustrates how to retrieve information about existing smart quotas within a PowerScale environment using Terraform. The powerscale_quota data source fetches information about the specified quota. An output is defined to display the ID of the retrieved quota:
data "powerscale_quota" "existing_quota" {
  name = "existing-quota"
}

output "quota_id" {
  value = data.powerscale_quota.existing_quota.id
}- name: Specifies the name of the existing smart quota to query.
Cluster management
Groupnet: CRUD operations
Following is an example that shows how to define a GroupNet resource:
resource "powerscale_groupnet" "example_groupnet" {
  name       = "example-groupnet"
  subnet     = powerscale_subnet.example_subnet.id
  gateway    = "192.168.1.1"
  netmask    = "255.255.255.0"
  vlan_id    = 100
  // Add any additional configurations as needed
}- name: Specifies the name of the GroupNet.
- subnet: References the PowerScale subnet to associate with the GroupNet.
- gateway: Specifies the gateway for the GroupNet.
- netmask: Defines the netmask for the GroupNet.
- vlan_id: Specifies the VLAN ID for the GroupNet.
Data Source Example:
The following code snippet illustrates how to retrieve information about existing GroupNets within a PowerScale environment using Terraform. The powerscale_groupnet data source fetches information about the specified GroupNet. An output is defined to display the ID of the retrieved GroupNet:
data "powerscale_groupnet" "existing_groupnet" {
  name = "existing-groupnet"
}

output "groupnet_id" {
  value = data.powerscale_groupnet.existing_groupnet.id
}- name: Specifies the name of the existing GroupNet to query.
Subnet: CRUD operations
Resource Example:
The following code snippet shows how to provision a new subnet:
resource "powerscale_subnet" "example_subnet" {
  name         = "example-subnet"
  ip_range     = "192.168.1.0/24"
  network_mask = 24
  gateway      = "192.168.1.1"
  dns_servers  = ["8.8.8.8", "8.8.4.4"]
  // Add any additional configurations as needed
}- name: Specifies the name of the subnet to be created.
- ip_range: Defines the IP range for the subnet.
- network_mask: Specifies the network mask for the subnet.
- gateway: Specifies the gateway for the subnet.
- dns_servers: Lists the DNS servers associated with the subnet.
Data Source Example:
The powerscale_subnet data source fetches information about the specified subnet. The following code snippet illustrates how to retrieve information about existing subnets within a PowerScale environment. An output block is defined to display the ID of the retrieved subnet:
data "powerscale_subnet" "existing_subnet" {
  name = "existing-subnet"
}

output "subnet_id" {
  value = data.powerscale_subnet.existing_subnet.id
}- name: Specifies the name of the existing subnet to query. The result is stored in the data object called existing_subnet.
Network pool
Following is an example demonstrating how to define a network pool resource:
resource "powerscale_networkpool" "example_network_pool" {
  name       = "example-network-pool"
  subnet     = powerscale_subnet.example_subnet.id
  gateway    = "192.168.1.1"
  netmask    = "255.255.255.0"
  start_addr = "192.168.1.100"
  end_addr   = "192.168.1.200"
  // Add any additional configurations as needed
}- name: Specifies the name of the network pool.
- subnet: References the PowerScale subnet to associate with the network pool.
- gateway: Specifies the gateway for the network pool.
- netmask: Defines the netmask for the network pool.
- start_addr and end_addr: Specify the starting and ending IP addresses for the network pool range.
Data Source Example:
The following code snippet illustrates how to retrieve information about existing network pools. The powerscale_networkpool data source fetches information about the specified network pool. An output is defined to display the ID of the retrieved network pool:
data "powerscale_networkpool" "existing_network_pool" {
  name = "existing-network-pool"
}

output "network_pool_id" {
  value = data.powerscale_networkpool.existing_network_pool.id
}- name: Specifies the name of the existing network pool to query.
SmartPool settings
Here's an example that shows how to configure SmartPool settings within a PowerScale storage environment using Terraform:
resource "powerscale_smartpool_settings" "example_smartpool_settings" {
  name                    = "example-smartpool-settings"
  default_policy          = "balanced"
  compression             = true
  deduplication           = true
  auto_tiering            = true
  auto_tiering_policy     = "performance"
   auto_tiering_frequency  = "weekly"
  // Add any additional configurations as needed
}- name: Specifies the name of the SmartPool settings.
- default_policy: Sets the default policy for SmartPool.
- compression: Enables or disables compression.
- deduplication: Enables or disables deduplication.
- auto_tiering: Enables or disables auto-tiering.
- auto_tiering_policy: Sets the policy for auto-tiering.
- auto_tiering_frequency: Sets the frequency for auto-tiering.
Data Source Example:
The following example shows how to retrieve information about existing SmartPool settings within a PowerScale environment using Terraform. The powerscale_smartpool_settings data source fetches information about the specified SmartPool settings. An output is defined to display the ID of the retrieved SmartPool settings:
data “powerscale_smartpool_settings” “existing_smartpool_settings” {
  name = “existing-smartpool-settings”
}

output “smartpool_settings_id” {
  value = data.powerscale_smartpool_settings.existing_smartpool_settings.id
}- name: Specifies the name of the existing SmartPool settings to query.
New resources
New resources and datasources are also available for the following entities:
- NTP Server
- NTP Settings
- Cluster Email Settings
In addition to the previously mentioned resource-datasource pairs for PowerScale Networking, an option to enable or disable “Source based networking” has been added to the Network settings resource. The corresponding datasources can retrieve this setting on a PowerScale cluster.
PowerFlex Provider v1.3 and v1.4
The following new resources and corresponding datasources have been added to PowerFlex:
Fault Sets: CRUD and Import operations
The following is an example that shows how to define a Fault Set resource within a PowerFlex storage environment using Terraform:
resource "powerflex_fault_set" "example_fault_set" {
  name           = "example-fault-set"
  protection_domain_id = powerflex_protection_domain.example_pd.id
  fault_set_type = "RAID-1"
  // Add any additional configurations as needed
}- name: Specifies the name of the Fault Set.
- protection_domain_id: References the PowerFlex Protection Domain to associate with the Fault Set.
- fault_set_type: Defines the type of Fault Set, such as "RAID-1".
If you would like to bring an existing fault set resource into Terraform state management, you can import it using the fault set id:
terraform import powerflex_fault_set.fs_import_by_id "<id>"
Data Source Example:
The following code snippet illustrates how to retrieve information about existing Fault Sets within a PowerFlex environment using Terraform. The powerflex_fault_set data source fetches information about the specified Fault Set. An output is defined to display the ID of the retrieved Fault Set:
Ldata "powerflex_fault_set" "existing_fault_set" {
  name = "existing-fault-set"
}

output "fault_set_id" {
  value = data.powerflex_fault_set.existing_fault_set.id
}- name: Specifies the name of the existing Fault Set to query.
Snapshot policies: CRUD operations
- Snapshot policy resource – create, update, and delete.
- Snapshot policy data source – to get information of an existing policy.
Two new data sources
- powerflex_node: to get complete information related to a PowerFlex node firmware, hardware, and node health details.
- powerflex_template: this is a massive object that has information categorized into multiple groups within this object.
OME Provider v1.2
Following are the new resources to support Firmware baselining and compliance that have been added to the Dell OME Provider:
- Firmware Catalog
- Firmware Baselines
Firmware Catalog
Here is an example of how the catalog resource can be used to create or update catalogs:
# Resource to manage a new firmware catalog
resource "ome_firmware_catalog" "firmware_catalog_example" {
  # Name of the catalog required
  name = "example_catalog_1"

  # Catalog Update Type required.
  # Sets to Manual or Automatic on schedule catalog updates of the catalog.
  # Defaults to manual.
  catalog_update_type = "Automatic"

  # Share type required.
  # Sets the different types of shares (DELL_ONLINE, NFS, CIFS, HTTP, HTTPS)
  # Defaults to DELL_ONLINE
  share_type = "HTTPS"

  # Catalog file path, required for share types (NFS, CIFS, HTTP, HTTPS)
  # Start directory path without leading '/' and use alphanumeric characters.
  catalog_file_path = "catalogs/example_catalog_1.xml"

  # Share Address required for share types (NFS, CIFS, HTTP, HTTPS)
  # Must be a valid ipv4 (x.x.x.x), ipv6(xxxx:xxxx:xxxx:xxxx:xxxx:xxxx:xxxx:xxxx), or fqdn(example.com)
  # And include the protocol prefix ie (https://)
  share_address = "https://1.2.2.1"

  # Catalog refresh schedule, Required for catalog_update_type Automatic.
  # Sets the frequency of the catalog refresh.
  # Will be ignored if catalog_update_type is set to manual.
  catalog_refresh_schedule = {
    # Sets to (Weekly or Daily)
    cadence = "Weekly"
    # Sets the day of the week (Monday, Tuesday, Wednesday, Thursday, Friday, Saturday, Sunday)
    day_of_the_week = "Wednesday"
    # Sets the hour of the day (1-12)
    time_of_day = "6"
    # Sets (AM or PM)
    am_pm = "PM"
  }

  # Domain optional value for the share (CIFS), for other share types this will be ignored
  domain = "example"

  # Share user required value for the share (CIFS), optional value for the share (HTTPS)
  share_user = "example-user"

  # Share password required value for the share (CIFS), optional value for the share (HTTPS)
  share_password = "example-pass"
}
Existing catalogs can be imported into the Terraform state with the import command:
# terraform import ome_firmware_catalog.cat_1 <id>
terraform import ome_firmware_catalog.cat_1 1
After running the import command, populate the name field in the config file to start managing this resource.
Firmware Baseline
Here is an example that shows how a baseline can be compared to an array of individual devices or device groups:
# Resource to manage a new firmware baseline
resource "ome_firmware_baseline" "firmware_baseline" {
  // Required Fields
  # Name of the catalog
  catalog_name = "tfacc_catalog_dell_online_1"
  # Name of the Baseline
  name = "baselinetest"

  // Only one of the following fields (device_names, group_names , device_service_tags) is required
  # List of the Device names to associate with the firmware baseline.
  device_names = ["10.2.2.1"]

  # List of the Group names to associate with the firmware baseline.
  # group_names = ["HCI Appliances","Hyper-V Servers"]

  # List of the Device service tags to associate with the firmware baseline.
  # device_service_tags = ["HRPB0M3"]

  // Optional Fields
  // This must always be set to true. The size of the DUP files used is 64 bits."
  #is_64_bit = true

  // Filters applicable updates where no reboot is required during create baseline for firmware updates. This field is set to false by default.
   #filter_no_reboot_required = true

  # Description of the firmware baseline
  description = "test baseline"
}
Although the resource supports terraform import, in most cases a new baseline can be created using a Firmware catalog entry.
Following is a list of new data sources and supported operations in Terraform Provider for Dell OME:
- Firmware Repository
- Firmware Baseline Compliance Report
- Firmware Catalog
- Device Compliance Report
RedFish Provider v1.1 and 1.2
Several new resources have been added to the Redfish provider to access and set different iDRAC attribute sets. Following are the details:
Certificate Resource
This is a resource for the import of the ssl certificate to iDRAC based on the input parameter Type. After importing the certificate, the iDRAC will automatically restart. By default, iDRAC comes with a self-signed certificate for its web server. If the user wants to replace with his/her own server certificate (signed by Trusted CA), two kinds of SSL certificates are supported: (1) Server certificate and (2) Custom certificate. Following are the steps to generate these certificates:
- Server Certificate:
- Generate the CSR from iDRAC.
- Create the certificate using CSR and sign with trusted CA.
- The certificate should be signed with hashing algorithm equivalent to sha256
- Custom Certificate:
- An externally created custom certificate which can be imported into the iDRAC.
- Convert the external custom certificate into PKCS#12 format, and it should be encoded via base64. The conversion requires passphrase which should be provided in 'passphrase' attribute.
Boot Order Resource
This Terraform resource is used to configure Boot Order and enable/disable Boot Options of the iDRAC Server. We can read the existing configurations or modify them using this resource.
Boot Source Override Resource
This Terraform resource is used to configure Boot sources of the iDRAC Server. If the state in boot_source_override_enabled is set once or continuous, the value is reset to disabled after the boot_source_override_target actions have completed successfully. Changes to these options do not alter the BIOS persistent boot order configuration.
Manager Reset
This resource is used to reset the manager.
Lifecycle Controller Attributes Resource
This Terraform resource is used to get and set the attributes of the iDRAC Lifecycle Controller.
System Attributes Resource
This Terraform resource is used to configure System Attributes of the iDRAC Server. We can read the existing configurations or modify them using this resource. Import is also supported for this resource to include existing System Attributes in Terraform state.
iDRAC Firmware Update Resource
This Terraform resource is used to update the firmware of the iDRAC Server based on a catalog entry.
Resources
Here are the link sets for key resources for each of the Dell Terraform providers:
- Provider for PowerScale
- Provider for PowerFlex
- Provider for PowerStore
- Provider for Redfish
Author: Parasar Kodati, Engineering Technologist, Dell ISG