


Processing Six Human 50x WGS per day with 3rd Gen Intel Xeon Scalable Processors
Mon, 24 May 2021 22:07:44 -0000
|Read Time: 0 minutes
Related Blog Posts
Six Years of Tower Servers: Accelerate Business Insights with AI Inferencing and the PowerEdge T560

Mon, 13 Nov 2023 19:44:02 -0000
|Read Time: 0 minutes
Tasked with describing PowerEdge tower servers in three words, ChatGPT landed on, “Reliable. Versatile, Scalable,” perfectly capturing the key qualities of PowerEdge towers. In the following blog, we’ll cover scalability in terms of – you guessed it – AI inferencing workloads.
Our deep learning and AI inferencing benchmarks revealed the PowerEdge T560 to perform up to 15.8x better than the T440 and up to 3.8x better than the T550. Even with over triple the performance, the T560 had nearly 74% lower latency compared to the T550 for the same workload. The rest of this blog highlights why the 2-socket T560 is well-suited for AI inferencing on CPU and provides greater detail behind the benchmarks – TensorFlow and OpenVINO – we tested in our lab.
In case you missed it in our last post, we covered exceptional database workload performance gains across the PowerEdge T440, T550, and T560. Make sure to give that a read to learn how these towers represent six years of innovation since the launch of 14th Generation PowerEdge servers.
PowerEdge towers and AI – a perfect pair
Databases, businesses applications, and virtualization are use cases commonly associated with tower servers. While the PowerEdge tower portfolio is designed to accelerate these more traditional workloads, it simultaneously matches the exploding business demand for AI solutions. In fact, IDC projects $154 billion in global AI spending this year, with retail and banking topping the industries with the greatest AI investment.
It is important to note that not all AI workloads look the same; they vary widely in scope and necessary compute power. Use cases range from predicting cancerous regions on CT scans to identifying the most trafficked aisles in a retail store. Irrespective of the specific application, McKinsey reveals organizations that adopted AI for specific functions in 2022 are already seeing a return on investment in 2023. Specifically, across all functions, an average of 59% of organizations report revenue increases from AI adoption and 42% report cost decreases.
Whether a business has a clearly defined need for AI compute power or anticipates having one in the future, the PowerEdge T560 scales with evolving industry demands. The key product features that drive the PowerEdge T560’s “AI-readiness” include:
- 2x Intel® Xeon® Scalable Processors
- Up to six single-width or two double-width GPUs
- PCle Gen 5 and DDR5 memory
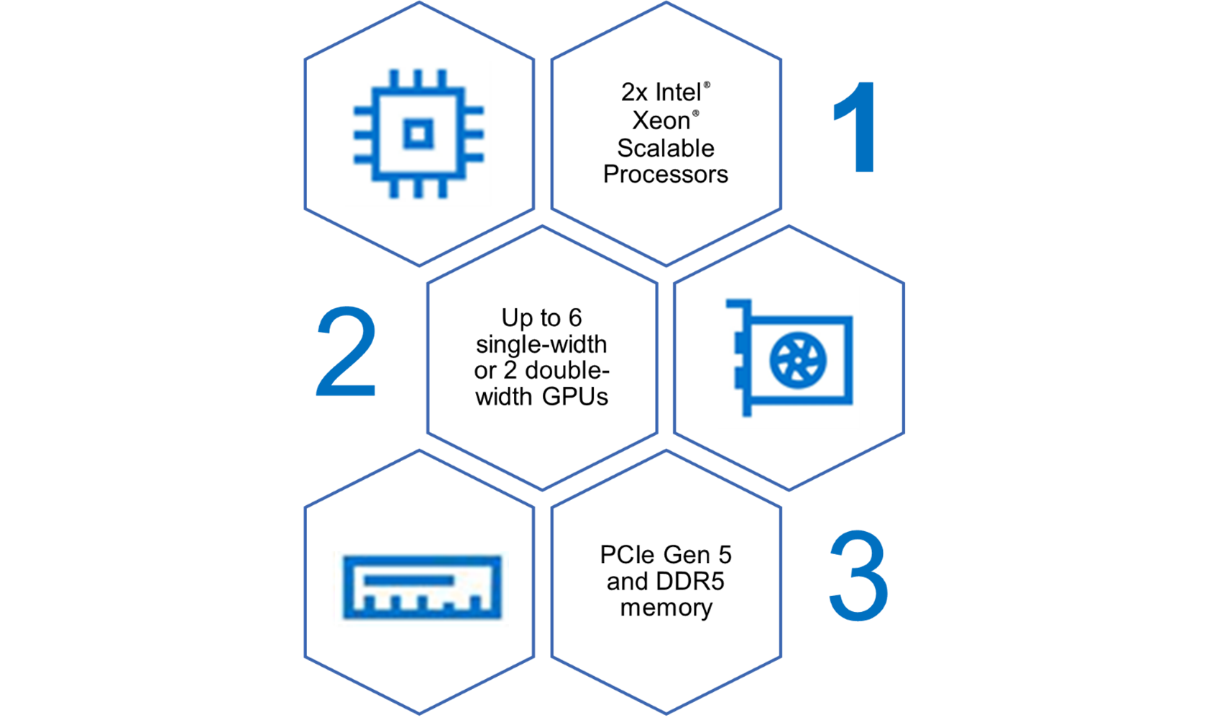
Figure 1. PowerEdge T560 AI accelerators
Testing details and benchmark information
For our testing, we evaluated two AI inferencing performance benchmarks, TensorFlow and Intel’s OpenVINO, on the PowerEdge T440, T550, and T560 using Phoronix Test Suites. Inferencing, a subset of AI workloads, refers to the use of input data and an associated trained model to make real-time predictions. Common applications include detecting faces and monitoring traffic for incoming vehicles and pedestrians.
Both TensorFlow and OpenVINO are image-based, and we ran both on CPU. All systems tested were equipped with Intel® Xeon® processors, which is especially relevant to inferencing given that Intel reports “up to 70% of CPUs installed for inferencing are Intel Xeon processors.” While the T560’s GPU capacity allows businesses to scale up their AI workloads, our results show that inferencing on CPU alone still lends itself to impressive performance.
The full testing configurations are listed in the following table. Each system has a Gold-class Intel® Xeon® processor, equal memory capacity, and storage to reflect industry transitions. All testing was conducted in a Dell Technologies lab.
Note: We set the System Profile in BIOS setting to “Performance” on all systems, which has shown to boost out-of-the-box performance by up to 10%. Check out this paper for more details and other ways to simply and quickly optimize your AI workload performance.
Table 1. Testing configurations
| PowerEdge T440 | PowerEdge T550 | PowerEdge T560 |
CPU | Intel® Xeon® Gold 5222 4c/8T, TDP 105W | Intel® Xeon® Gold 6338N 32c/64T, TDP 185W | Intel® Xeon® Gold 6448Y 32c/64T, TDP 225W |
Storage | 4x 800 GB SAS SSD (RAID 5) | 4x 960 GB SAS SSD | 4x 1.6TB NVMe |
Memory | 512 GB DDR4
| 512 GB DDR4 | 512 GB DDR5 |
PowerEdge T560 inferencing performance “clean sweep”
We report TensorFlow inferencing performance results for three common deep learning architectures: AlexNet, VGG-16, and RestNet-50. Performance – or in this case throughput – is measured by the number of images processed every second. The higher the images per second value, the better the inferencing performance.
As shown in Figure 1, the PowerEdge T560 processed significantly more images per second compared to both prior-gen towers and across all three architectures. Most notably, the T560 demonstrated up to 318% higher throughput than the T440.
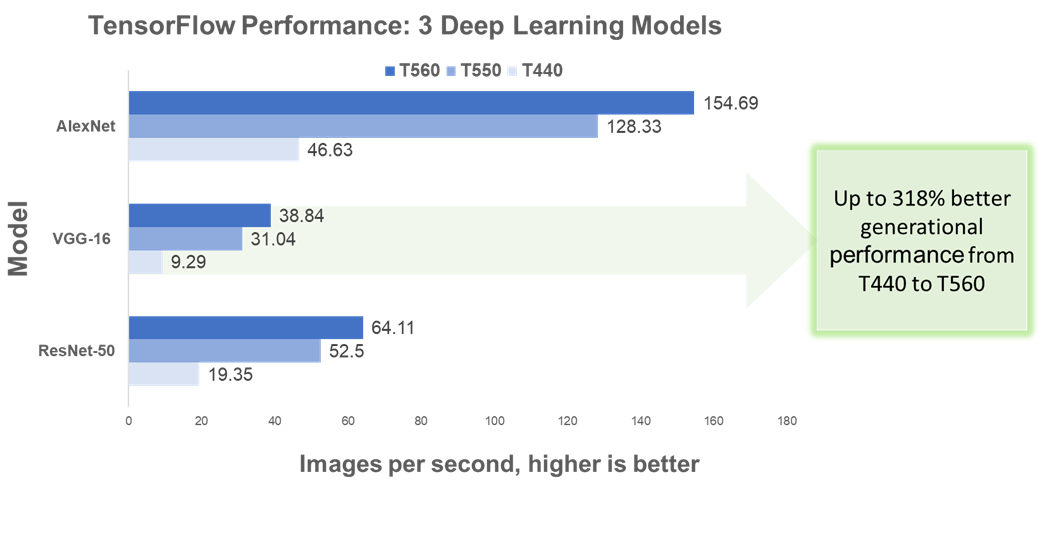
Figure 2. TensorFlow benchmark performance
Table 2 provides more details about the performance improvements across all systems and architectures tested.
Table 2. TensorFlow benchmark results
| T440 to T550 | T550 to T560 | T440 to T560 |
CPU-Batch Size[1]-Architecture | Percent Uplift in Throughput | ||
CPU -512- ResNet-50 | 171.32% | 22.11% | 231.32% |
CPU -512- VGG-16 | 234.12% | 25.13% | 318.08% |
CPU – 16 - AlexNet | 175.21% | 20.54% | 231.74% |
In a similar vein, we report OpenVINO performance results for four computer vision use cases:
- Person Detection
- Face Detection
- Age & Gender Recognition in Retail
- Person, Vehicle & Bike Detection
Performance is measured by both throughput in number of frames processed per second (FPS) and latency in milliseconds (ms). The higher the FPS value, the better the inferencing performance. Conversely, a lower latency indicates a quicker system response and therefore better performance.
The figures below illustrate changes in FPS for the four use cases across all three generations of tower servers. For Face Detection specifically, the T560 has 15.8x the FPS compared to the T440 and almost 4x the FPS compared to the T550.
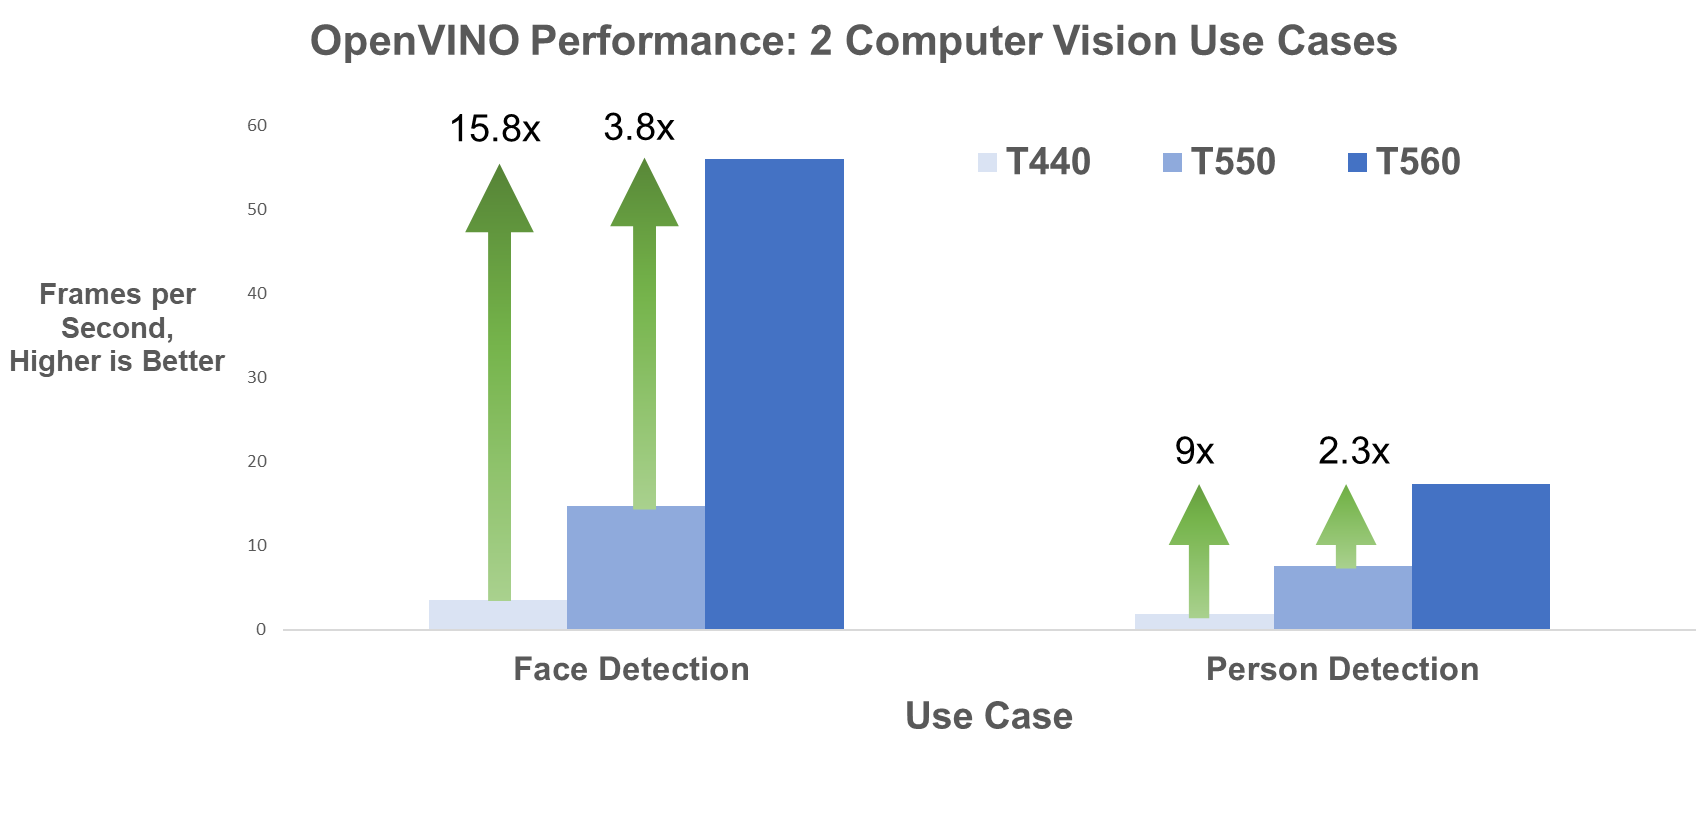
Figure 3. Face Detection and Person Detection OpenVINO FPS
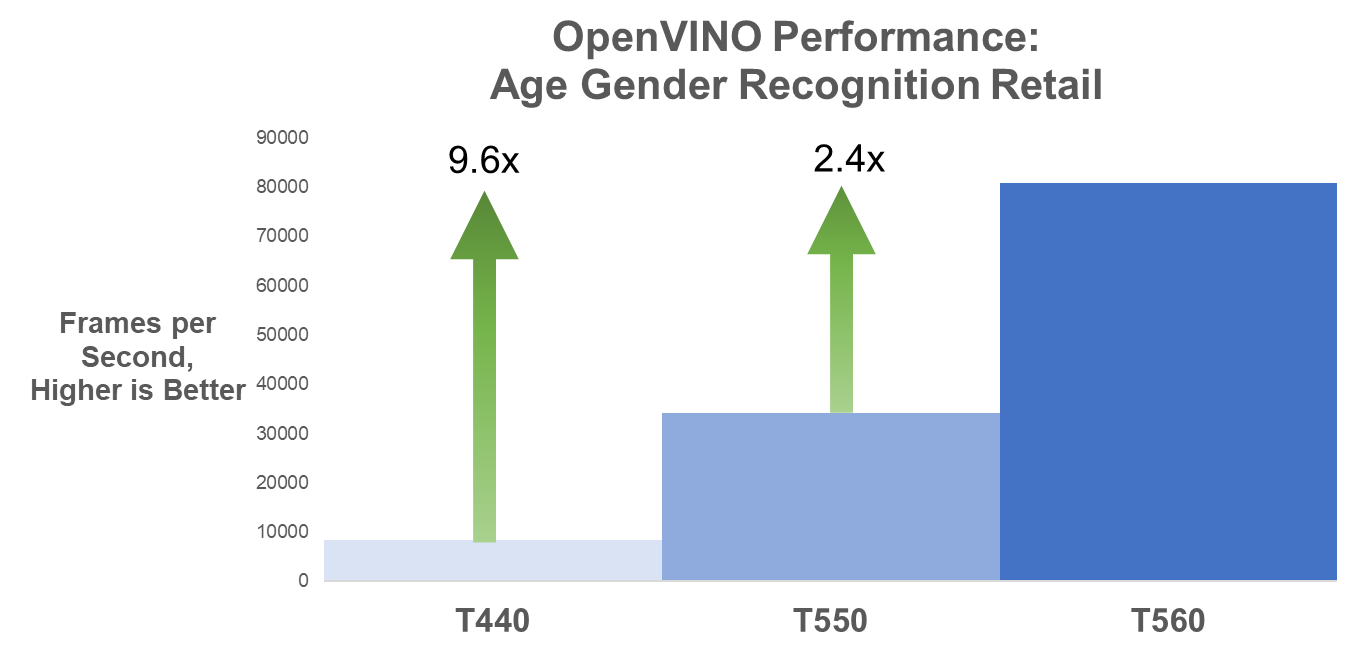
Figure 4. Age Gender Recognition Retail OpenVINO FPS
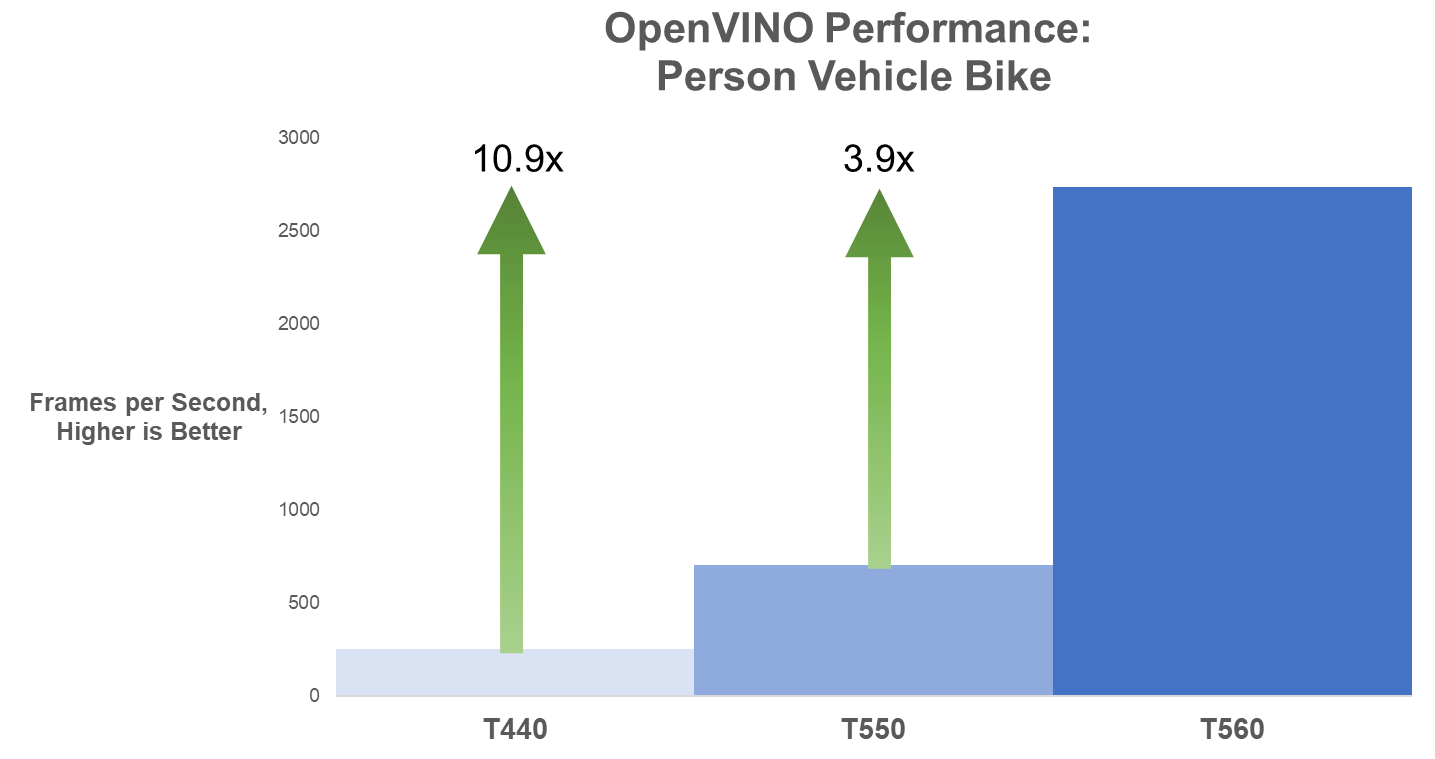
Figure 5. Person Vehicle Bike Detection OpenVINO FPS
The following table provides the FPS values for the use cases and all three systems tested.
Table 3. OpenVINO frames per second results
| PowerEdge T440 | PowerEdge T550 | PowerEdge T560 |
Model | Throughput in Frames per Second, More is Better | ||
Face Detection FP16 | 3.54 | 14.77 | 55.94 |
Person Detection FP16 | 1.94 | 7.6 | 17.37 |
Person Vehicle Bike Detection FP16 | 249.62
| 701.76 | 2732.94 |
Age Gender Recognition Retail FP16 | 8396.74 | 34131.92 | 80733.72 |
Lastly, the T560 reduces inferencing latency by up to 73% compared to the T550 on these same models, as illustrated in Figure 6.
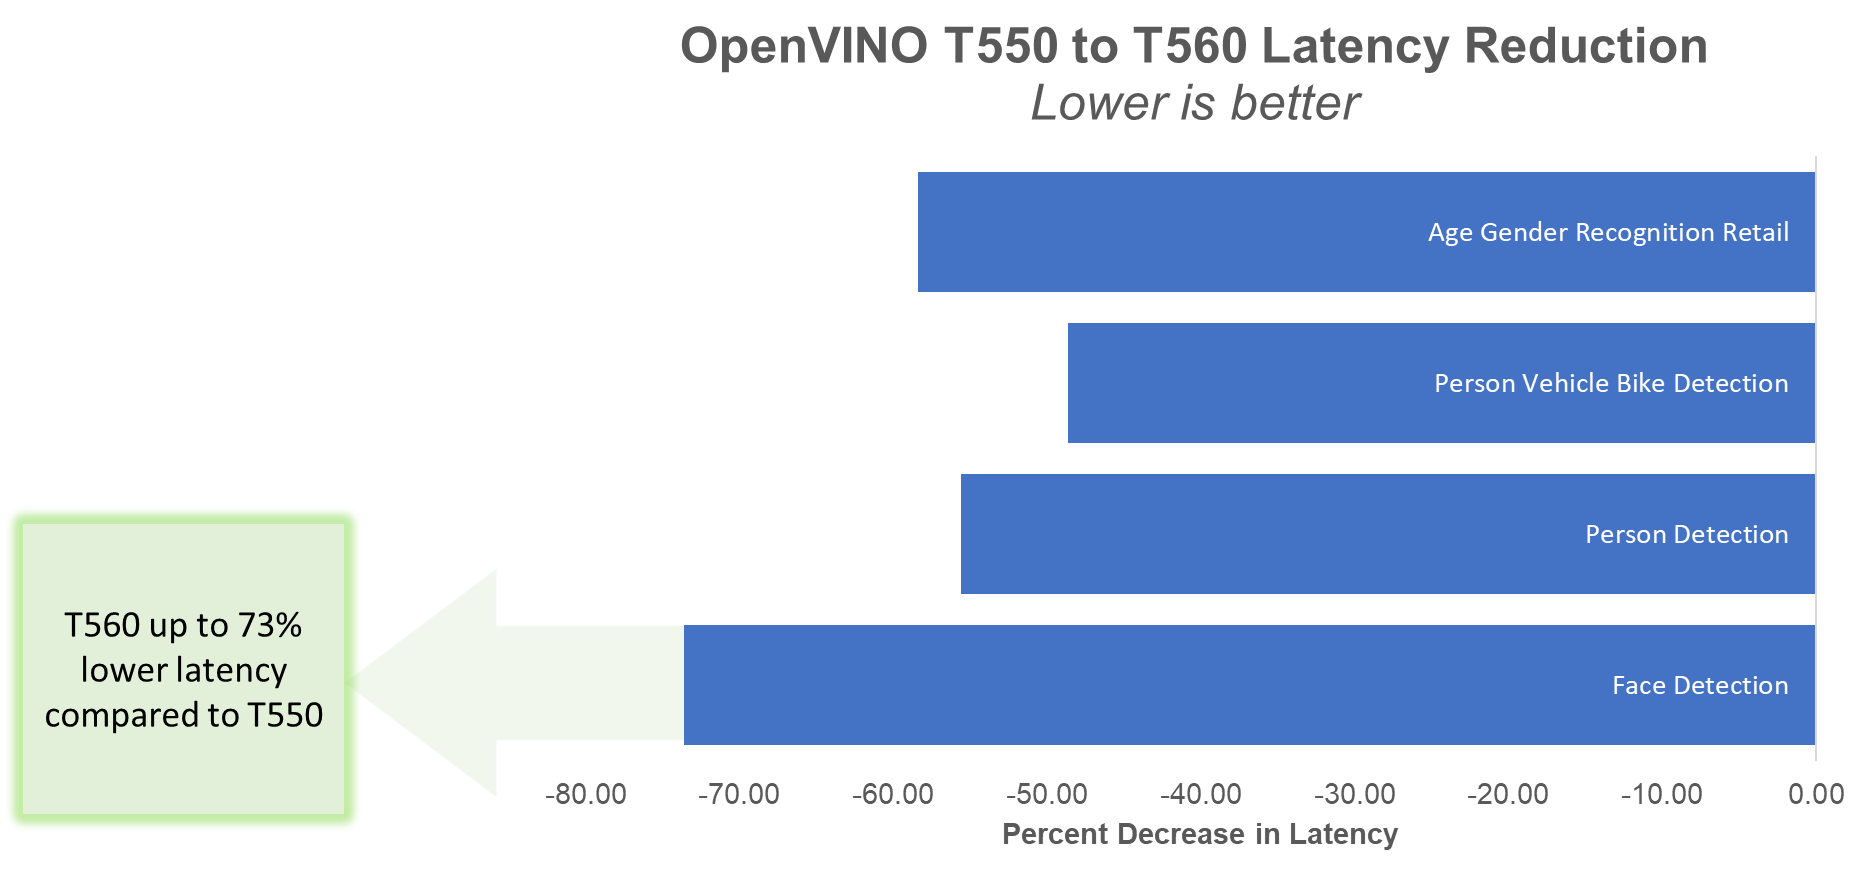
Figure 6. Percent decrease in latency
The following table presents the latency values in ms for the T550 and T560.
Table 4. OpenVINO latency results
| PowerEdge T550 | PowerEdge T560 | Latency Reduction from T550 to T560 |
Model | Latency in ms, Less is Better | Reduction | |
Face Detection | 2164.53 | 570.48 | -73.64% |
Person Detection | 4130.79 | 1833.29 | -55.62% |
Person Vehicle Bike Detection | 45.56 | 23.4 | -48.64% |
Age Gender Recognition Retail | 1.73 | 0.72 | -58.38% |
Concluding Thoughts
Emerging AI workloads have taken numerous industries by storm, and the latest-gen PowerEdge T560 is built for businesses looking to scale up and reap the benefits of AI-generated insights. Between support for 4th Gen Intel® Xeon® Scalable Processors, up to 6 graphics cards, and DDR5 memory, this tower can handle both CPU- and GPU-heavy use cases.
Our recent AI inferencing testing on CPU revealed the PowerEdge T560 has:
 Up to 318% percent better inferencing performance than the T440 for the TensorFlow benchmark
 Up to 15.8x the inferencing performance compared to the T440 and almost 4x the performance compared to the T550 for the OpenVINO benchmark
 Up to 73% lower latency compared to the T550 for the OpenVINO benchmark
While this concludes our blog series on “Six Years of Tower Servers,” we hope we have left you wanting to learn more about the PowerEdge T560. Don’t forget to check out our previous blog detailing exceptional database workload performance gains across tower servers. We’ll part ways with this short unboxing video for a look under the lid of the server:
Resources
- Six Years of Tower Servers: Exceptional Database Performance with PowerEdge T560 | Dell Technologies Info Hub
- Worldwide Spending on AI-Centric Systems Forecast to Reach $154 Billion in 2023, According to IDC
- The state of AI in 2023: Generative AI’s breakout year | McKinsey
- Tensorflow Benchmark - OpenBenchmarking.org
- OpenVINO Benchmark - OpenBenchmarking.org
- Optimize Inference with Intel® CPU Technology
[1] This is a manually set parameter, ranging from 16 to 512. Read about the parameter meaning here.
Legal Disclosures
Based on September 2023 Dell labs testing subjecting the PowerEdge T440, T550, and T560 tower servers to AI inference benchmarks – OpenVINO and TensorFlow via the Phoronix Test Suite. Actual results will vary.
Authors: Olivia Mauger, Jeremy Johnson, Delmar Hernandez | Compute Tech Marketing
Discover Your Servers’ Untapped AI Potential: PowerEdge Offering Accelerated AI Adoption
Wed, 24 Apr 2024 15:32:16 -0000
|Read Time: 0 minutes
Imagine a world where machines comprehend our needs before we even express them—where AI drives innovation, and data centers form the beating heart of cutting-edge technology. That world is becoming increasingly lucid with every passing hour. In a world where technology is advancing at lightning speed, artificial intelligence (AI) has emerged as a game-changer. By delivering solutions that range from self-driving cars to personalized recommendations, AI is transforming industries and changing lives. But with great power comes great demand for computing resources. As the thirst for AI-driven solutions grows, so does the need for powerful servers that can handle the intense computational demands. The journey to this AI-driven utopia starts with a simple question: How can we turbocharge existing servers to tackle the AI revolution?
And what if we told you that the solution lies within your very own data center? That's right. The key to unlocking the true power of AI workloads might be hiding in plain sight. Welcome to the world of Dell PowerEdge servers.
At Dell Labs, we are obsessed with innovation. Our team of passionate engineers embarked on a mission to push the boundaries of what our PowerEdge servers could do. And boy, did we make a discovery that left us in awe!
By exploring the depths of server BIOS settings and fine-tuning them for AI workloads, we witnessed an astounding transformation. The performance boost was nothing short of extraordinary. Our engineers tinkered with these BIOS settings and uncovered hidden gems. These BIOS settings, often used for multitasking, proved to be the secret sauce for AI inferencing tasks. When we thoroughly tested industry-standard AI workloads against these settings, the server's performance skyrocketed like never before.
So, what does this mean for you? It means you may already have a secret weapon in your data center—Dell PowerEdge servers with Intel CPUs! Whether you're already harnessing the power of the latest PowerEdge servers or planning your next investment, our proven optimizations are set to maximize your returns. We've done rigorous testing and distilled the results into simple accessible settings that you can apply yourself. Alternatively, let us tailor your server's configuration at the point of purchase to unlock its full potential right out of the box. Imagine the possibilities: real-time facial recognition, ultra-fast data analysis, and predictions that can change the game for your business. The hidden power of your servers is waiting to be unleashed, and it's easier than you might think.
AI is the future, and you have a front-row seat to the revolution. With Dell PowerEdge servers optimized for AI workloads, you can embrace the full potential of AI without breaking a sweat. Your existing infrastructure holds the key to supercharging your journey in the fast-paced world of AI, where every advantage counts. PowerEdge servers have the untapped potential to fuel your AI ambitions like never before. The key to unlocking this hidden power lies in BIOS tuning—a simple yet powerful technique. Embrace this hidden power within your servers and join the ranks of AI pioneers to tap into the immense possibilities that await. The future is now, and your Dell PowerEdge servers are ready to lead the way.
Ready to dive into the secrets of BIOS tuning and its impact on AI performance? Our team has shared the magic of BIOS tuning with you in our comprehensive white paper. Let’s explore the fascinating world of AI together and see what's possible when you unleash the full power of your Dell PowerEdge servers.
To learn more about this groundbreaking solution and how it can revolutionize AI, see this Direct from Development Tech Note: Unlock the Power of PowerEdge Servers for AI Workloads: Experience Up to 177% Performance Boost!
Author:
Shreena Bhati, Product Management Intern