


PowerFlex Native Asynchronous Replication RPO with Oracle
Tue, 18 Aug 2020 17:07:05 -0000
|Read Time: 0 minutes
PowerFlex software-defined storage platform provides a reliable, high-performance foundation for mission-critical applications like Oracle databases. In many of these deployments, replication and disaster recovery have become a common practice for protecting critical data and ensuring application uptime. In this blog, I will be discussing strategies for replicating mission-critical Oracle databases using Dell EMC PowerFlex software-defined storage.
The Role of Replication and Disaster Recovery in Enterprise Applications
Customers require Disaster Recovery and Replication capabilities to meet mission-critical business requirements where SLAs require the highest uptime. Customers also want the ability to quickly recover from physical or logical disasters to ensure business continuity in the event of disaster and be able to bring up the applications in minimal time without impact to data. Replication means that the same data is available at multiple locations. For Oracle database environments, it is important to have local and remote replicas of application data which are suitable for testing, development, reporting, and disaster recovery and many other operations. Replication improves the performance and protects the availability of Oracle database application because the data exists in another location. Advantages of having multiple copies of data being present across geographies is that, critical business applications will continue to function if the local Oracle database server experiences a failure.
Replication enables customers in various scenarios such as:
- Disaster Recovery for applications ensuring business continuity
- Distributing with one type of use case such as analytics
- Offloading for mission-critical workloads such as BI, Analytics, Data Warehousing, ERP, MRP, and so on
- Data Migration
- Disaster Recovery testing
PowerFlex Software-Defined Storage – Flexibility Unleashed
PowerFlex is a software-defined storage platform designed to significantly reduce operational and infrastructure complexity, empowering organizations to move faster by delivering flexibility, elasticity, and simplicity with predictable performance and resiliency at scale. The PowerFlex family provides a foundation that combines compute as well as high performance storage resources in a managed unified fabric.
PowerFlex is designed to provide extreme performance and massive scalability up to 1000s of nodes. It can be deployed as a disaggregated storage / compute (two-layer), HCI (single-layer), or a mixed architecture. PowerFlex inclusively supports applications ranging from bare-metal workloads and virtualized machines to cloud-native containerized apps. It is widely used for large-scale mission-critical applications like Oracle database. For information about best practices for deploying Oracle RAC on PowerFlex, see Oracle RAC on PowerFlex rack.
PowerFlex also offers several enterprise-class native capabilities to protect critical data at various levels:
- Storage Disk layer: PowerFlex storage distributed data layout scheme is designed to maximize protection and optimize performance. A single volume is divided into chunks. These chunks will be striped on physical disks throughout the cluster, in a balanced and random manner. Each chunk has a total of two copies for redundancy.
- Fault Sets: By implementing Fault sets, we can ensure the persistent data availability at all time. PowerFlex (previously VxFlex OS) will mirror data for a Fault Set on SDSs that are outside the Fault Set. Thus, availability is assured even if all the servers within one Fault Set fail simultaneously. Fault Sets are subgroup of SDSs installed on host servers within a Protection Domain.
PowerFlex replication overview
PowerFlex software consists of a few important components - Meta Data Manager (MDM), Storage Data Server (SDS), Storage Data Client (SDC) and Storage Data Replicator (SDR). MDM manages the PowerFlex system as a whole, which includes metadata, devices mapping, volumes, snapshots, system capacity, errors and failures, system rebuild and rebalance tasks. SDS is the software component that enables a node to contribute its local storage to the aggregated PowerFlex pool. SDC is a lightweight device driver that exposes PowerFlex volumes as block devices to the applications and hosts. SDR handles the replication activities. PowerFlex has a unique feature called Protection Domain. A Protection Domain is a logical entity that contains a group of SDSs. Each SDS belongs to only one Protection Domain.
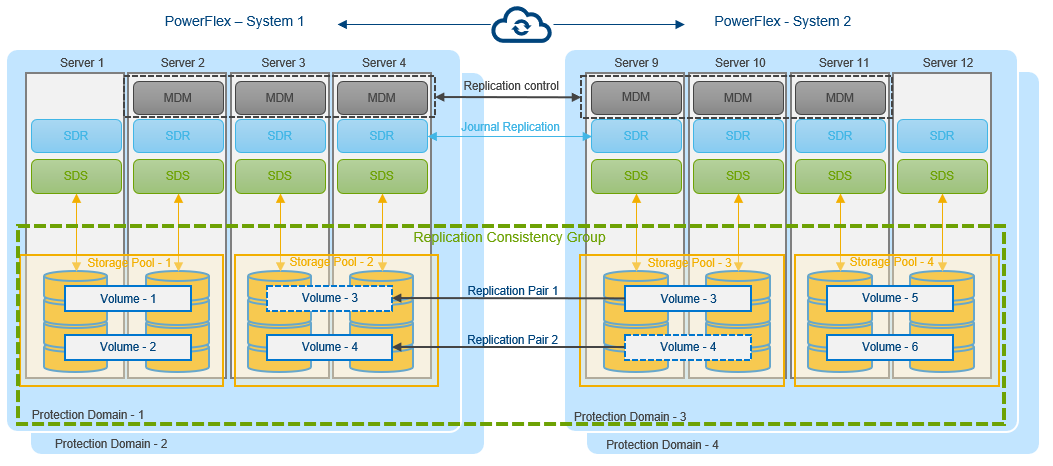
Figure 1. PowerFlex asynchronous replication between two systems
Replication occurs between two PowerFlex systems designated as peer systems. These peer systems are connected using LAN or WAN and are physically separated for protection purposes. Replication is defined in scope of a protection domain. All objects which participate in replication are contained in the protection domain, including volumes in Replication Consistency Group (RCG). Journal capacity from storage pools in the protection domain is shared among RCGs in the protection domain.
The SDR handles replication activities and manages I/O of replicated logical volumes. The SDR is deployed on the same server as SDS. Only I/Os from replicated volumes flows through SDR.
Replication Data Flow
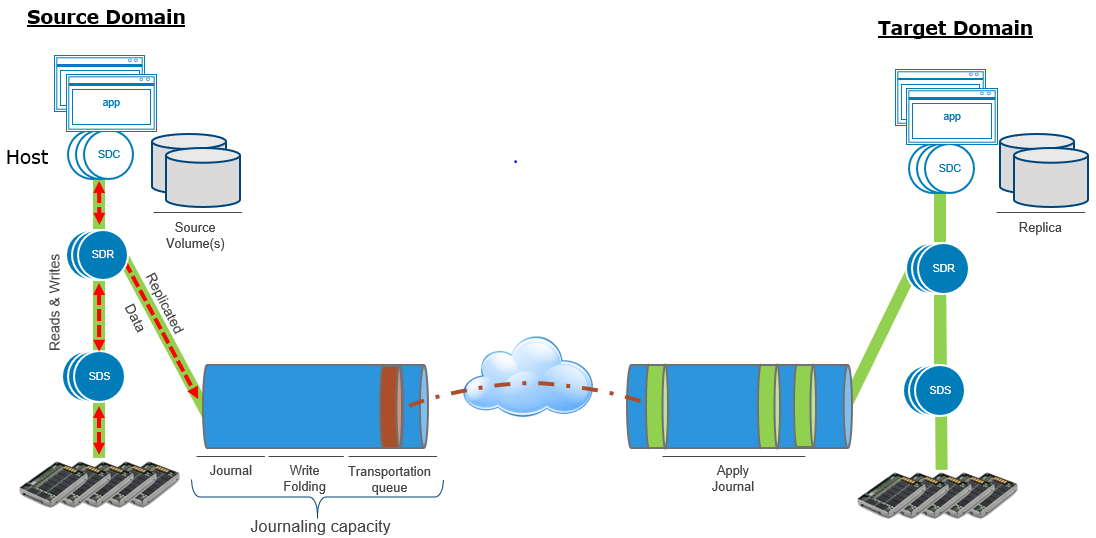
Figure 2. PowerFlex replication I/O flow between two systems
- At the source, application I/O are passed from SDS to SDR.
- Application I/O are stored in the source journal space before it is sent to target. SDR packages I/O in bundles and sends them to the target journal space.
- Once the I/O are sent to target journal and get placed in target journal space, they are cleared from source.
- Once I/O are applied to target volumes, they are cleared from destination journal.
- For replicated volumes, SDS communicates to other SDS via SDR. For non-replicated volumes, SDS communicates directly with other SDS.
For detailed information about Architecture Overview, see Dell EMC PowerFlex: Introduction to Replication White Paper.
It is important to note that this approach to replication allows PowerFlex to support replication at extreme scales. As the number of nodes contributing storage are scaled, so are the SDR instances. As a result, this replication mechanism can scale effortlessly from 4 to 1000s of nodes while delivering RPOs as low as 30 seconds and meeting IO and throughput requirements.
Oracle Databases on PowerFlex
The following illustration demonstrates that the volumes participating in replication are grouped to form the Replication Consistency Group (RCG). RCG acts as the logical container for the volumes.
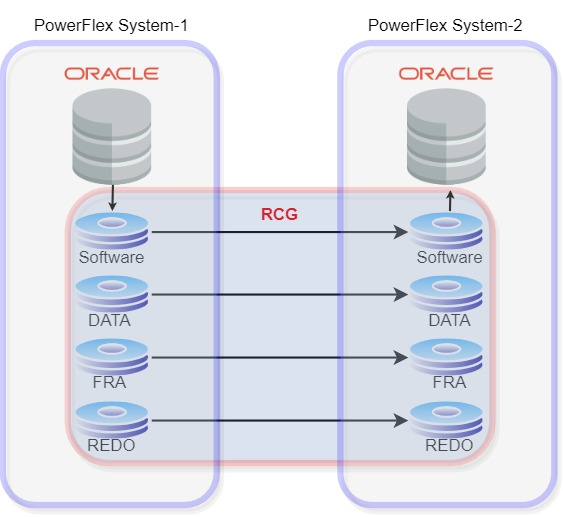
Figure 3. PowerFlex replication with Oracle database
Depending on the scenario, we can create multiple RCGs for each volume pair or combine multiple volume pairs in a single RCG.
In the above Oracle setup, PowerFlex System-1 is the source and PowerFlex System-2 is the destination. For replication to occur between the source and target, the following criteria must be met:
- A volume pair must be created in both source and target.
- Size of volumes in both source and target should be same. However, the volumes can be in different storage pools.
- Volumes are in read-write access mode on the source and read-only access mode in secondary. This is done to maintain data integrity and consistency between two peer systems.
The PowerFlex replication is designed to recover from as low as a 30 seconds RPOs minimizing the data-loss if there is a disaster recovery. During creation of RCG, users can specify RPO starting from 30 seconds to maximum of 60 minutes.
All the operations performed on source will be replicated to destination within the RPO. To ensure RPO compliance, PowerFlex replicates at least twice for every RPO period. For example, setting RPO to 30 seconds means that PowerFlex can immediately return to operation at the target system with only 30 seconds of potential data loss.
The following figures depicts the replication scenario under steady state of workload:
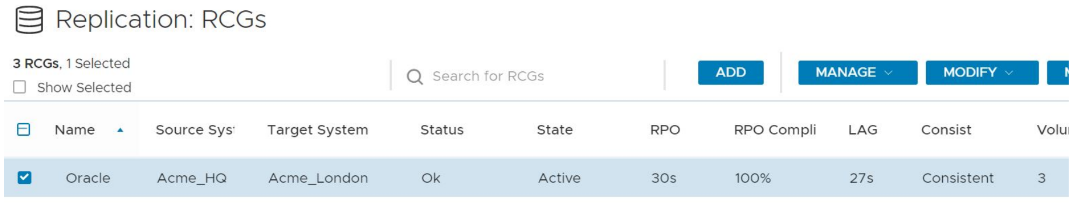
Figure 4. 100% RPO compliance for RPO of 30s for an Oracle database during a steady application workload
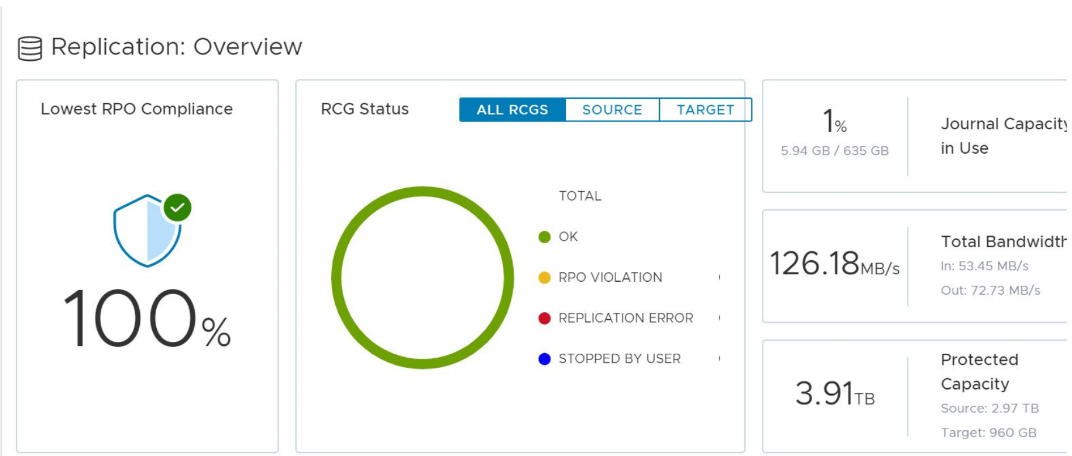
Figure 5. Replication dashboard view of PowerFlex
Disaster Recovery
In the case of disaster recovery, the entire application can be up and running by failover to secondary, with less than 30 seconds of data loss.
When we do a planned switchover or failover, the volumes on secondary system are automatically changed to read-write access mode and the volumes on source will be changed to read-only. Consequently, we can bring up Oracle database on secondary by setting up the Oracle environment variables and starting the database.
Once we have RCG in the failover or switchover mode, user can decide how to continue with replication:
- Restore replication: Maintains the replication direction from original source to destination.
- Reverse replication: Changes the direction so that original destination becomes the source and replication will begin from original destination to original source.
PowerFlex also provides various other options:
- Pause and Resume RCG: If there are network issues or user need to perform maintenance of any of the hardware. While paused, any application I/O will be stored at source journal and is replicated to the destination only after the replication is resumed.
- Freeze and Unfreeze RCG: If the user requires consistent snapshot of the source or target volumes. While frozen, replication will still occur between source journal and destination journal, nonetheless the target journal holds on to the data and do not apply them to the target volumes.
PowerFlex native volume replication is a unique solution and provides customers with easy to configure and setup without worrying about disaster.
Irrespective of workload and application, it is designed to support massive scale while providing RPOs as low as 30 seconds.
For more information, please visit: DellTechnologies.com/PowerFlex.
Related Blog Posts

Q1 2024 Update for Terraform Integrations with Dell Infrastructure

Tue, 02 Apr 2024 14:45:56 -0000
|Read Time: 0 minutes
This post covers all the new Terraform resources and data sources that have been released in the last two quarters: Q4’23 and Q1 ‘24. You can check out previous releases of Terraform providers here: Q1-2023, Q2-2023, and Q3-2023. I also covered the first release of PowerScale provider here.
Here is a summary of the Dell Terraform Provider versions released over the last two quarters:
- v1.1 and v1.2 of the provider for PowerScale
- v1.3 and v1.4 of the provider for PowerFlex
- v1.3 and v1.4 of the provider for PowerStore
- v1.2 of the Provider for OME
- v1.1 and v1.2 of the Provider for Redfish
PowerScale Provider v1.1 and v1.2
PowerScale received the most number of new Terraform capabilities in the last few months. New resources and corresponding data sources have been under the following workflow categories:
- Data Management
- User and Access Management
- Cluster Management
Data management
Following is the summary for the different resource-datasource pairs introduced to automate operations related to Data management on PowerScale:
Snapshots: CRUD operations for Snapshots
Here's an example of how to create a snapshot resource within a PowerScale storage environment using Terraform:
resource "powerscale_snapshot" "example_snapshot" {
  name        = "example-snapshot"
  filesystem  = powerscale_filesystem.example_fs.id
  description = "Example snapshot description"
  // Add any additional configurations as needed
}- name: Specifies the name of the snapshot to be created.
- filesystem: References the PowerScale filesystem for which the snapshot will be created.
- description: Provides a description for the snapshot.
Here's an example of how to retrieve information about existing snapshots within a PowerScale environment using Terraform:
data "powerscale_snapshot" "existing_snapshot" {
  name = "existing-snapshot"
}

output "snapshot_id" {
  value = data.powerscale_snapshot.existing_snapshot.id
}- name: Specifies the name of the existing snapshot to query.
Snapshot schedules: CRUD operations for Snapshot schedules
Following is an example of how to define a snapshot schedule resource:
resource "powerscale_snapshot_schedule" "example_schedule" {
  name                = "example-schedule"
  filesystem          = powerscale_filesystem.example_fs.id
  snapshot_type       = "weekly"
  retention_policy    = "4 weeks"
  snapshot_start_time = "23:00"
  // Add any additional configurations as needed
}- name: Specifies the name of the snapshot schedule.
- filesystem: References the PowerScale filesystem for which the snapshot schedule will be applied.
- snapshot_type: Specifies the type of snapshot schedule, such as "daily", "weekly", and so on.
- retention_policy: Defines the retention policy for the snapshots created by the schedule.
- snapshot_start_time: Specifies the time at which the snapshot creation process should begin.
Data Source Example:
The following example shows how to retrieve information about existing snapshot schedules within a PowerScale environment using Terraform. The powerscale_snapshot_schedule data source fetches information about the specified snapshot schedule. An output is defined to display the ID of the retrieved snapshot schedule:
data "powerscale_snapshot_schedule" "existing_schedule" {
  name = "existing-schedule"
}

output "schedule_id" {
  value = data.powerscale_snapshot_schedule.existing_schedule.id
}- name: Specifies the name of the existing snapshot schedule to query.
File Pool Policies: CRUD operations for File Pool Policies
File policies in PowerScale help establish policy-based workflows like file placement and tiering of files that match certain criteria. Following is an example of how the new file pool policy resource can be configured:
resource "powerscale_filepool_policy" "example_filepool_policy" {
  name = "filePoolPolicySample"
  is_default_policy = false

  file_matching_pattern = {
    or_criteria = [
      {
        and_criteria = [

          {
            operator = ">"
            type     = "size"
            units    = "B"
            value    = "1073741824"
          },
          {
            operator          = ">"
            type              = "birth_time"
             use_relative_time = true
            value             = "20"
          },
          {
            operator          = ">"
            type              = "metadata_changed_time"
             use_relative_time = false
            value             = "1704742200"
          },
          {
            operator          = "<"
            type              = "accessed_time"
             use_relative_time = true
            value             = "20"
          }
        ]
      },
      {
        and_criteria = [
          {
            operator          = "<"
            type              = "changed_time"
             use_relative_time = false
            value             = "1704820500"
          },
          {
             attribute_exists = false
            field            = "test"
            type             = "custom_attribute"
            value            = ""
          },
          {
            operator = "!="
            type     = "file_type"
            value    = "directory"
          },
          {
             begins_with    = false
            case_sensitive = true
            operator       = "!="
            type           = "path"
            value          = "test"
          },
          {
            case_sensitive = true
            operator       = "!="
            type           = "name"
            value          = "test"
          }
        ]
      }
    ]
  }
  # A list of actions to be taken for matching files. (Update Supported)
  actions = [

    {
       data_access_pattern_action = "concurrency"
      action_type                = "set_data_access_pattern"
    },
    {
       data_storage_policy_action = {
        ssd_strategy = "metadata"
        storagepool  = "anywhere"
      }
      action_type = "apply_data_storage_policy"
    },
    {
       snapshot_storage_policy_action = {
        ssd_strategy = "metadata"
        storagepool  = "anywhere"
      }
      action_type = "apply_snapshot_storage_policy"
    },
    {
       requested_protection_action = "default"
      action_type                 = "set_requested_protection"
    },
    {
       enable_coalescer_action = true
      action_type             = "enable_coalescer"
    },
    {
      enable_packing_action = true,
      action_type           = "enable_packing"
    },
    {
      action_type = "set_cloudpool_policy"
       cloudpool_policy_action = {
         archive_snapshot_files = true
        cache = {
          expiration = 86400
          read_ahead = "partial"
          type       = "cached"
        }
        compression                  = true
        data_retention               = 604800
        encryption                   = true
         full_backup_retention        = 145152000
         incremental_backup_retention = 145152000
        pool                         = "cloudPool_policy"
         writeback_frequency          = 32400
      }
    }
  ]

  description = "filePoolPolicySample description"

  apply_order = 1
}
You can import existing file pool policies using the file pool policy ID:
terraform import powerscale_filepool_policy.example_filepool_policy <policyID>
or by simply referencing the default policy:
terraform import powerscale_filepool_policy.example_filepool_policy is_default_policy=true
The data source can be used to get a handle to a particular file pool policy:
data "powerscale_filepool_policy" "example_filepool_policy" {
  filter {
    # Optional list of names to filter upon
    names = ["filePoolPolicySample", "Default policy"]
  }
}
or to get the complete list of policies including the default policy:
data "powerscale_filepool_policy" "all" {
}
You can then deference into the data structure as needed.
User and Access management
Following is a summary of the different resource-datasource pairs introduced to automate operations related to User and Access management on PowerScale:
LDAP Providers: CRUD operations
To create and manage LDAP providers, you can use the new resource as follows:
resource "powerscale_ldap_provider" "example_ldap_provider" {
  # Required params for creating and updating.
  name = "ldap_provider_test"
  # root of the tree in which to search identities.
  base_dn = "dc=tthe,dc=testLdap,dc=com"
  # Specifies the server URIs. Begin URIs with ldap:// or ldaps://
  server_uris = ["ldap://10.225.108.54"]
}
You can import existing LDAP providers using the provider name:
terraform import powerscale_ldap_provider.example_ldap_provider <ldapProviderName>
and also get a handle using the corresponding data source using a variety of criteria:
data "powerscale_ldap_provider" "example_ldap_provider" {
  filter {
    names = ["ldap_provider_name"]
    # If specified as "effective" or not specified, all fields are returned. If specified as "user", only fields with non-default values are shown. If specified as "default", the original values are returned.
    scope = "effective"
  }
}
ACL Settings: CRUD operations
PowerScale OneFS provides very powerful ACL capabilities, including a single namespace for multi-protocol access and its own internal ACL representation to perform access control. The internal ACL is presented as protocol-specific views of permissions so that NFS exports display POSIX mode bits for NFSv3 and shows ACL for NFSv4 and SMB. Now, we have a new resource to manage the global ACL settings for a given cluster:
resource "powerscale_aclsettings" "example_acl_settings" {
  # Optional fields both for creating and updating
  # Please check the acceptable inputs for each setting in the documentation
  #     access                  = "windows"
  #     calcmode                = "approx"
  #     calcmode_group          = "group_aces"
  #     calcmode_owner          = "owner_aces"
  #     calcmode_traverse       = "ignore"
  #     chmod                   = "merge"
  #     chmod_007               = "default"
  #     chmod_inheritable       = "no"
  #     chown                   = "owner_group_and_acl"
  #     create_over_smb         = "allow"
  #     dos_attr                = "deny_smb"
  #     group_owner_inheritance = "creator"
  #     rwx                     = "retain"
  #     synthetic_denies        = "remove"
  #     utimes                  = "only_owner"
}
Import is supported, and there is corresponding data source for the resource as well.
Smart Quotas: CRUD operations
Following is an example that shows how to define a quota resource:
resource "powerscale_quota" "example_quota" {
  name         = "example-quota"
  filesystem   = powerscale_filesystem.example_fs.id
  size         = "10GB"
  soft_limit   = "8GB"
  hard_limit   = "12GB"
  grace_period = "7d"
  // Add any additional configurations as needed
}- name: Specifies the name of the quota.
- filesystem: References the PowerScale filesystem to associate with the quota.
- size: Sets the size of the quota.
- soft_limit: Defines the soft limit for the quota.
- hard_limit: Defines the hard limit for the quota.
- grace_period: Specifies the grace period for the quota.
Data Source Example:
The following code snippet illustrates how to retrieve information about existing smart quotas within a PowerScale environment using Terraform. The powerscale_quota data source fetches information about the specified quota. An output is defined to display the ID of the retrieved quota:
data "powerscale_quota" "existing_quota" {
  name = "existing-quota"
}

output "quota_id" {
  value = data.powerscale_quota.existing_quota.id
}- name: Specifies the name of the existing smart quota to query.
Cluster management
Groupnet: CRUD operations
Following is an example that shows how to define a GroupNet resource:
resource "powerscale_groupnet" "example_groupnet" {
  name       = "example-groupnet"
  subnet     = powerscale_subnet.example_subnet.id
  gateway    = "192.168.1.1"
  netmask    = "255.255.255.0"
  vlan_id    = 100
  // Add any additional configurations as needed
}- name: Specifies the name of the GroupNet.
- subnet: References the PowerScale subnet to associate with the GroupNet.
- gateway: Specifies the gateway for the GroupNet.
- netmask: Defines the netmask for the GroupNet.
- vlan_id: Specifies the VLAN ID for the GroupNet.
Data Source Example:
The following code snippet illustrates how to retrieve information about existing GroupNets within a PowerScale environment using Terraform. The powerscale_groupnet data source fetches information about the specified GroupNet. An output is defined to display the ID of the retrieved GroupNet:
data "powerscale_groupnet" "existing_groupnet" {
  name = "existing-groupnet"
}

output "groupnet_id" {
  value = data.powerscale_groupnet.existing_groupnet.id
}- name: Specifies the name of the existing GroupNet to query.
Subnet: CRUD operations
Resource Example:
The following code snippet shows how to provision a new subnet:
resource "powerscale_subnet" "example_subnet" {
  name         = "example-subnet"
  ip_range     = "192.168.1.0/24"
  network_mask = 24
  gateway      = "192.168.1.1"
  dns_servers  = ["8.8.8.8", "8.8.4.4"]
  // Add any additional configurations as needed
}- name: Specifies the name of the subnet to be created.
- ip_range: Defines the IP range for the subnet.
- network_mask: Specifies the network mask for the subnet.
- gateway: Specifies the gateway for the subnet.
- dns_servers: Lists the DNS servers associated with the subnet.
Data Source Example:
The powerscale_subnet data source fetches information about the specified subnet. The following code snippet illustrates how to retrieve information about existing subnets within a PowerScale environment. An output block is defined to display the ID of the retrieved subnet:
data "powerscale_subnet" "existing_subnet" {
  name = "existing-subnet"
}

output "subnet_id" {
  value = data.powerscale_subnet.existing_subnet.id
}- name: Specifies the name of the existing subnet to query. The result is stored in the data object called existing_subnet.
Network pool
Following is an example demonstrating how to define a network pool resource:
resource "powerscale_networkpool" "example_network_pool" {
  name       = "example-network-pool"
  subnet     = powerscale_subnet.example_subnet.id
  gateway    = "192.168.1.1"
  netmask    = "255.255.255.0"
  start_addr = "192.168.1.100"
  end_addr   = "192.168.1.200"
  // Add any additional configurations as needed
}- name: Specifies the name of the network pool.
- subnet: References the PowerScale subnet to associate with the network pool.
- gateway: Specifies the gateway for the network pool.
- netmask: Defines the netmask for the network pool.
- start_addr and end_addr: Specify the starting and ending IP addresses for the network pool range.
Data Source Example:
The following code snippet illustrates how to retrieve information about existing network pools. The powerscale_networkpool data source fetches information about the specified network pool. An output is defined to display the ID of the retrieved network pool:
data "powerscale_networkpool" "existing_network_pool" {
  name = "existing-network-pool"
}

output "network_pool_id" {
  value = data.powerscale_networkpool.existing_network_pool.id
}- name: Specifies the name of the existing network pool to query.
SmartPool settings
Here's an example that shows how to configure SmartPool settings within a PowerScale storage environment using Terraform:
resource "powerscale_smartpool_settings" "example_smartpool_settings" {
  name                    = "example-smartpool-settings"
  default_policy          = "balanced"
  compression             = true
  deduplication           = true
  auto_tiering            = true
  auto_tiering_policy     = "performance"
   auto_tiering_frequency  = "weekly"
  // Add any additional configurations as needed
}- name: Specifies the name of the SmartPool settings.
- default_policy: Sets the default policy for SmartPool.
- compression: Enables or disables compression.
- deduplication: Enables or disables deduplication.
- auto_tiering: Enables or disables auto-tiering.
- auto_tiering_policy: Sets the policy for auto-tiering.
- auto_tiering_frequency: Sets the frequency for auto-tiering.
Data Source Example:
The following example shows how to retrieve information about existing SmartPool settings within a PowerScale environment using Terraform. The powerscale_smartpool_settings data source fetches information about the specified SmartPool settings. An output is defined to display the ID of the retrieved SmartPool settings:
data “powerscale_smartpool_settings” “existing_smartpool_settings” {
  name = “existing-smartpool-settings”
}

output “smartpool_settings_id” {
  value = data.powerscale_smartpool_settings.existing_smartpool_settings.id
}- name: Specifies the name of the existing SmartPool settings to query.
New resources
New resources and datasources are also available for the following entities:
- NTP Server
- NTP Settings
- Cluster Email Settings
In addition to the previously mentioned resource-datasource pairs for PowerScale Networking, an option to enable or disable “Source based networking” has been added to the Network settings resource. The corresponding datasources can retrieve this setting on a PowerScale cluster.
PowerFlex Provider v1.3 and v1.4
The following new resources and corresponding datasources have been added to PowerFlex:
Fault Sets: CRUD and Import operations
The following is an example that shows how to define a Fault Set resource within a PowerFlex storage environment using Terraform:
resource "powerflex_fault_set" "example_fault_set" {
  name           = "example-fault-set"
  protection_domain_id = powerflex_protection_domain.example_pd.id
  fault_set_type = "RAID-1"
  // Add any additional configurations as needed
}- name: Specifies the name of the Fault Set.
- protection_domain_id: References the PowerFlex Protection Domain to associate with the Fault Set.
- fault_set_type: Defines the type of Fault Set, such as "RAID-1".
If you would like to bring an existing fault set resource into Terraform state management, you can import it using the fault set id:
terraform import powerflex_fault_set.fs_import_by_id "<id>"
Data Source Example:
The following code snippet illustrates how to retrieve information about existing Fault Sets within a PowerFlex environment using Terraform. The powerflex_fault_set data source fetches information about the specified Fault Set. An output is defined to display the ID of the retrieved Fault Set:
Ldata "powerflex_fault_set" "existing_fault_set" {
  name = "existing-fault-set"
}

output "fault_set_id" {
  value = data.powerflex_fault_set.existing_fault_set.id
}- name: Specifies the name of the existing Fault Set to query.
Snapshot policies: CRUD operations
- Snapshot policy resource – create, update, and delete.
- Snapshot policy data source – to get information of an existing policy.
Two new data sources
- powerflex_node: to get complete information related to a PowerFlex node firmware, hardware, and node health details.
- powerflex_template: this is a massive object that has information categorized into multiple groups within this object.
OME Provider v1.2
Following are the new resources to support Firmware baselining and compliance that have been added to the Dell OME Provider:
- Firmware Catalog
- Firmware Baselines
Firmware Catalog
Here is an example of how the catalog resource can be used to create or update catalogs:
# Resource to manage a new firmware catalog
resource "ome_firmware_catalog" "firmware_catalog_example" {
  # Name of the catalog required
  name = "example_catalog_1"

  # Catalog Update Type required.
  # Sets to Manual or Automatic on schedule catalog updates of the catalog.
  # Defaults to manual.
  catalog_update_type = "Automatic"

  # Share type required.
  # Sets the different types of shares (DELL_ONLINE, NFS, CIFS, HTTP, HTTPS)
  # Defaults to DELL_ONLINE
  share_type = "HTTPS"

  # Catalog file path, required for share types (NFS, CIFS, HTTP, HTTPS)
  # Start directory path without leading '/' and use alphanumeric characters.
  catalog_file_path = "catalogs/example_catalog_1.xml"

  # Share Address required for share types (NFS, CIFS, HTTP, HTTPS)
  # Must be a valid ipv4 (x.x.x.x), ipv6(xxxx:xxxx:xxxx:xxxx:xxxx:xxxx:xxxx:xxxx), or fqdn(example.com)
  # And include the protocol prefix ie (https://)
  share_address = "https://1.2.2.1"

  # Catalog refresh schedule, Required for catalog_update_type Automatic.
  # Sets the frequency of the catalog refresh.
  # Will be ignored if catalog_update_type is set to manual.
  catalog_refresh_schedule = {
    # Sets to (Weekly or Daily)
    cadence = "Weekly"
    # Sets the day of the week (Monday, Tuesday, Wednesday, Thursday, Friday, Saturday, Sunday)
    day_of_the_week = "Wednesday"
    # Sets the hour of the day (1-12)
    time_of_day = "6"
    # Sets (AM or PM)
    am_pm = "PM"
  }

  # Domain optional value for the share (CIFS), for other share types this will be ignored
  domain = "example"

  # Share user required value for the share (CIFS), optional value for the share (HTTPS)
  share_user = "example-user"

  # Share password required value for the share (CIFS), optional value for the share (HTTPS)
  share_password = "example-pass"
}
Existing catalogs can be imported into the Terraform state with the import command:
# terraform import ome_firmware_catalog.cat_1 <id>
terraform import ome_firmware_catalog.cat_1 1
After running the import command, populate the name field in the config file to start managing this resource.
Firmware Baseline
Here is an example that shows how a baseline can be compared to an array of individual devices or device groups:
# Resource to manage a new firmware baseline
resource "ome_firmware_baseline" "firmware_baseline" {
  // Required Fields
  # Name of the catalog
  catalog_name = "tfacc_catalog_dell_online_1"
  # Name of the Baseline
  name = "baselinetest"

  // Only one of the following fields (device_names, group_names , device_service_tags) is required
  # List of the Device names to associate with the firmware baseline.
  device_names = ["10.2.2.1"]

  # List of the Group names to associate with the firmware baseline.
  # group_names = ["HCI Appliances","Hyper-V Servers"]

  # List of the Device service tags to associate with the firmware baseline.
  # device_service_tags = ["HRPB0M3"]

  // Optional Fields
  // This must always be set to true. The size of the DUP files used is 64 bits."
  #is_64_bit = true

  // Filters applicable updates where no reboot is required during create baseline for firmware updates. This field is set to false by default.
   #filter_no_reboot_required = true

  # Description of the firmware baseline
  description = "test baseline"
}
Although the resource supports terraform import, in most cases a new baseline can be created using a Firmware catalog entry.
Following is a list of new data sources and supported operations in Terraform Provider for Dell OME:
- Firmware Repository
- Firmware Baseline Compliance Report
- Firmware Catalog
- Device Compliance Report
RedFish Provider v1.1 and 1.2
Several new resources have been added to the Redfish provider to access and set different iDRAC attribute sets. Following are the details:
Certificate Resource
This is a resource for the import of the ssl certificate to iDRAC based on the input parameter Type. After importing the certificate, the iDRAC will automatically restart. By default, iDRAC comes with a self-signed certificate for its web server. If the user wants to replace with his/her own server certificate (signed by Trusted CA), two kinds of SSL certificates are supported: (1) Server certificate and (2) Custom certificate. Following are the steps to generate these certificates:
- Server Certificate:
- Generate the CSR from iDRAC.
- Create the certificate using CSR and sign with trusted CA.
- The certificate should be signed with hashing algorithm equivalent to sha256
- Custom Certificate:
- An externally created custom certificate which can be imported into the iDRAC.
- Convert the external custom certificate into PKCS#12 format, and it should be encoded via base64. The conversion requires passphrase which should be provided in 'passphrase' attribute.
Boot Order Resource
This Terraform resource is used to configure Boot Order and enable/disable Boot Options of the iDRAC Server. We can read the existing configurations or modify them using this resource.
Boot Source Override Resource
This Terraform resource is used to configure Boot sources of the iDRAC Server. If the state in boot_source_override_enabled is set once or continuous, the value is reset to disabled after the boot_source_override_target actions have completed successfully. Changes to these options do not alter the BIOS persistent boot order configuration.
Manager Reset
This resource is used to reset the manager.
Lifecycle Controller Attributes Resource
This Terraform resource is used to get and set the attributes of the iDRAC Lifecycle Controller.
System Attributes Resource
This Terraform resource is used to configure System Attributes of the iDRAC Server. We can read the existing configurations or modify them using this resource. Import is also supported for this resource to include existing System Attributes in Terraform state.
iDRAC Firmware Update Resource
This Terraform resource is used to update the firmware of the iDRAC Server based on a catalog entry.
Resources
Here are the link sets for key resources for each of the Dell Terraform providers:
- Provider for PowerScale
- Provider for PowerFlex
- Provider for PowerStore
- Provider for Redfish
Author: Parasar Kodati, Engineering Technologist, Dell ISG

PowerFlex and CloudStack, an Amazing IaaS match!

Sat, 18 Nov 2023 14:13:00 -0000
|Read Time: 0 minutes
Have you heard about Apache CloudStack? Did you know it runs amazingly on Dell PowerFlex? And what does it all have to do with infrastructure as a service (IaaS)? Interested in learning more? If so, then you should probably keep reading!
The PowerFlex team and ShapeBlue have been collaborating to bring ease and simplicity to CloudStack on PowerFlex. They have been doing this for quite a while. As new versions are released, the teams work together to ensure it continues to be amazing for customers. The deep integration with PowerFlex makes it an ideal choice for organizations building CloudStack environments.
Both Dell and ShapeBlue are gearing up for the CloudStack Collaboration Conference (CCC) in Paris on November 23 and 24th. The CloudStack Collaboration Conference is the biggest get-together for the Apache CloudStack Community, bringing vendors, users, and developers to one place to discuss the future of open-source technologies, the benefits of CloudStack, new integrations, and capabilities.
CloudStack is open-source software designed to deploy and manage large networks of virtual machines as a highly available, highly scalable Infrastructure as a Service (IaaS) cloud computing platform. CloudStack is used by hundreds of service providers around the world to offer public cloud services and by many companies to provide an on-premises (private) cloud offering or as part of a hybrid cloud solution.
Users can manage their cloud with an easy to use Web interface, command line tools, and/or a full-featured RESTful API. In addition, CloudStack provides an API that is compatible with AWS EC2 and S3 for organizations that want to deploy hybrid clouds.
CloudStack can leverage the extensive PowerFlex REST APIs to enhance functionality. This facilitates streamlined provisioning, effective data management, robust snapshot management, comprehensive data protection, and seamless scalability, making the combination of PowerFlex storage and CloudStack a robust choice for modern IaaS environments.
You can see this in the following diagram. CloudStack and PowerFlex communicate with each other using APIs to coordinate operations for VMs. This makes it easier to administer larger environments, enabling organizations to have a true IaaS environment.
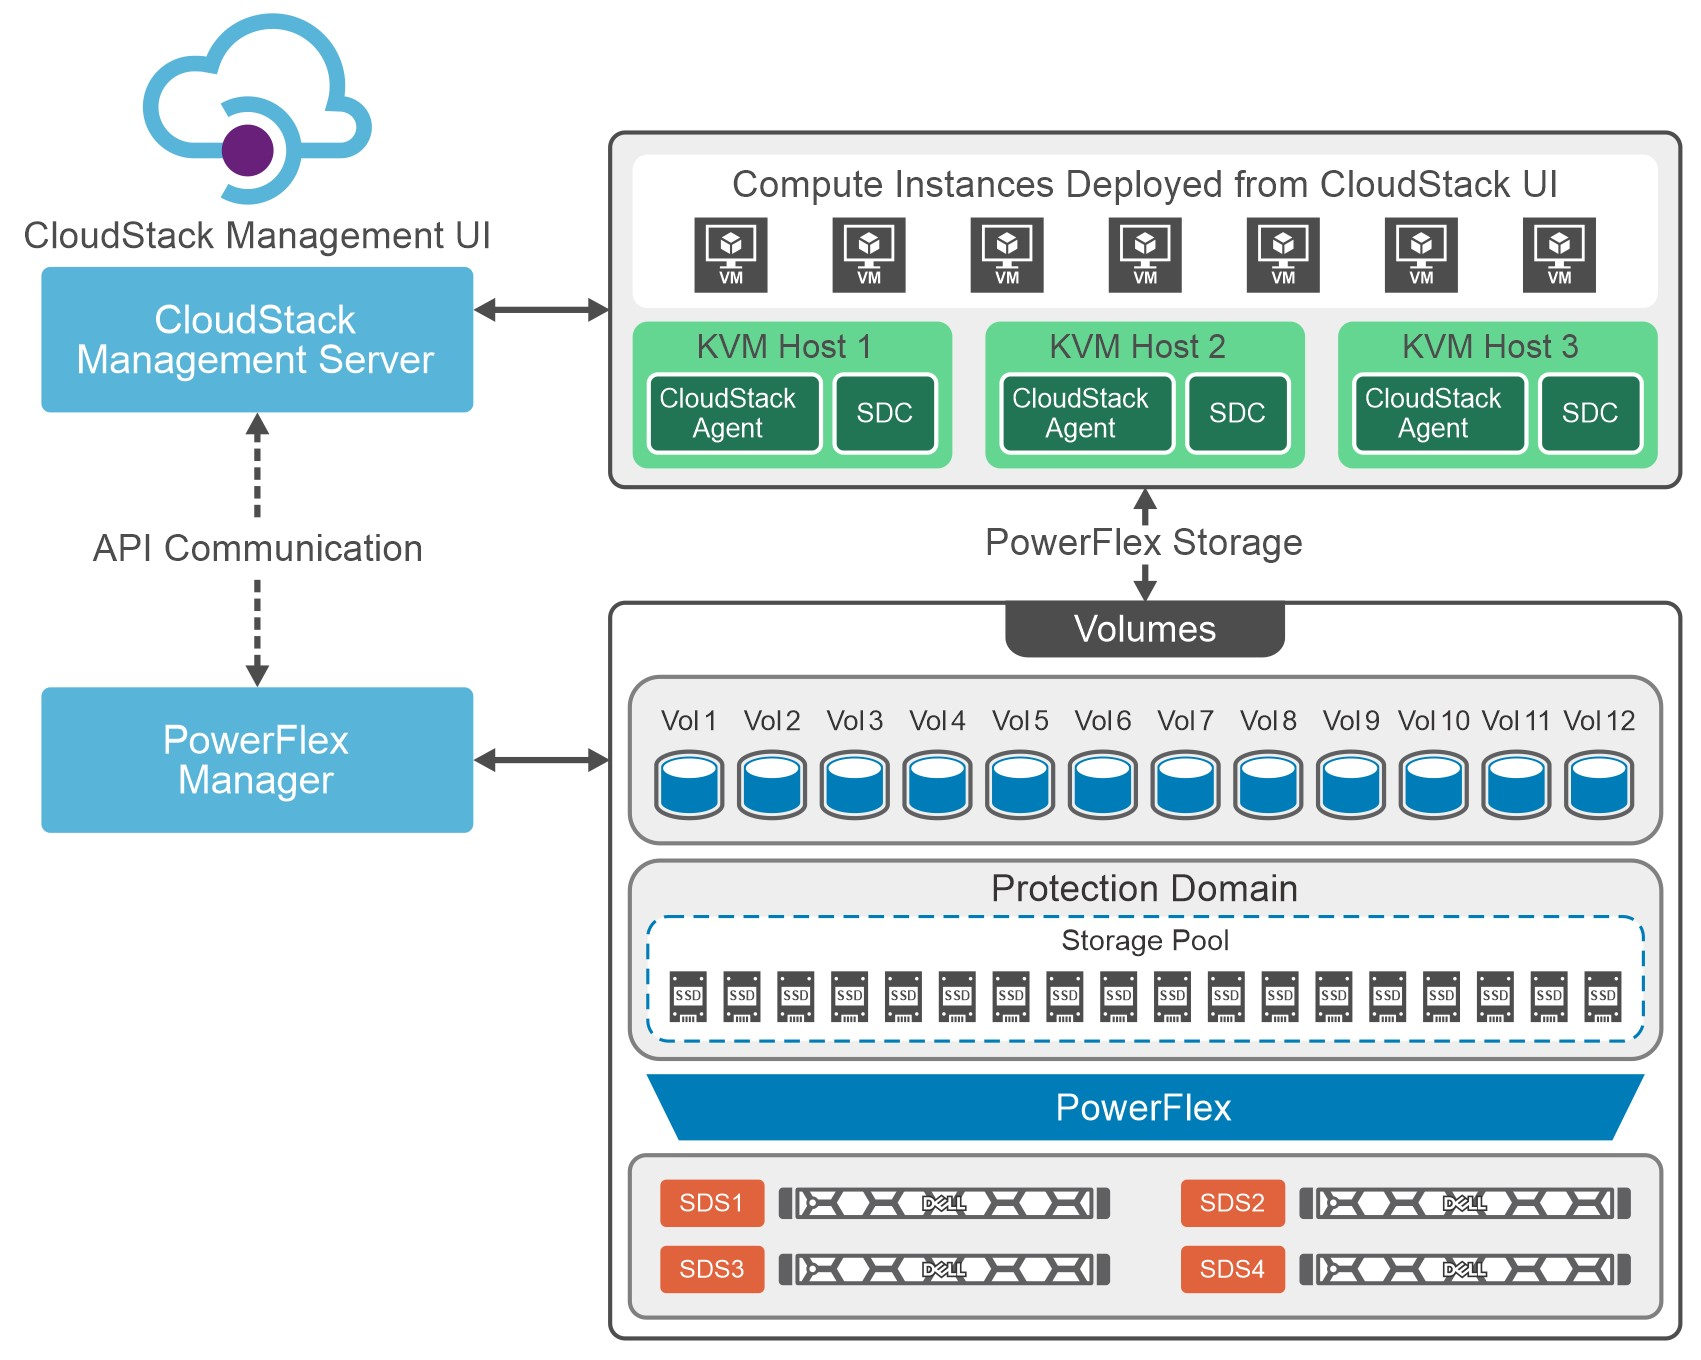
Figure 1. Cloud Stack on PowerFlex Architecture
Let's talk about IaaS for a moment. It is a fantastic concept that can be compared with ordering off a menu at a restaurant. The restaurant has unrelated dishes on the menu until you start looking at their components. For example, you can get three different base sauces (red, pink, and white) with just a red sauce and a white sauce. With a small variety of pasta and proteins, the options are excellent. This is the same for IaaS. Have a few base options, sprinkle on some API know-how, and you get a fantastic menu to satisfy workload needs without having a detailed knowledge of the infrastructure.
That makes it easier for the IT organization to become more efficient and shift the focus toward aspirational initiatives. This is especially true when CloudStack and PowerFlex work together. The hungry IT consumers can get what they want with less IT interaction.
Other significant benefits that come from integrating CloudStack with PowerFlex include the following:
- Seamless Data Management: Efficient provision, backup, and data management across infrastructure, ensuring data integrity and accessibility.
- Enhanced Performance: Provides low-latency access to data, optimizing I/O, and reducing bottlenecks. This, in turn, leads to improved application and workload performance.
- Reliability and Data Availability: Benefit from advanced redundancy and failover mechanisms and data replication, reducing the risk of data loss and ensuring continuous service availability.
- Scalability: Scalable storage solutions allow organizations to expand their storage resources in tandem with their growing needs. This flexibility ensures that they can adapt to changing workloads and resource requirements.
- Simplified Management: Ability to use a single interface to handle provisioning, monitoring, troubleshooting, and streamlining administrative tasks.
- Enhanced Data Protection: Data protection features, such as snapshots, backups, and disaster recovery solutions. This ensures that an organization's data remains secure and can be quickly restored in case of unexpected incidents.
These are tremendous benefits for organizations, especially the data protection aspects. It is often said that it is no longer a question of if an organization will be impacted by an incident. It is a question of when they will be impacted. The IaaS capabilities of CloudStack and PowerFlex play a crucial role in protecting an organization's data. That protection can be automated as part of the IaaS design. That way, when a VM or VMs are requested, they can be assigned to a data protection policy as part of the creation process.
Simply put, that means that VM can be protected from the moment of creation. No more having to remember to add a VM to a backup, and no more "oh no" when someone realizes they forgot. That is amazing!
If you are at the CloudStack Collaboration Conference and are interested in discovering more, talk with Shashi and Florian. They will also present how CloudStack and PowerFlex create an outstanding IaaS solution.
Register for the CloudStack Collaboration Conference here to join virtually if you are unable to attend in person.
If you want to learn more about how PowerFlex and CloudStack can benefit your organization, reach out to your Dell representative for more details on this amazing solution.
Resources
Authors
Tony Foster
Twitter: @wonder_nerd
LinkedIn
Punitha HS
LinkedIn