


OneFS SmartQoS Architecture and Management

The SmartQoS Protocol Ops limits architecture, introduced in OneFS 9.5, involves three primary capabilities:
- Resource tracking
- Resource limit distribution
- Throttling
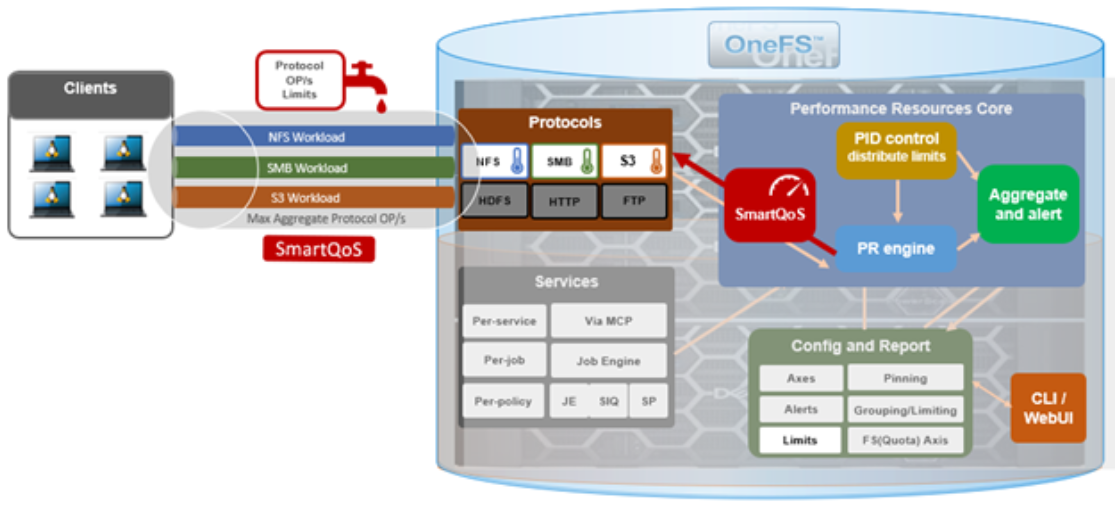
Under the hood, the OneFS protocol heads (NFS, SMB, and S3) identify and track how many protocol operations are being processed through a specific export or share. The existing partitioned performance (PP) reporting infrastructure is leveraged for cluster wide resource usage collection, limit calculation and distribution, along with new OneFS 9.5 functionality to support pinned workload protocol Ops limits.
The protocol scheduling module (LwSched) has a built-in throttling capability that allows the execution of individual operations to be delayed by temporarily pausing them, or ‘sleeping’. Additionally, in OneFS 9.5, the partitioned performance kernel modules have also been enhanced to calculate ‘sleep time’ based on operation count resource information (requested, average usage, and so on) – both within the current throttling window, and for a specific workload.
We can characterize the fundamental SmartQoS workflow as follows:
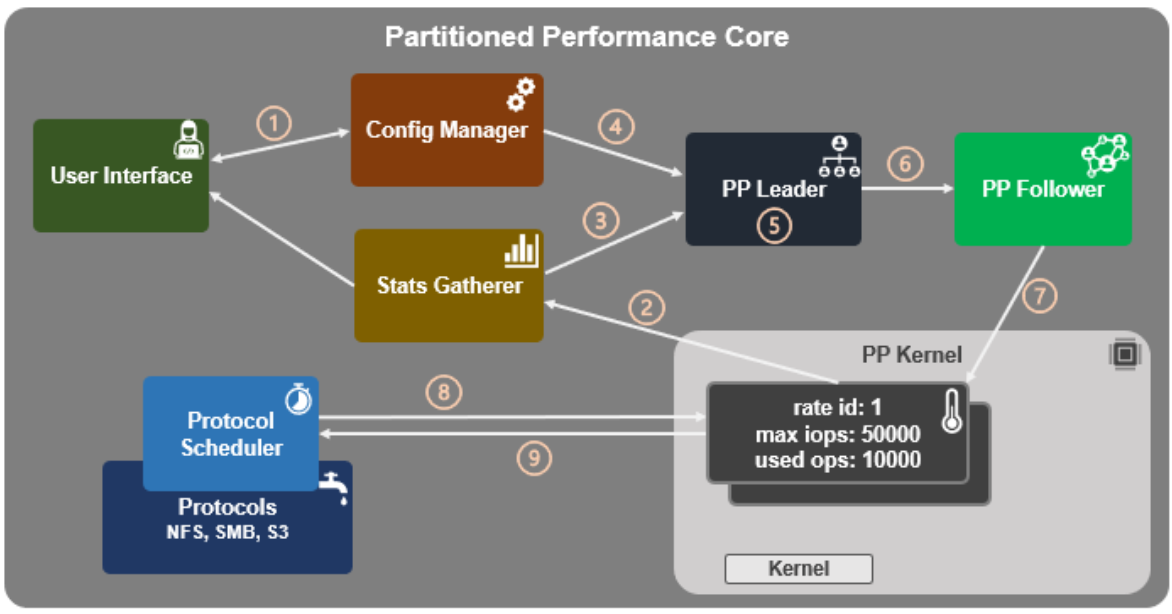
- Configuration, using the CLI, pAPI, or WebUI.
- Statistics gatherer obtains Op/s data from the partitioned performance (PP) kernel.
- Stats gatherer communicates Op/s data to PP leader service.
- Leader queries config manager for per-cluster rate limit.
- Leader calculates per-node limit.
- PP follower service is notified of per-node Op/s limit.
- Kernel is informed of new per-node limit.
- Work is scheduled with rate-limited resource.
- Kernel returns sleep time, if needed.
When an admin configures a per-cluster protocol Ops limit, the statistics gathering service, isi_stats_d, begins collecting workload resource information every 30 seconds by default from the partitioned performance (PP) kernel on each node in the cluster and notifies the isi_pp_d leader service of this resource info. Next, the leader gets the per-cluster protocol Ops limit plus additional resource consumption metrics from the isi_acct_cpp service from isi_tardis_d, the OneFS cluster configuration service and calculates the protocol Ops limit of each node for the next throttling window. It then instructs the isi_pp_d follower service on each node to update the kernel with the newly calculated protocol Ops limit, plus a request to reset the throttling window.
When the kernel receives a scheduling request for a work item from the protocol scheduler (LwSched), the kernel calculates the required ‘sleep time’ value, based on the current node protocol Ops limit and resource usage in the current throttling window. If insufficient resources are available, the work item execution thread is put to sleep for a specific interval returned from the PP kernel. If resources are available, or the thread is reactivated from sleeping, it executes the work item and reports the resource usage statistics back to PP, releasing any scheduling resources it may own.
SmartQoS can be configured through either the CLI, platform API, or WebUI, and OneFS 9.5 introduces a new SmartQoS WebUI page to support this. Note that SmartQoS is only available when an upgrade to OneFS 9.5 has been committed, and any attempt to configure or run the feature prior to upgrade commit will fail with the following message:
# isi performance workloads modify DS1 -w WS1 --limits protocol_ops:50000
 Setting of protocol ops limits not available until upgrade has been committed
When a cluster is running OneFS 9.5 and the release is committed, the SmartQoS feature is enabled by default. This, and the current configuration, can be confirmed using the following CLI command:
 # isi performance settings view
                   Top N Collections: 1024
        Time In Queue Threshold (ms): 10.0
 Target read latency in microseconds: 12000.0
Target write latency in microseconds: 12000.0
          Protocol Ops Limit Enabled: Yes
In OneFS 9.5, the ‘isi performance settings modify’ CLI command now includes a ‘protocol-ops-limit-enabled’ parameter to allow the feature to be easily disabled (or re-enabled) across the cluster. For example:
# isi performance settings modify --protocol-ops-limit-enabled false
protocol_ops_limit_enabled: True -> False
Similarly, the ‘isi performance settings view’ CLI command has been extended to report the protocol OPs limit state:
# isi performance settings view *
Top N Collections: 1024
Protocol Ops Limit Enabled: Yes
In order to set a protocol OPs limit on workload from the CLI, the ‘isi performance workload pin’ and ‘isi performance workload modify’ commands now accept an optional ‘–limits’ parameter. For example, to create a pinned workload with the ‘protocol_ops’ limit set to 10000:
# isi performance workload pin test protocol:nfs3 --limits
protocol_ops:10000
Similarly, to modify an existing workload’s ‘protocol_ops’ limit to 20000:
# isi performance workload modify test 101 --limits protocol_ops:20000
protocol_ops: 10000 -> 20000
When configuring SmartQoS, always be aware that it is a powerful throttling tool that can be applied to significant areas of a cluster’s data and userbase. For example, protocol OPs limits can be configured for metrics such as ‘path:/ifs’, which would affect the entire /ifs filesystem, or ‘zone_name:System’ which would limit the System access zone and all users within it.
While such configurations are entirely valid, they would have a significant, system-wide impact. As such, exercise caution when configuring SmartQoS to avoid any inadvertent, unintended, or unexpected performance constraints.
To clear a protocol Ops limit on workload, the ‘isi performance workload modify’ CLI command has been extended to accept an optional ‘–noprotocol-ops-limit’ argument. For example:
# isi performance workload modify test 101 --no-protocol-ops-limit
protocol_ops: 20000 -> 18446744073709551615
Note that the value of ‘18446744073709551615’ in the command output above represents ‘NO_LIMIT’ set.
You can view a workload’s protocol Ops limit by using the ‘isi performance workload list’ and ‘isi performance workload view’ CLI commands, which have been modified in OneFS 9.5 to display the limits appropriately. For example:
# isi performance workload list test
ID Name Metric Values Creation Time Impact Limits
---------------------------------------------------------------------
101 - protocol:nfs3 2023-02-02T22:35:02 - protocol_ops:20000
---------------------------------------------------------------------
# isi performance workload view test 101
ID: 101
Name: -
Metric Values: protocol:nfs3
Creation Time: 2023-02-02T22:35:02
Impact: -
Limits: protocol_ops:20000
In the next article in this series, we’ll step through an example SmartQoS configuration and verification from both the CLI and WebUI.
Author: Nick Trimbee
Related Blog Posts

OneFS SmartQoS Configuration and Setup
Tue, 14 Mar 2023 16:06:06 -0000
|Read Time: 0 minutes
In the previous article in this series, we looked at the underlying architecture and management of SmartQoS in OneFS 9.5. Next, we’ll step through an example SmartQoS configuration using the CLI and WebUI.
After an initial set up, configuring a SmartQoS protocol Ops limit comprises four fundamental steps. These are:

Step | Task | Description | Example |
1 | Identify Metrics of interest | Used for tracking, to enforce an Ops limit | Uses ‘path’ and ‘protocol’ for the metrics to identify the workload. |
2 | Create a Dataset | For tracking all of the chosen metric categories | Create the dataset ‘ds1’ with the metrics identified. |
3 | Pin a Workload | To specify exactly which values to track within the chosen metrics | path: /ifs/data/client_exports protocol: nfs3 |
4 | Set a Limit | To limit Ops based on the dataset, metrics (categories), and metric values defined by the workload | Protocol_ops limit: 100 |
Step 1:

First, select a metric of interest. For this example, we’ll use the following:
- Protocol: NFSv3
- Path: /ifs/test/expt_nfs
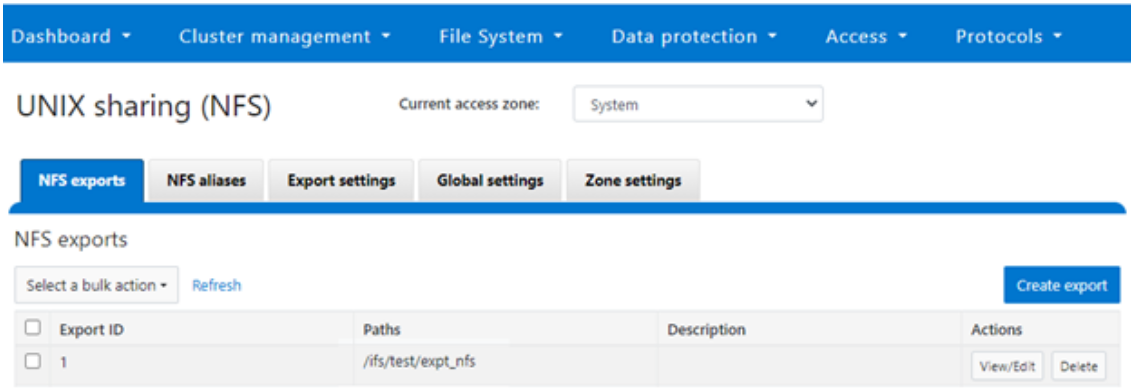
If not already present, create and verify an NFS export – in this case at /ifs/test/expt_nfs:
# isi nfs exports create /ifs/test/expt_nfs
# isi nfs exports list
ID Zone Paths Description
------------------------------------------------
1 System /ifs/test/expt_nfs
------------------------------------------------
Or from the WebUI, under Protocols UNIX sharing (NFS) > NFS exports:
Step 2:

The ‘dataset’ designation is used to categorize workload by various identification metrics, including:
ID Metric | Details |
Username | UID or SID |
Primary groupname | Primary GID or GSID |
Secondary groupname | Secondary GID or GSID |
Zone name |
|
IP address | Local or remote IP address or IP address range |
Path | Except for S3 protocol |
Share | SMB share or NFS export ID |
Protocol | NFSv3, NFSv4, NFSoRDMA, SMB, or S3 |
SmartQoS in OneFS 9.5 only allows protocol Ops as the transient resources used for configuring a limit ceiling.
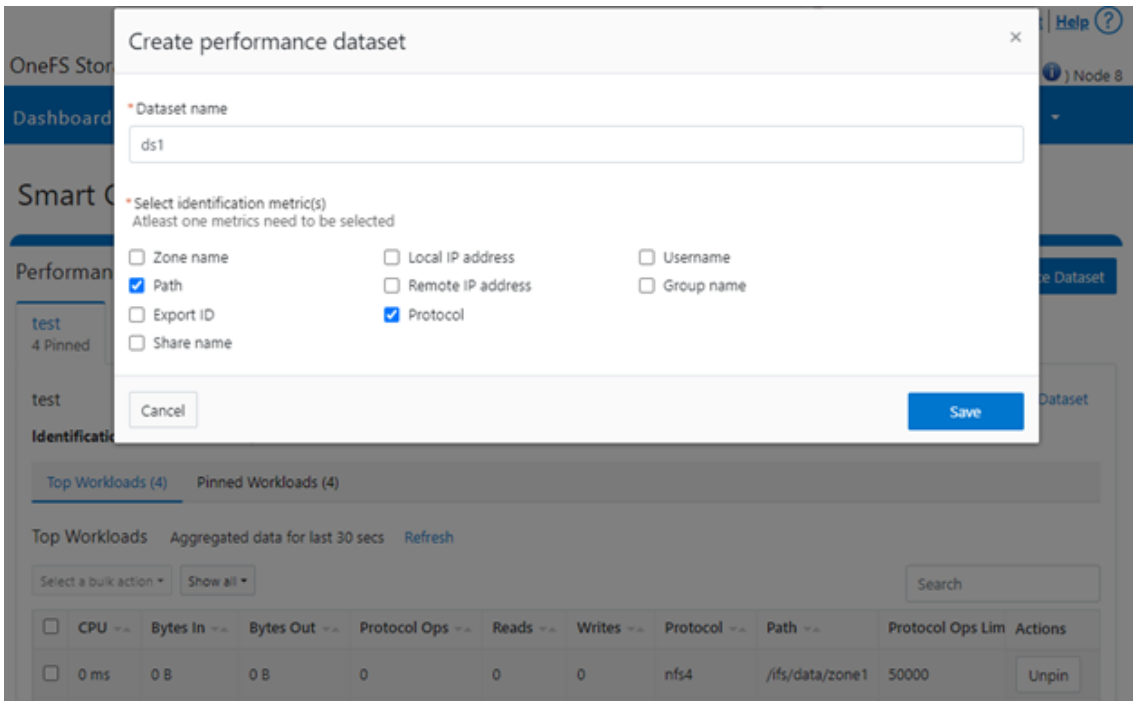
For example, you can use the following CLI command to create a dataset ‘ds1’, specifying protocol and path as the ID metrics:
# isi performance datasets create --name ds1 protocol path
Created new performance dataset 'ds1' with ID number 1.
Note: Resource usage tracking by the ‘path’ metric is only supported by SMB and NFS.
The following command displays any configured datasets:
# isi performance datasets list
Or, from the WebUI, by navigating to Cluster management > Smart QoS:
Step 3:

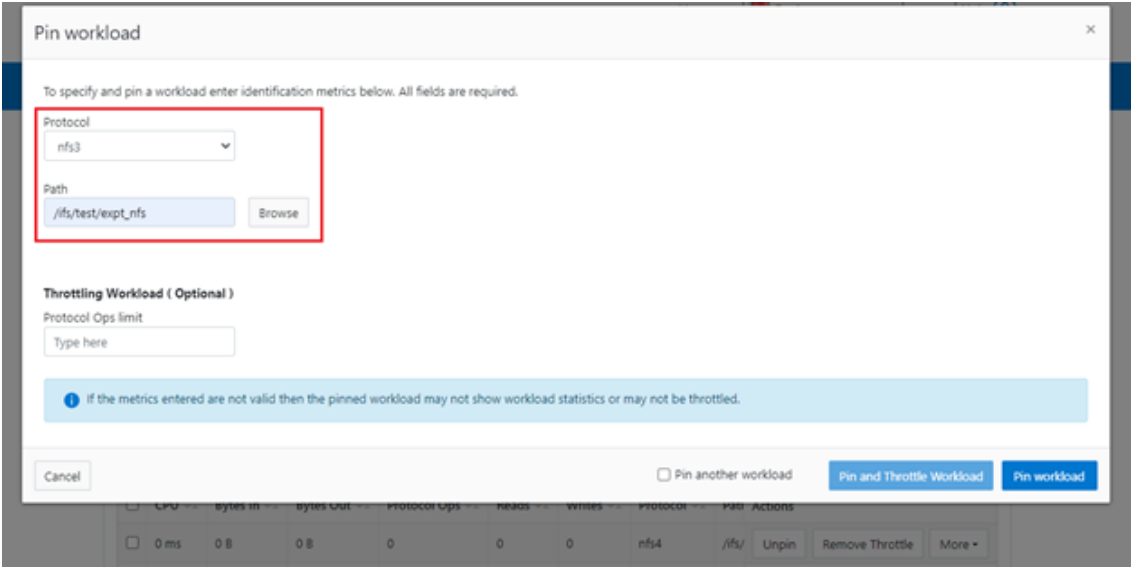
After you have created the dataset, you can pin a workload to it by specifying the metric values. For example:
# isi performance workloads pin ds1 protocol:nfs3 path: /ifs/test/expt_nfs
Pinned performance dataset workload with ID number 100.
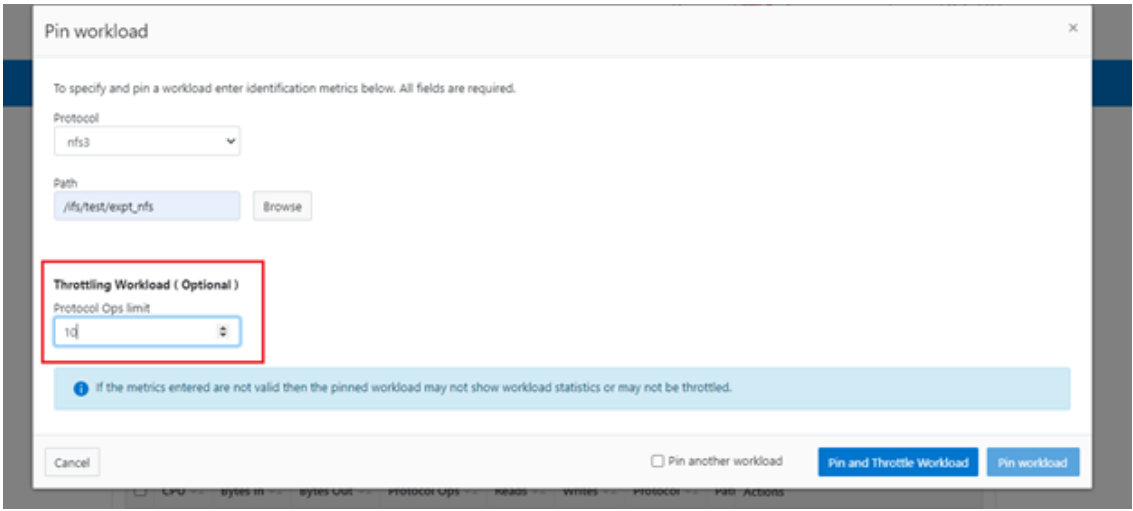
Or from the WebUI, by browsing to Cluster management > Smart QoS > Pin workload:
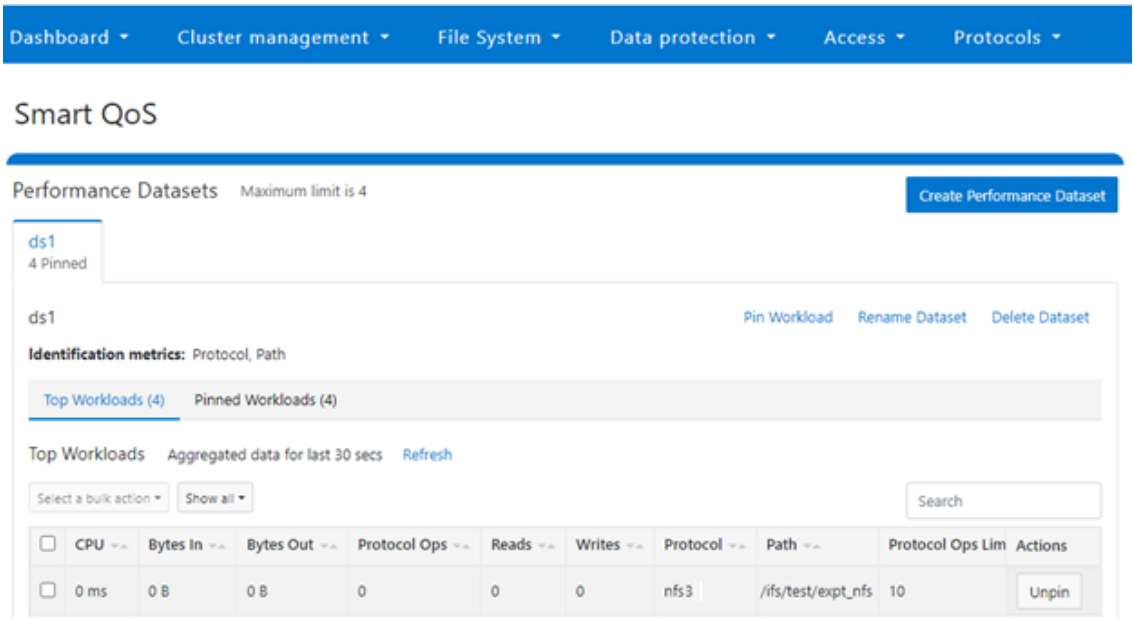
After pinning a workload, the entry appears in the ‘Top Workloads’ section of the WebUI page. However, wait at least 30 seconds to start receiving updates.
To list all the pinned workloads from a specified dataset, use the following command:
# isi performance workloads list ds1
The prior command’s output indicates that there are currently no limits set for this workload.
By default, a protocol ops limit exists for each workload. However, it is set to the maximum (the maximum value of a 64-bit unsigned integer). This is represented in the CLI output by a dash (“-“) if a limit has not been explicitly configured:
# isi performance workloads list ds1
ID   Name  Metric Values           Creation Time       Cluster Resource Impact  Client Impact   Limits
--------------------------------------------------------------------------------------
100  -     path:/ifs/test/expt_nfs 2023-02-02T12:06:05  -          -              -
           protocol:nfs3
--------------------------------------------------------------------------------------
Total: 1
Step 4:

For a pinned workload in a dataset, you can configure a limit for the protocol ops limit from the CLI, using the following syntax:
# isi performance workloads modify <dataset> <workload ID> --limits protocol_ops:<value>
When configuring SmartQoS, always be aware that it is a powerful performance throttling tool which can be applied to significant areas of a cluster’s data and userbase. For example, protocol Ops limits can be configured for metrics such as ‘path:/ifs’, which would affect the entire /ifs filesystem, or ‘zone_name:System’ which would limit the System access zone and all users within it. While such configurations are entirely valid, they would have a significant, system-wide impact. As such, exercise caution when configuring SmartQoS to avoid any inadvertent, unintended, or unexpected performance constraints.
In the following example, the dataset is ‘ds1’, the workload ID is ‘100’, and the protocol Ops limit is set to the value ‘10’:
# isi performance workloads modify ds1 100 --limits protocol_ops:10
protocol_ops: 18446744073709551615 -> 10
Or from the WebUI, by browsing to Cluster management > Smart QoS > Pin and throttle workload:
You can use the ‘isi performance workloads’ command in ‘list’ mode to show details of the workload ‘ds1’. In this case, ‘Limits’ is set to protocol_ops = 10.
# isi performance workloads list test
ID   Name  Metric Values           Creation Time       Cluster Resource Impact  Client Impact   Limits
--------------------------------------------------------------------------------------
100  -     path:/ifs/test/expt_nfs 2023-02-02T12:06:05  -   -  protocol_ops:10
           protocol:nfs3
--------------------------------------------------------------------------------------
Total: 1
Or in ‘view’ mode:
# isi performance workloads view ds1 100
                     ID: 100
                   Name: -
          Metric Values: path:/ifs/test/expt_nfs, protocol:nfs3
          Creation Time: 2023-02-02T12:06:05
Cluster Resource Impact: -
          Client Impact: -
                 Limits: protocol_ops:10
Or from the WebUI, by browsing to Cluster management > Smart QoS:
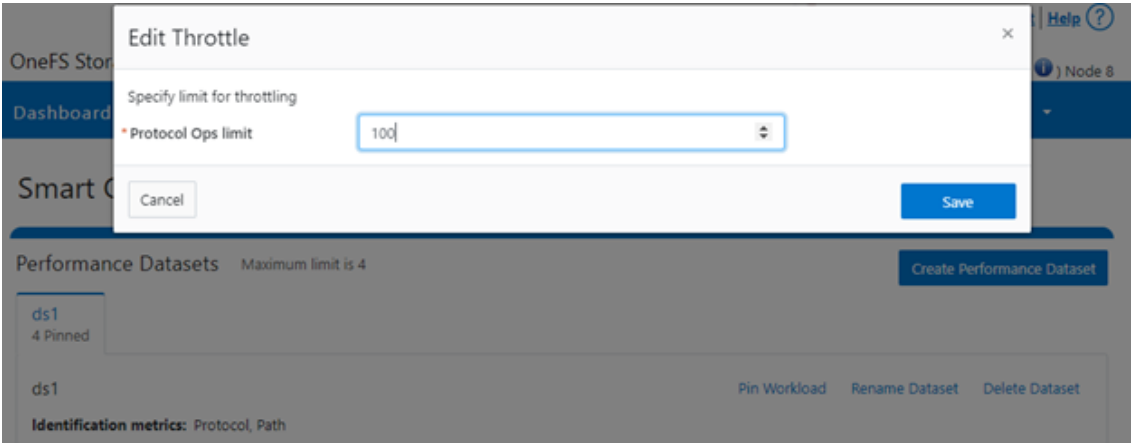
You can easily modify the limit value of a pinned workload with the following CLI syntax. For example, to set the limit to 100 Ops:
# isi performance workloads modify ds1 100 --limits protocol_ops:100
Or from the WebUI, by browsing to Cluster management > Smart QoS > Edit throttle:
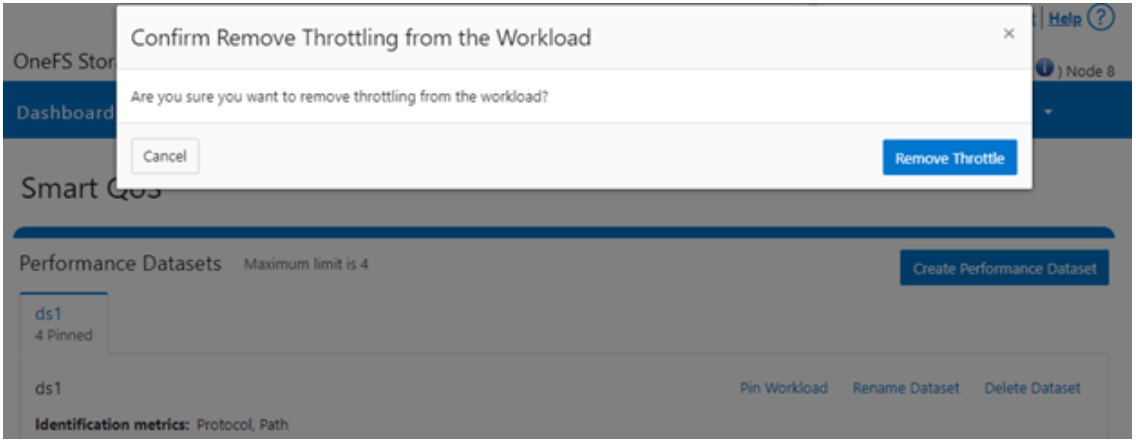
Similarly, you can use the following CLI command to easily remove a protocol ops limit for a pinned workload:
# isi performance workloads modify ds1 100 --no-protocol-ops-limit
Or from the WebUI, by browsing to Cluster management > Smart QoS > Remove throttle:
Author: Nick Trimbee

OneFS SmartQoS
Thu, 23 Feb 2023 22:34:49 -0000
|Read Time: 0 minutes
Built atop the partitioned performance (PP) resource monitoring framework, OneFS 9.5 introduces a new SmartQoS performance management feature. SmartQoS allows a cluster administrator to set limits on the maximum number of protocol operations per second (Protocol Ops) that individual pinned workloads can consume, in order to achieve desired business workload prioritization. Among the benefits of this new QoS functionality are:
- Enabling IT infrastructure teams to achieve performance SLAs
- Allowing throttling of rogue or low priority workloads and hence prioritization of other business critical workloads
- Helping minimize data unavailability events due to overloaded clusters
This new SmartQoS feature in OneFS 9.5 supports the NFS, SMB and S3 protocols, including mixed traffic to the same workload.
But first, a quick refresher. The partitioned performance resource monitoring framework, which initially debuted in OneFS 8.0.1, enables OneFS to track and report the use of transient system resources (resources that only exist at a given instant), providing insight into who is consuming what resources, and how much of them. Examples include CPU time, network bandwidth, IOPS, disk accesses, and cache hits, and so on.
OneFS partitioned performance is an ongoing project that in OneFS 9.5 now provides control and insights. This allows control of work flowing through the system, prioritization and protection of mission critical workflows, and the ability to detect if a cluster is at capacity.
Because identification of work is highly subjective, OneFS partitioned performance resource monitoring provides significant configuration flexibility, by allowing cluster admins to craft exactly how they want to define, track, and manage workloads. For example, an administrator might want to partition their work based on criteria such as which user is accessing the cluster, the export/share they are using, which IP address they’re coming from – and often a combination of all three.
OneFS has always provided client and protocol statistics, but they were typically front-end only. Similarly, OneFS has provided CPU, cache, and disk statistics, but they did not display who was consuming them. Partitioned performance unites these two realms, tracking the usage of the CPU, drives, and caches, and spanning the initiator/participant barrier.
OneFS collects the resources consumed and groups them into distinct workloads. The aggregation of these workloads comprises a performance dataset.
Item | Description | Example |
Workload | A set of identification metrics and resources used | {username:nick, zone_name:System} consumed {cpu:1.5s, bytes_in:100K, bytes_out:50M, …} |
Performance Dataset | The set of identification metrics by which to aggregate workloads
The list of workloads collected that match that specification | {usernames, zone_names} |
Filter | A method for including only workloads that match specific identification metrics |
|
The following metrics are tracked by partitioned performance resource monitoring:
Category | Items |
Identification Metrics |
|
Transient Resources |
|
Performance Statistics |
|
Supported Protocols |
|
Be aware that, in OneFS 9.5, SmartQoS currently does not support the following Partitioned Performance criteria:
Unsupported Group | Unsupported Items |
Metrics |
|
Workloads |
|
Protocols |
|
When pinning a workload to a dataset, note that the more metrics there are in that dataset, the more parameters need to be defined when pinning to it. For example:
Dataset = zone_name, protocol, username
To set a limit on this dataset, you’d need to pin the workload by also specifying the zone name, protocol, and username.
When using the remote_address and/or local_address metrics, you can also specify a subnet. For example: 10.123.456.0/24
With the exception of the system dataset, you must configure performance datasets before statistics are collected.
For SmartQoS in OneFS 9.5, you can define and configure limits as a maximum number of protocol operations (Protocol Ops) per second across the following protocols:
- NFSv3
- NFSv4
- NFSoRDMA
- SMB
- S3
You can apply a Protocol Ops limit to up to four custom datasets. All pinned workloads within a dataset can have a limit configured, up to a maximum of 1024 workloads per dataset. If multiple workloads happen to share a common metric value with overlapping limits, the lowest limit that is configured would be enforced
Note that when upgrading to OneFS 9.5, SmartQoS is activated only when the new release has been successfully committed.
In the next article in this series, we’ll take a deeper look at SmartQoS’ underlying architecture and workflow.
Author: Nick Trimbee