


New Decision Support Benchmark Has Dell EMC MX740c as Top Performance Leader
Thu, 18 Mar 2021 15:59:40 -0000
|Read Time: 0 minutes
Related Blog Posts

Get the most from your Oracle database
Wed, 30 Mar 2022 15:09:53 -0000
|Read Time: 0 minutes
This year, the Oracle team at Dell Technologies set out to help our customers get the most from their database investments. To determine optimal price performance, we started by validating three different PowerEdge R750 configurations.
The first configuration was an Intel Xeon Gold 5318Y CPU with 24 processor cores, a 2.10 GHz clock speed, and a cache of 36 MB. This PowerEdge configuration had the highest core count of all the three configurations, so we expected it to be the performance leader in our workload tests.
The second configuration included two Intel Xeon Gold 6334 CPUs, each with eight processor cores for a total of 16 cores. Each CPU had the same clock speed of 3.6 GHz, and each with 18 MB cache for a total of 36 MB. This configuration had a much higher clock speed, even though it had eight fewer processor cores.
The third and final configuration had the fewest cores, with only one Intel Xeon Gold 6334 CPU with eight processor cores, a 3.6 GHz clock speed, and an 18 MB cache used for the workload tests. We did not expect this entry-level configuration to match the performance of the first configuration as it has 16 fewer processor cores. The main reason that we included this configuration was to provide insights into how a PowerEdge design can start with one processor and scale-up when adding another processor.
All three configurations were tested with an OLTP workload using HammerDB load generation tool. The TPROC-C workload configuration is described in Table 1.
Table 1: Virtual users and related HammerDB workload parameters
| Specifications | Use case 1: 1x 5318Y CPU | Use case 2: 2 x 6334 CPUs | Use case 3: 1 x 6334 CPU |
|---|---|---|---|
Virtual Users | 120 | 120 | 60 |
User Delay (ms) | 500 | ||
Repeat Delay (ms) | 500 | ||
Iterations | 1 | ||
We measured our results in New Orders Per Minute (NOPM), as this metric facilitates price performance comparison between different database systems.
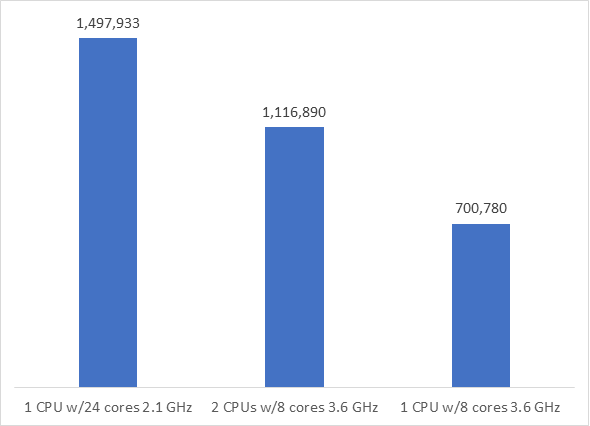
| Use Case 1: 1 x 5318Y CPU | Use Case 2: 2 x 6334 CPUs | Use Case 3: 1 x 6334 CPU |
|---|---|---|
Compared to use case 1: | 75% of NOPM | 47% of NOPM |
Figure 1: NOPM for each use case
Unsurprisingly, use case 1 was the performance leader. Although we expected this result, we did not expect the high NOPM performance for use cases 2 and 3. Use case 2 supported 75 percent of the NOPM workload of use case 1, with eight fewer processor cores. Use case 3 supported 47 percent of the NOPM of use case 1, with 16 fewer processor cores. The higher base clock speed in both use cases 2 and 3 seemed to increase efficiency.
Estimated costs are important factors that impact the efficiency of each PowerEdge configuration. Table 2 shows the cost of the PowerEdge configurations combined with the Oracle Database Enterprise Edition (EE) licensing using the processor metric. For a more detailed overview of costs, read the white paper.
Table 2: Server and Oracle EE processor core license costs (non-discounted, no support costs)
| 1 CPU w/ 24 cores 2.1 GHz | 2 CPUs w/ 8 cores 3.6 GHz | 1 CPU w/ 8 cores 3.6 GHz | |
|---|---|---|---|
License Totals | $570,000.00 | $380,000.00 | $190,000.00 |
PowerEdge R750 costs | $70,320.00 | $98,982 | $71,790.00 |
Grand total costs | $640,320.00 | $478,982.00 | $261,790.00 |
Price per Performance-efficiency-per-processor-core is calculated by taking the total cost of each configuration divided by the number of NOPM per processor core.
| 1 CPU w/ 24 cores 2.1 GHz | 2 CPUs w/ 8 cores 3.6 GHz | 1 CPU w/ 8 cores 3.6 GHz | |
|---|---|---|---|
Total cost | $640,320.00 | $478,982.00 | $261,790.00 |
NOPM per processor core | 62,414 | 69,806 | 87,598 |
Price per Performance-Efficiency-per-processor-core | $10.26 | $6.86 | $2.17 |
Use cases 2 and 3 were more efficient in terms of performance than use case 1, as both configurations processed more NOPM per processor core. Although use case 1 was the performance leader, it had highest price per performance-efficiency-per-processor-core. The high price performance efficiency per core relates to how high it would cost to generate the number of NOPM per core that the system was able to process. More information about the DBAs and wait events for each use case is available in this white paper.
The PowerEdge configuration for use case 2 had twice the amount of RAM than use case 1, meaning the system was more expensive. However, the additional memory had a minimal impact on performance, as the database SGA size remained the same for each validation test.
Use case 3 had the best price performance-efficiency per core at $2.17 which provided a 79 percent savings compared to use case 1 ($10.26). This result shows that customers can start with a small Oracle database configuration with one low core count high frequency CPU and achieve up to 47 percent of the performance that a very high core count low frequency CPU can achieve. For the processor configurations used in use case 1 and 3 this savings that are equated to $379,530, which is significant savings in terms of dollar amount!
The two CPUs configuration in use case 2 cost $6.86, which provided a 33 percent savings compared to use case 1 ($10.26). This result shows that when customers must support larger workload arises customers can scale-up by adding a second CPU to their server and achieve up to 75 percent of the performance that a very high core count low frequency CPU can achieve and still end up paying less than what they would’ve paid had they started with the high core count low frequency to start with. For the processor configurations used in use case 1 and 2 these savings equated to $161,388, which is again good savings in terms of dollar amounts.
Each database is unique, and the savings results demonstrated in our validation tests may vary depending on your database system. Dell Technologies has an experienced Oracle team that can configure PowerEdge systems based on your performance requirements and can help you optimize price efficiency for your databases. For customers who are interested in more information, see the following next steps:
- Read the white paper: Accelerate Oracle Databases and Maximize Your Investment
- Connect with your Dell Technologies Representative and mention that you want to upgrade your Oracle databases with this price efficiency approach

The Dell PowerEdge R7525: a Leader in Price and performance for SQL Server 2019
Mon, 07 Feb 2022 21:44:20 -0000
|Read Time: 0 minutes
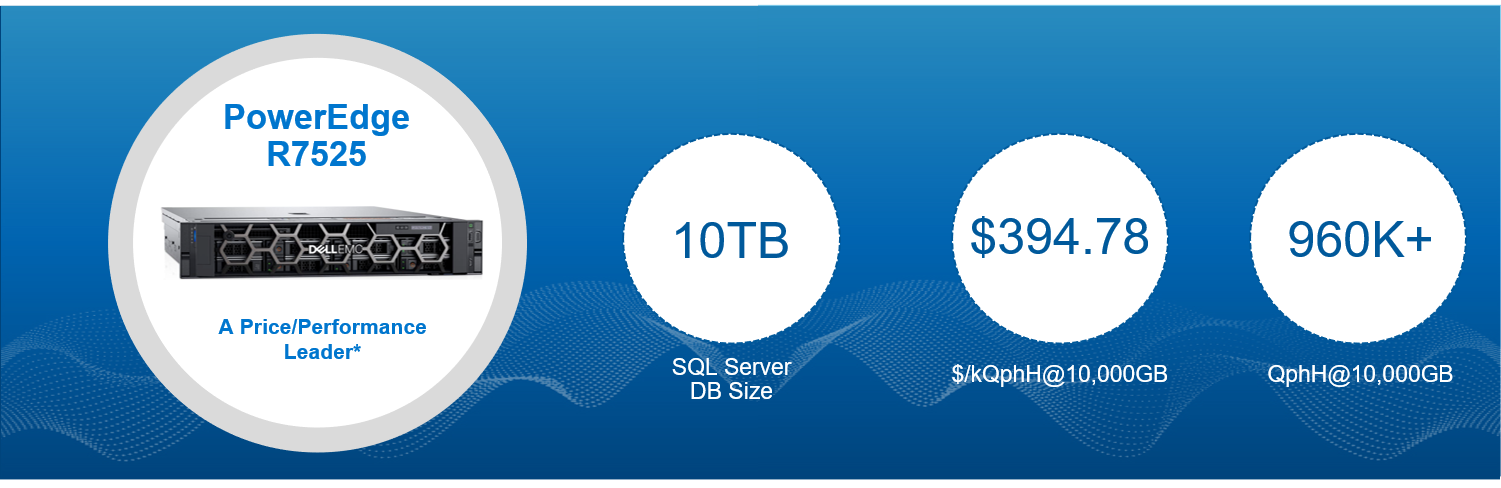
The Microsoft Server team at Dell Technologies is excited to announce the recently published decision support workload benchmark (TPC-H) that has the Dell PowerEdge R7525 as the price performance leader according to the 10,000 GB results published on December 15th, 2021. The Transaction Processing Council (TPC) provides the most trusted sources of independently audited database performance benchmarks. These TPC benchmarks provide a way for customers to compare the performance of servers using different sized workloads.
The Dell PowerEdge R7525 is a two-socket server that uses AMD EPYC processors and supports up to 4TB of memory, making it a strong choice for database workloads. The AMD EPYC 73F3 processor has 16 CPU cores and a base clock speed of 3.5 GHz that can boost up to 4.0 GHz. The base clock speed of 3.5 GHz for the CPU cores enables quick data processes, which enhances database value for customers.
We configured the Dell PowerEdge R7525 with two AMD EPYC 73F3 processors for a total of 32 physical cores and with hyperthreading 64 threads. The server was configured with the maximum amount of memory (4 TB) with DDR4-3200 DRAM in a 32 by 128 GiB memory configuration. The server storage configuration included ten 1.92 TB SSD drives and eight 6.4 enterprise NVMe drives. For the complete PowerEdge R7525 configuration, see the TPC Benchmark H Full Disclosure Report.
We used Microsoft SQL Server 2019 Enterprise Edition and Red Hat Enterprise Linux 8.3 for the TPC-H workload. The decision support workload (TPC-H) is designed to examine volumes of data, execute queries with a high degree of complexity, and provide answers to critical business questions. The key performance metric is the Composite Query-per-Hour (QphH@Size) for decision support benchmarks. The PowerEdge R7525 achieved a 960,382 QphH@Size rating with a 10,000 GB database size. To determine the price performance metric the total system cost of $379,133 USD was divided by the queries per hour. The price performance metric of $394.78 $/kQphH@10000GB placed the PowerEdge R7525 a leader in this category.*
The Microsoft team at Dell Technologies has recently published best practices for SQL Server, many of which were used in this independently audited TPC-H benchmark. To review these best practices that provide insights into how organizations can optimize their SQL Server environments, see this link: AMD-based SQL Server Best Practices.
The SQL Server Best Practices program includes the following:
- VMware ESXi: Round Robin Path Policy
- PowerMax: Adding Storage Groups
- PowerMax: Storage Directors Ports and Interface Emulations
- SQL Server 2019: CPU Affinity
The solutions page for Microsoft SQL Server provides an overview of how Dell Technologies and Microsoft SQL Server can enable your company with modern infrastructure and agile operations. To learn more, see Dell Technologies Solutions for Microsoft Data Platform.
For those interested in harnessing the performance of the AMD-based PowerEdge R7525 server see, PowerEdge R7525 rack server web page. This provides an overview and technical specifications of the PowerEdge R7525 server.
Dell Technologies offers a portfolio of other rack servers, tower and modular servers that can be configured to accelerate most any business workload. To learn more about these options, see Dell Technologies PowerEdge Server Solutions.
* Based on TPC Benchmark H (TPC-H), December 15th, 2021, the Dell EMC PowerEdge R7525 rack server has a TPC-H Composite Query-per-Hour Performance Metric of 960,382 and a price/kQphH metrick of 394.79 USD when run against a 10,000 GB Microsoft SQL Server 2019 database and Red Hat Enterprise Linux 8.3 in a non-clustered environment. Actual results may vary based on operating environment. Full results are available at tpc.org.