


Molecular Dynamics Simulations with Dell EMC PowerEdge XE8545 Server and NVIDIA A100
Wed, 02 Jun 2021 19:37:48 -0000
|Read Time: 0 minutes
Overview
Over the past decade, graphics processing units, or GPUs, have become popular in scientific computing because of their great ability to exploit a high degree of parallelism. NVIDIA has a handful of life sciences applications optimized and run on their general-purpose GPUs. Unfortunately, these GPUs can only be programmed with CUDA, OpenACC, and the OpenCL framework. Most members of the life sciences community are not familiar with these frameworks, and so few biologists or bioinformaticians can make efficient use of GPU architectures. However, GPUs have been making inroads into the molecular dynamics simulation (MDS) field since MD was developed in the 1950s. MDS requires heavy computational work to simulate biomolecular structures or their interactions.
In this blog, we tested two MDS applications; NAMD, and LAMMPS using the Dell EMC PowerEdge XE8545 server with NVIDIA A100 GPUs. Since the XE8545 server does not support NVIDIA V100 GPU, we can roughly estimate the performance boost with the A100 from our previous tests.
These two applications are free and open-source parallel MD packages designed for analyzing the physical movements of atoms and molecules.
The test server configuration is summarized in the following table.
Dell EMC PowerEdge XE8545 | |
CPU | 2x 7713 (Milan), 64 Cores, 2.0 GHz – 3.7 GHz Base-Boost, TDP 225 W, 256 MB L3 Cache |
RAM | DDR4 1024 GB (32 x 32 GB) 3200 MT/s |
Operating system | RHEL 8.3 (4.18.0-240.el8.x86_64) |
Filesystem network | Mellanox InfiniBand HDR100 |
Filesystem | Dell EMC Ready Solutions for HPC BeeGFS High Capacity Storage |
BIOS system profile | Performance Optimized |
Logical processor | Disabled |
Virtualization technology | Disabled |
Accelerator | 4 x A100-40 GB SXM4 |
Cuda/Toolkit | 11.2 |
OpenMPI | 4.1.1 |
NAMD | NAMD_Git-2021-04-01_Source |
LAMMPS | Stable version (29 Oct 2020) |
Performance Evaluation
NAMD
Nanoscale Molecular Dynamics (NAMD) is open-source software for molecular dynamics simulation written in a CHARMM parallel programming model and is designed for high-performance simulation of large biomolecular systems.
NAMD was built with the NAMD_Git-2021-04-01_Source source code on GCC 11.1 and CUDA 11.2. For our tests, we used two sets of data; 1.06 million-atoms of the Satellite Tobacco Mosaic Virus (STMV) system, and the HECBioSim3000k-atom system, which is a pair of 1IVO and 1NQL hEGFR tetramers.
Figure 1 shows the performance of 4x A100 GPUs with the STMV dataset. NAMD uses ++p options to specify the number of worker threads, and as recommended, is equal to the total number of cores minus the total number of GPUs. However, the number of total cores in the Milan Eypc 7003 family of processors, such as the Eypc 7713 that is used in the testing system, does not follow the generic recommendation. It seems to be around 79 to 90 cores. The optimal number of cores depends on the data size. Close to 9-nanosecond simulations (ns) per day performance is a significant performance gain from the NVIDIA V100 tests that we ran previously. It is difficult to say the performance gain is the sole contribution of the new A100 GPUs because the comparison of the 16 GB V100 on the Intel Skylake platform to the 40 GB A100 on the AMD Milan platform may not be valid.
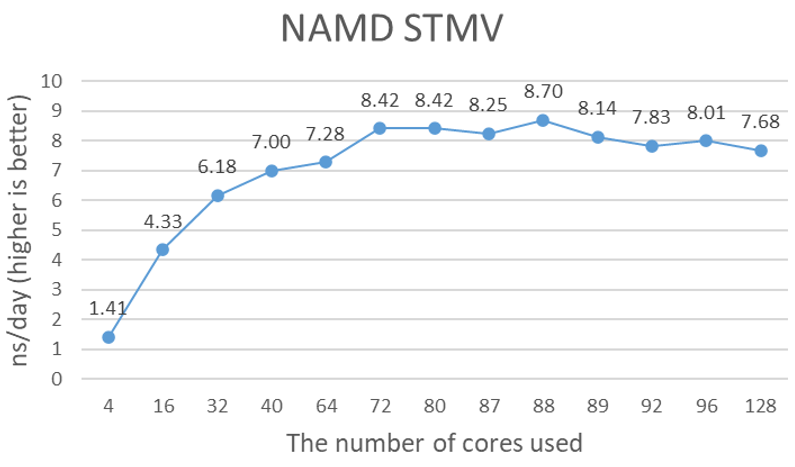
Figure 1. Estimated simulation time per day with 4x NVIDIA A100 GPUs
The purpose of an additional test with 3 million atom protein tetramers is to confirm that the STMV test results are not artificial due to the relatively small icosahedron structure of SMTV, and the partial simulation of assembly and disassembly processes. Figure 2 shows the nanosecond simulations per day plot for 3000k-atom data. 2.1 ns/day seems to be close to the maximum performance with 64 cores.
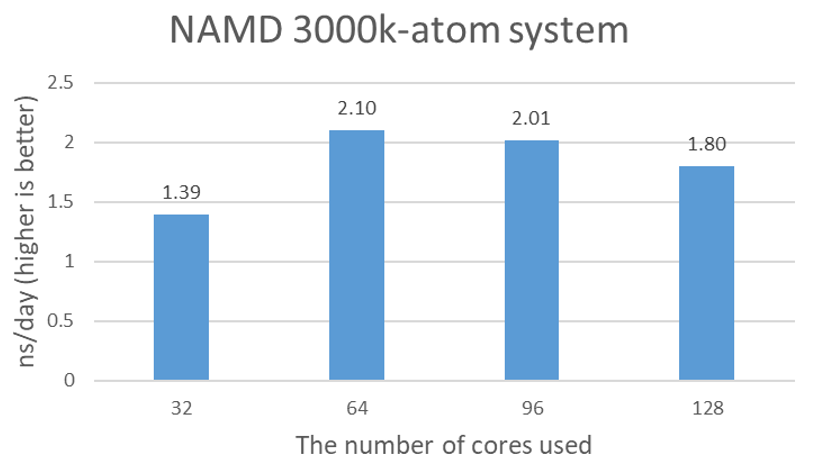
Figure 2. Estimated simulation time per day with 4x NVIDIA A100 GPUs
LAMMPS
Large-scale Atomic/Molecular Massively Parallel Simulator, or LAMMPS, is a classical molecular dynamics code and has potentials for solid-state materials (metals and semiconductors), soft matter (biomolecules and polymers), and coarse-grained or mesoscopic systems. LAMMPS can model atoms, or can be used as a parallel particle simulator at the atomic, meso, or continuum scale. LAMMPS runs on single processors, or in parallel using message-passing techniques and spatial decomposition of the simulation domain. LAMMPS was built with GCC 11.1, OpenMPI 4.1.1, and CUDA 11.2 from the source. The 465k-atom system was selected from HECBioSim.
As shown in Figure 3, LAMMPS scales well over the number of A100s. With 4x A100 GPUs, a 8.4 ns/day simulation is achievable.
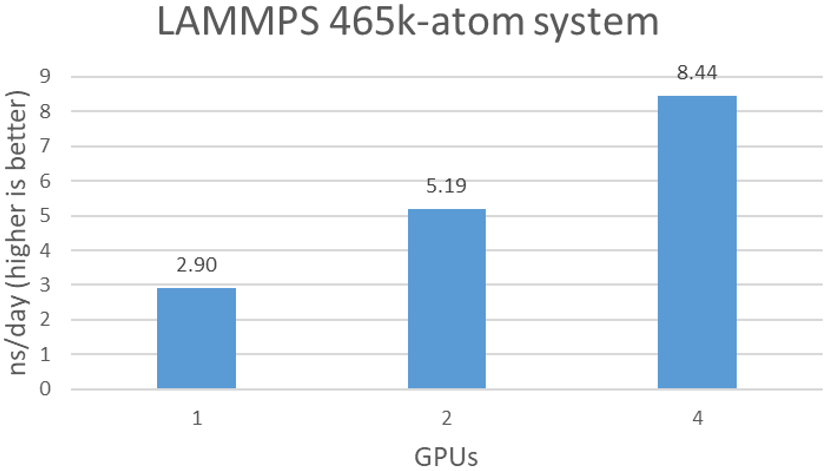
Figure 3. Estimated simulation time per day with various number of BPUs
Conclusion
Although it is not possible to compare the performance of the A100 and the V100 from this study, the Milan CPUs and A100 show a strong synergy between more cores with better and faster GPUs. Running NAMD and LAMMPS on the XE8545 with the A100 can deliver a better performance than a system with the V100.
Related Blog Posts

Nanoscale Molecular Dynamics (NAMD) Performance with Dell EMC PowerEdge R750xa & NVIDIA A series GPUs
Thu, 22 Jul 2021 09:03:25 -0000
|Read Time: 0 minutes
Overview
Over the past decade, GPUs have become popular in scientific computing because of their great ability to exploit a high degree of parallelism. NVIDIA has optimized life sciences applications to run on their general-purpose GPUs. Unfortunately, these GPUs can only be programmed with CUDA, OpenACC, or the OpenCL framework. Most of the life sciences community is not familiar with these frameworks so few biologists or bioinformaticians can make efficient use of GPU architectures. However, GPUs have been making inroads into the molecular dynamics simulation (MDS) field since MD was developed in the 1950s. MDS requires heavy computational work to simulate biomolecular structures or their interactions.
In this blog, the performance of one popular MDS application, NAMD, is presented with various NVIDIA A-series GPUs such as the A100, the A10, the A30 and the A40 . NAMD is a free and open-source parallel MD package designed for analyzing the physical movements of atoms and molecules.
Dell Technologies has released the new PowerEdge R750xa server, a GPU workload platform that is designed to support artificial intelligence, machine learning, and high-performance computing solutions. The dual socket/2U platform supports 3rd Gen Intel Xeon Scalable Processors (code named Ice Lake). It supports up to 40 cores per processor, has eight memory channels per CPU, and up to 32 DDR4 DIMMs at 3200 MT/s DIMM speed. This server can accommodate up to four double-width PCIe GPUs that are located in the front left and the front right of the server. The test server configurations are summarized in Table 1, and the specifications of tested NVIDIA GPUs are listed in Table 2.
Table 1: Tested compute node configuration
Test Beds | ||||
Server | Dell EMC PowerEdge R750xa | Dell EMC PowerEdge R740 | ||
CPU | Intel(R) Xeon(R) Platinum 8380 CPU @ 2.30 GHz | Intel(R) Xeon(R) Platinum 8360Y CPU @ 2.40 GHz | Intel(R) Xeon(R) Gold 6248 CPU @ 2.50 GHz | |
NVIDIA GPUs | 4 x A100 | 4 x A10 | 4 x A30 | 2 x A40 |
RAM | DDR4 1024 GB (32 x 32 GB) 3200 MT/s | DDR4 384 GB (24 x 16 GB) 2933 MT/s | ||
Operating system | RHEL 8.3 (4.18.0-240.el8.x86_64) | |||
Filesystem network | Mellanox InfiniBand HDR100 | |||
Filesystem | Dell EMC Ready Solutions for HPC BeeGFS High Capacity Storage | |||
BIOS system profile | Performance Optimized | |||
Logical processor | Disabled | |||
Virtualization technology | Disabled | |||
Cuda/Toolkit | 11.2 | |||
OpenMPI | 4.1.1 | |||
NAMD | NAMD_Git-2021-04-01_Source | |||
Table 2: Specifications of tested NVIDIA GPUs
NVIDIA GPUs | ||||
| ||||
FP64 (TFLOPS) | 9.7 | Unknown | 5.2 | Unknown |
FP64 Tensor Core (TFLOPS) | 19.5 | Unknown | 10.3 | Unknown |
FP32 (TFLOPS) | 19.5 | 31.2 | 10.3 | 37.4 |
Tensor Float 32 (TFLOPS) | 156 | 312* | 62.5 | 125* | 82 | 165 * | 74.8 | 149.6* |
BFLOAT16 Tensor Core (TFLOPS) | 312 | 624* | 125 | 250* | 165 | 330* | 149.7 | 299.4* |
FP16 Tensor Core (TFLOPS) | 312 | 624* | 125 | 250* | 165 | 330* | 149.7 | 299.4* |
INT8 Tensor Core (TOPS) | 624 | 1248* | 250 | 500* | 330 | 661* | 299.3 | 598.6* |
INT4 Tensor Core (TOPS) | Unknown | 500 | 1,000* | 661 | 1321* | 598.7 | 1,197.4* |
GPU memory | 40 GB HBM2 | 24 GB GDDR6 | 24 GB HBM2 | 48 GB GDDR6 |
GPU memory bandwidth | 1,555 GB/s | 600 GB/s | 933 GB/s | 696 GB/s |
Max Thermal Design Power (TDP) | 400W | 150W | 165W | 300W |
Multi-Instance GPU | Up to 7 MIGs @ 5 GB | Unknown | 4 GPU instances @ 6 GB each 2 GPU instances @ 12 GB each 1 GPU instance @ 24 GB | Unknown |
Form factor | PCIe | Single-slot, full-height, full-length (FHFL) | Dual-slot, full-height, full-length (FHFL) | 4.4" (H) x 10.5" (L) dual slot |
Interconnect | PCIe Gen4: 64 GB/s | PCIe Gen4: 64 GB/s | PCIe Gen4: 64 GB/s
| PCIE Gen4 x 16 31.5 GB/s (bidirectional) |
* With sparsity
Performance Evaluation
NAMD
NAMD was compiled from source code (NAMD_Git-2021-04-01_Source) using GCC 11.1 and CUDA 11.2. We used a test data set, the 1.06 million-atom system of Satellite Tabacco Mosaic Virus (SMTV).
Figure 1 shows the performance of four GPUs with the STMV dataset. The figures represent the performance changes in nanoseconds per day (ns/day) with various numbers of cores used with one, two or four GPUs. The only valid comparison between the various GPUs is NVIDIA A100 and A10 since the test systems were configured identically. Although the performance of NAMD is affected by the CPU clock speed, the tested systems are not significantly different from the CPU’s clock speed. The A10 is rated at three times the single precision FLOPS of the A30, and the A10 performs better than the A30 on the two GPU tests even with slightly slower CPUs. The A100 outperformed by roughly 25 percent and 16 percent on single and two GPU tests when comparing the A10’s results, respectively.
The results from four GPU tests in Figure 1 show similar performance for the different GPUs. This agrees well with our previous test results that NAMD does not scale after two GPUs. We can rule out a potential argument that the data size might be too small since 3 million atom data, HECBioSim3000k-atom system, which is a pair of 1IVO and 1NQL hEGFR tetramers, shows similar or worse results (those results are not shown here).
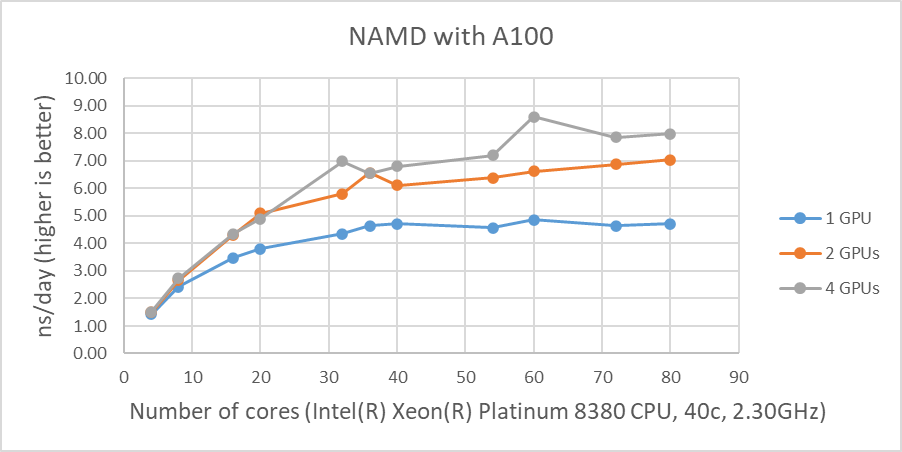
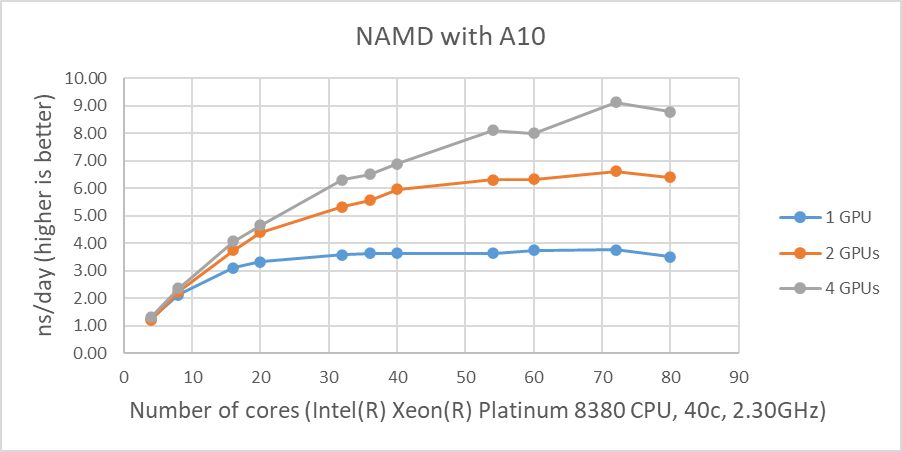
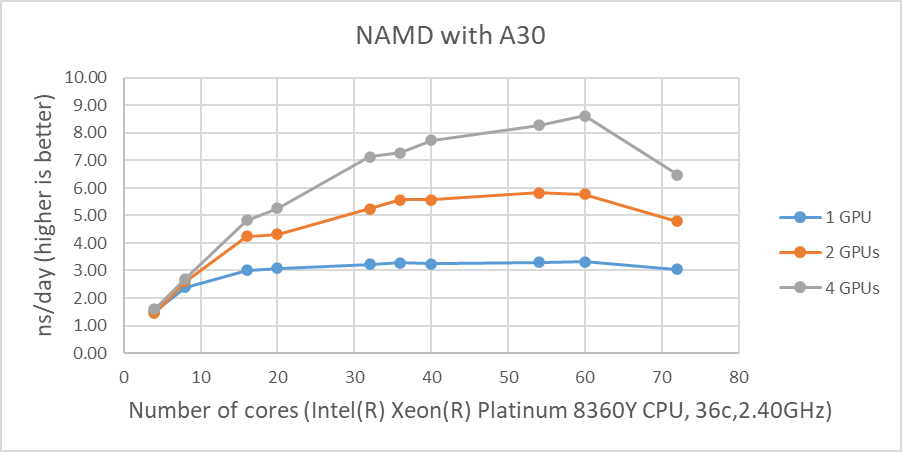
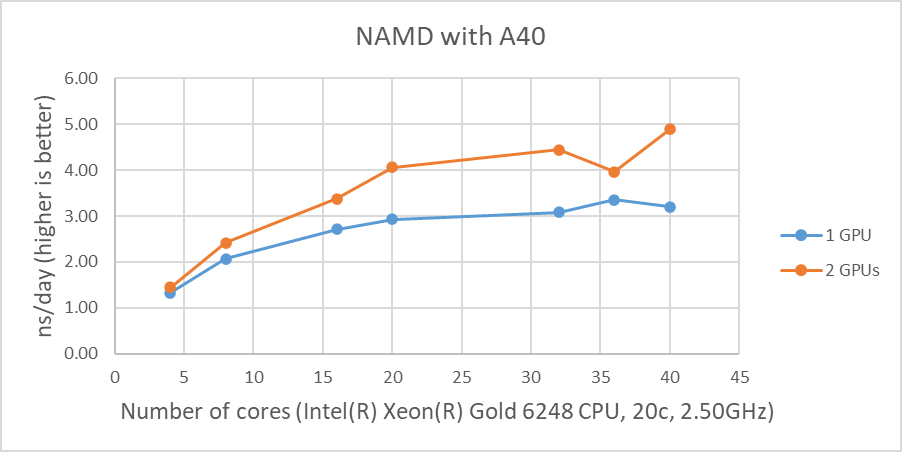
Figure 1: NAMD performance with STMV, 1 million-atom system |
As shown in Figure 1, when four GPUs were tested , all of the GPUs except the A40 reached ~9 ns/day simulations. And, in terms of maximum performance, the A10 performs the highest number of simulations, 9.121 ns/day. However, these numbers are not true reflections of the performance due to the scalability limitations. Although all four GPU test results are similar, the A100 has a better throughput than other GPUs for the two GPU test as shown in Figure 2. Also, it is worth noting that the A10 and the A40 are not suitable for general-purpose computing due to the lack of double-precision support.
Figure 2 shows the performance comparisons among the different GPUs we tested in this study. Again, the A30 performed better than the A10 up to the 16 cores. It is difficult to determine why the A30 doesn’t perform as well with a large number of active CPU cores(20 and more).
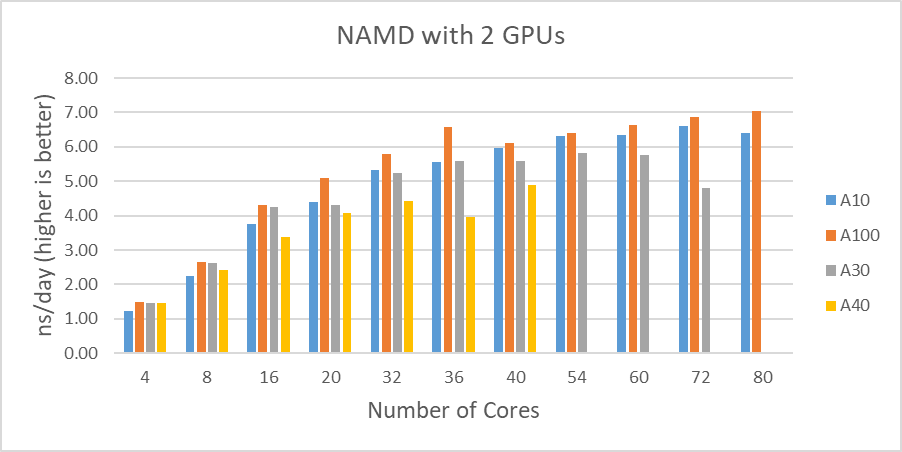
Figure 2: STMV test results comparisons with two GPUs |
Conclusion
The A100 shows a dominant performance and is the most capable card among the A-series GPUs. Although the A30 did not perform as well as the A10 in our test , it is another outstanding choice for versatile applications.
The A10 performed well compared to the A30, and it is the successor of the T4, which was the most cost-effective solution for specific applications such as genomics data analysis.
Since it is not possible to obtain the accurate performance differences among A-series GPUs from this study, further investigation is necessary to achieve a clear picture of these general purpose GPUs.

MLPerf™ Inference v4.0 Performance on Dell PowerEdge R760xa and R7615 Servers with NVIDIA L40S GPUs
Fri, 05 Apr 2024 17:41:56 -0000
|Read Time: 0 minutes
Abstract
Dell Technologies recently submitted results to the MLPerf™ Inference v4.0 benchmark suite. This blog highlights Dell Technologies’ closed division submission made for the Dell PowerEdge R760xa, Dell PowerEdge R7615, and Dell PowerEdge R750xa servers with NVIDIA L40S and NVIDIA A100 GPUs.
Introduction
This blog provides relevant conclusions about the performance improvements that are achieved on the PowerEdge R760xa and R7615 servers with the NVIDIA L40S GPU compared to the PowerEdge R750xa server with the NVIDIA A100 GPU. In the following comparisons, we held the GPU constant across the PowerEdge R760xa and PowerEdge R7615 servers to show the excellent performance of the NVIDIA L40S GPU. Additionally, we also compared the PowerEdge R750xa server with the NVIDIA A100 GPU to its successor the PowerEdge R760xa server with the NVIDIA L40S GPU.
System Under Test configuration
The following table shows the System Under Test (SUT) configuration for the PowerEdge servers.
Table 1: SUT configuration of the Dell PowerEdge R750xa, R760xa, and R7615 servers for MLPerf Inference v4.0
Server | PowerEdge R750xa | PowerEdge R760xa | PowerEdge R7615 |
MLPerf Version | V4.0
| ||
GPU | NVIDIA A100 PCIe 80 GB | NVIDIA L40S
| |
Number of GPUs | 4 | 2 | |
MLPerf System ID | R750xa_A100_PCIe_80GBx4_TRT | R760xa_L40Sx4_TRT | R7615_L40Sx2_TRT
|
CPU | 2 x Intel Xeon Gold 6338 CPU @ 2.00GHz | 2 x Intel Xeon Platinum 8470Q | 1 x AMD EPYC 9354 32-Core Processor |
Memory | 512 GB | ||
Software Stack | TensorRT 9.3.0 CUDA 12.2 cuDNN 8.9.2 Driver 535.54.03 / 535.104.12 DALI 1.28.0 | ||
The following table lists the technical specifications of the NVIDIA L40S and NVIDIA A100 GPUs.
Table 2: Technical specifications of the NVIDIA A100 and NVIDIA L40S GPUs
Model | NVIDIA A100 | NVIDIA L40S | ||
Form factor | SXM4 | PCIe Gen4 | PCIe Gen4 | |
GPU architecture | Ampere | Ada Lovelace | ||
CUDA cores | 6912 | 18176 | ||
Memory size | 80 GB | 48 GB | ||
Memory type | HBM2e | HBM2e | ||
Base clock | 1275 MHz | 1065 MHz | 1110 MHz | |
Boost clock | 1410 MHz | 2520 MHz | ||
Memory clock | 1593 MHz | 1512 MHz | 2250 MHz | |
MIG support | Yes | No | ||
Peak memory bandwidth | 2039 GB/s | 1935 GB/s | 864 GB/s | |
Total board power | 500 W | 300 W | 350 W | |
Dell PowerEdge R760xa server
The PowerEdge R760xa server shines as an Artificial Intelligence (AI) workload server with its cutting-edge inferencing capabilities. This server represents the pinnacle of performance in the AI inferencing space with its processing prowess enabled by Intel Xeon Platinum processors and NVIDIA L40S GPUs. Coupled with NVIDIA TensorRT and CUDA 12.2, the PowerEdge R760xa server is positioned perfectly for any AI workload including, but not limited to, Large Language Models, computer vision, Natural Language Processing, robotics, and edge computing. Whether you are processing image recognition tasks, natural language understanding, or deep learning models, the PowerEdge R760xa server provides the computational muscle for reliable, precise, and fast results.
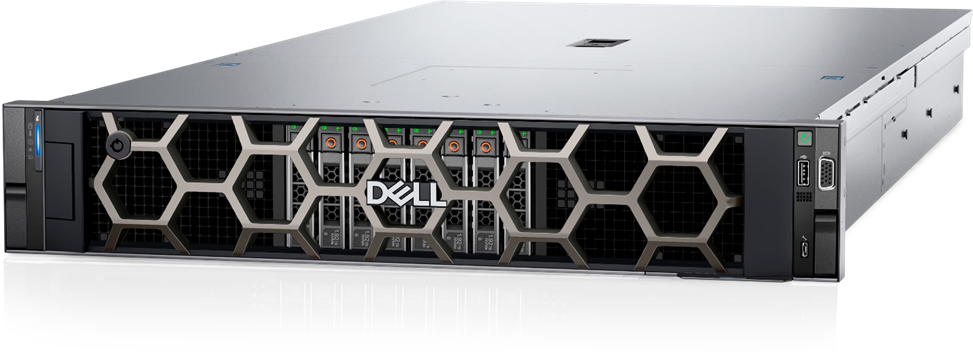
Figure 1: Front view of the Dell PowerEdge R760xa server
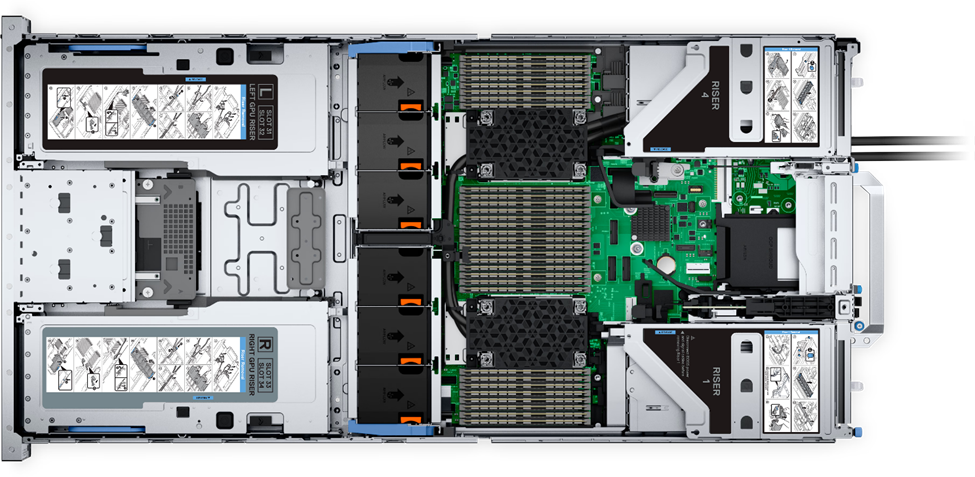
Figure 2: Top view of the Dell PowerEdge R760xa server
Dell PowerEdge R7615 server
The PowerEdge R7615 server stands out as an excellent choice for AI, machine learning (ML), and deep learning (DL) workloads due to its robust performance capabilities and optimized architecture. With its powerful processing capabilities including up to three NVIDIA L40S GPUs supported by TensorRT, this server can handle complex neural network inference and training tasks with ease. Powered by a single AMD EPYC processor, this server performs well for any demanding AI workloads.
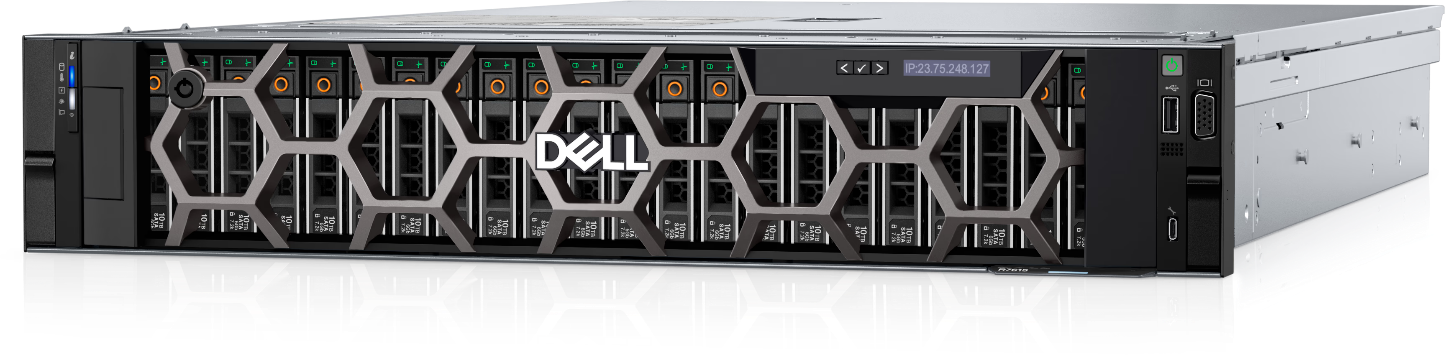
Figure 3: Front view of the Dell PowerEdge R7615 server
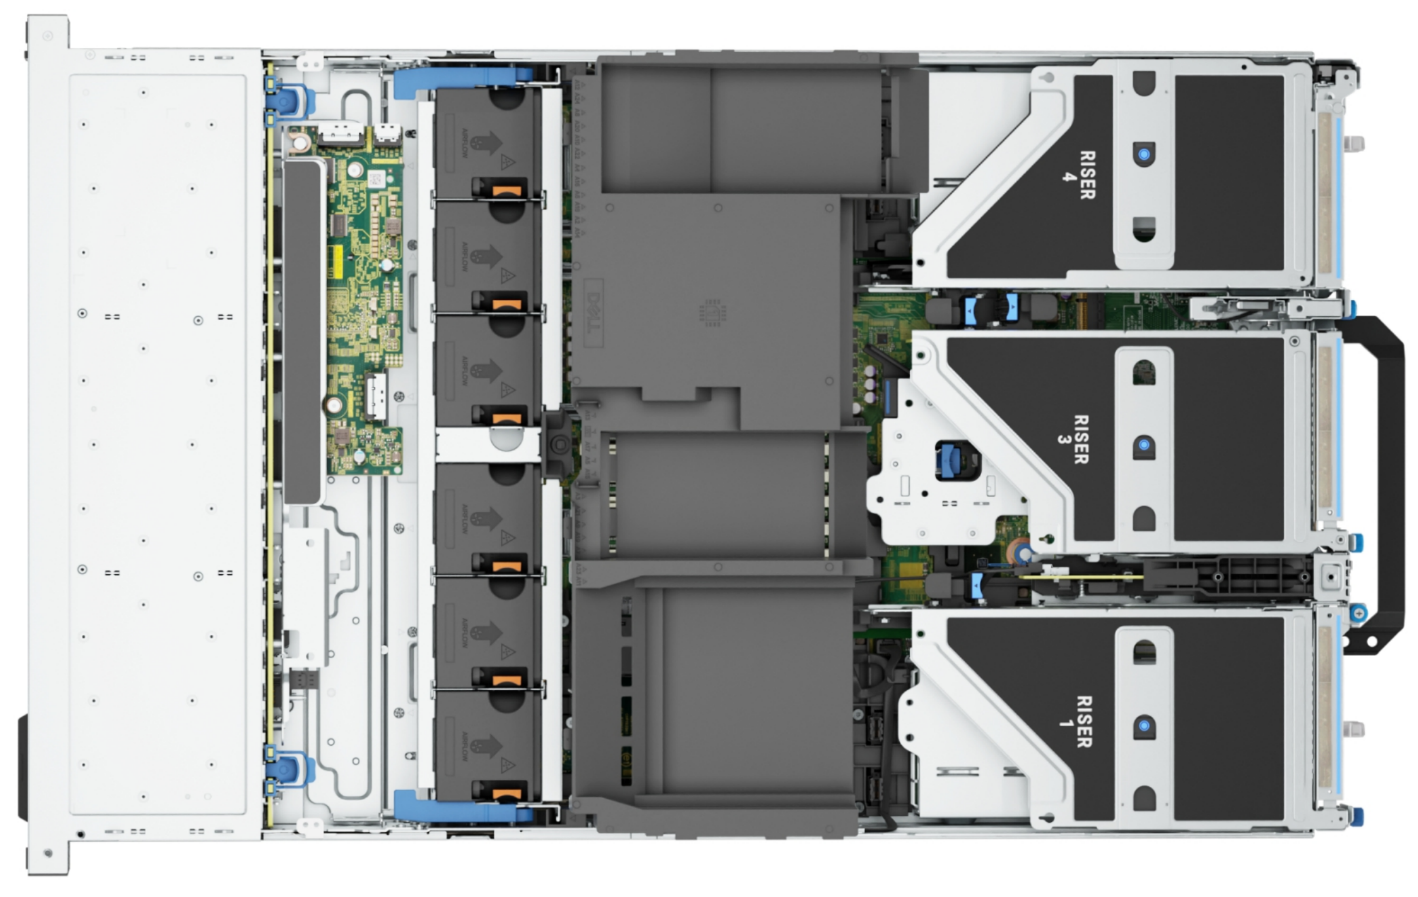
Figure 4: Top view of the Dell PowerEdge R7615 server
Dell PowerEdge R750xa server
The PowerEdge R750xa server is a perfect blend of technological prowess and innovation. This server is equipped with Intel Xeon Gold processors and the latest NVIDIA GPUs. The PowerEdge R760xa server is designed for the most demanding AI, ML, and DL workloads as it is compatible with the latest NVIDIA TensorRT engine and CUDA version. With up to nine PCIe Gen4 slots and availability in a 1U or 2U configuration, the PowerEdge R750xa server is an excellent option for any demanding workload.
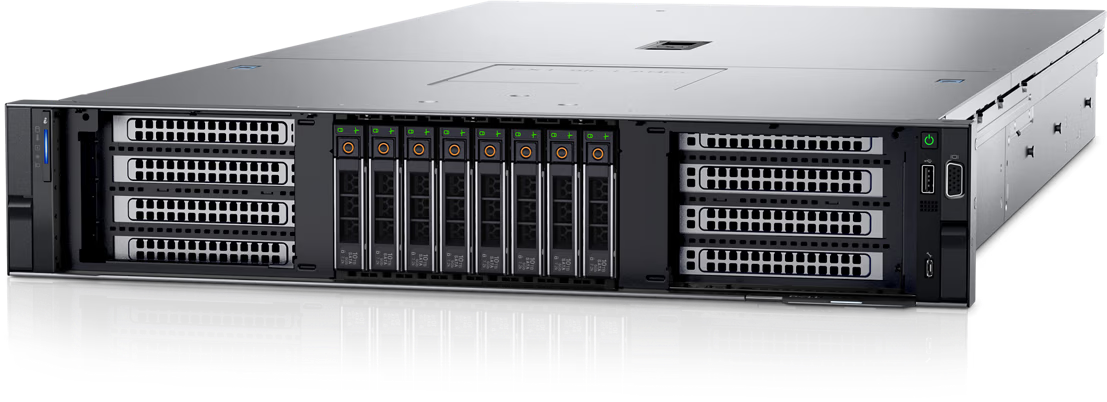
Figure 5: Front view of the Dell PowerEdge R750xa server
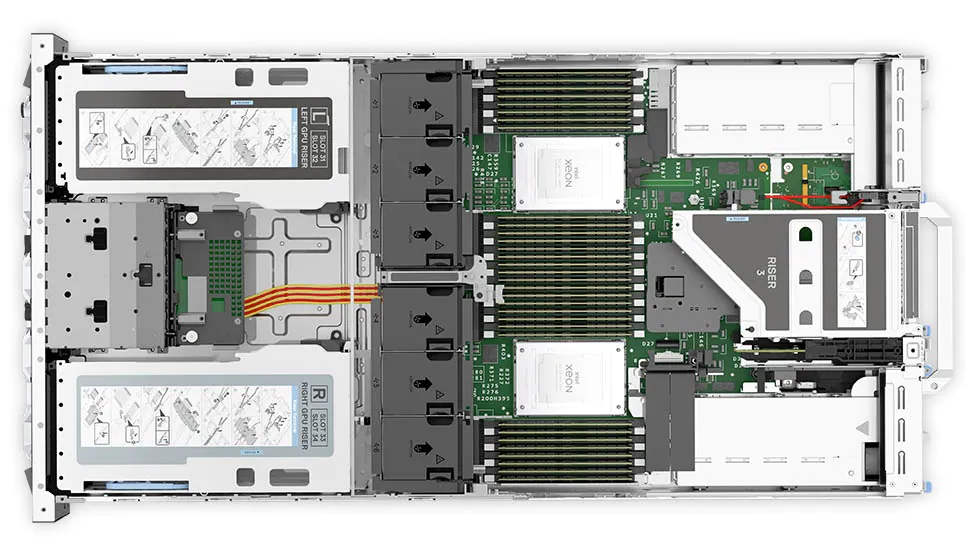
Figure 6: Top view of the Dell PowerEdge R750xa server
Performance results
Classical Deep Learning models performance
The following figure presents the results as a ratio of normalized numbers over the Dell PowerEdge R750xa server with four NVIDIA A100 GPUs. This result provides an easy-to-read comparison of three systems and several benchmarks.
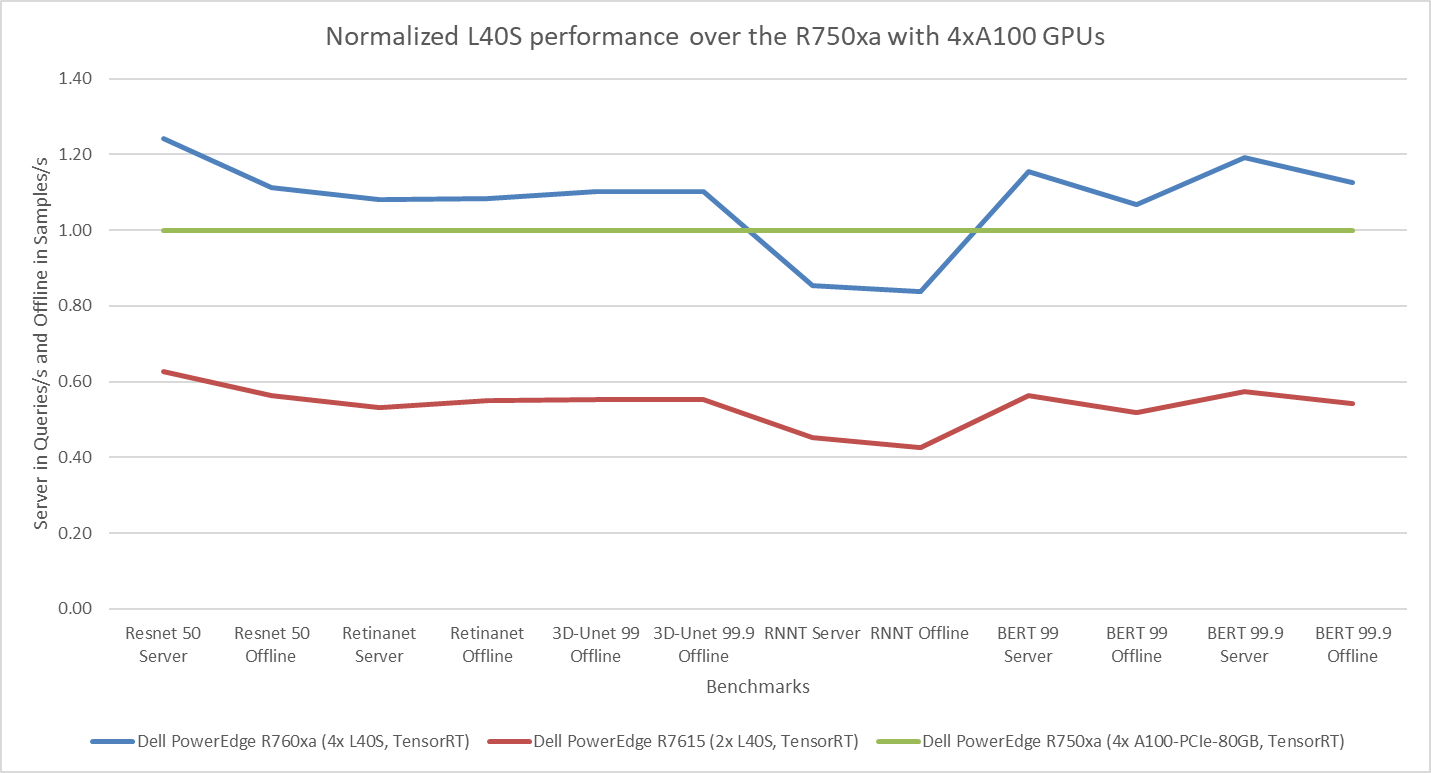
Figure 7: Normalized NVIDIA L40S GPU performance over the PowerEdge R750xa server with four A100 GPUs
The green trendline represents the performance of the Dell PowerEdge R750xa server with four NVIDIA A100 GPUs. With a score of 1.00 for each benchmark value, the results have been divided by themselves to serve as the baseline in green for this comparison. The blue trendline represents the performance of the PowerEdge R760xa server with four NVIDIA L40S GPUs that has been normalized by dividing each benchmark result by the corresponding score achieved by the PowerEdge R750xa server. In most cases, the performance achieved on the PowerEdge R760xa server outshines the results of the PowerEdge R750xa server with NVIDIA A100 GPUs, proving the expected improvements from the NVIDIA L40S GPU. The red trendline has also been normalized over the PowerEdge R750xa server and represents the performance of the PowerEdge R7615 server with two NVIDIA L40S GPUs. It is interesting that the red line almost mimics the blue line. This result suggests that the PowerEdge R7615 server, despite having half the compute resources, still performs comparably well in most cases, showing its efficiency.
Generative AI performance
The latest submission saw the introduction of the new Stable Diffusion XL benchmark. In the context of generative AI, stable diffusion is a text to image model that generates coherent image samples. This result is achieved gradually by refining and spreading out information throughout the generation process. Consider the example of dropping food coloring into a large bucket of water. Initially, only a small, concentrated portion of the water turns color, but gradually the coloring is evenly distributed in the bucket.
The following table shows the excellent performance of the PowerEdge R760xa server with the powerful NVIDIA L40S GPU for the GPT-J and Stable Diffusion XL benchmarks. The PowerEdge R760xa takes the top spot in GPT-J and Stable Diffusion XL when compared to other NVIDIA L40S results.
Table 3: Benchmark results for the PowerEdge R760xa server with the NVIDIA L40S GPU
Benchmark | Dell PowerEdge R760xa L40S result (Server in Queries/s and Offline in Samples/s) | Dell’s % gain to the next best non-Dell results (%) |
Stable Diffusion XL Server | 0.65 | 5.24 |
Stable Diffusion XL Offline | 0.67 | 2.28 |
GPT-J 99 Server | 12.75 | 4.33 |
GPT-J 99 Offline | 12.61 | 1.88 |
GPT-J 99.9 Server | 12.75 | 4.33 |
GPT-J 99.9 Offline | 12.61 | 1.88 |
Conclusion
The MLPerf Inference submissions elicit insightful like-to-like comparisons. This blog highlights the impressive performance of the NVIDIA L40S GPU in the Dell PowerEdge R760xa and PowerEdge R7615 servers. Both servers performed well when compared to the performance of the Dell PowerEdge R750xa server with the NVIDIA A100 GPU. The outstanding performance improvements in the NVIDIA L40S GPU coupled with the Dell PowerEdge server position Dell customers to succeed in AI workloads. With the advent of the GPT-J and Stable diffusion XL Models, the Dell PowerEdge server is well positioned to handle Generative AI workloads.