


MLPerf Inference v0.7 Benchmarks on Power Edge R7515 Servers
Tue, 08 Dec 2020 17:45:45 -0000
|Read Time: 0 minutes
Introduction
MLPerf (https://mlperf.org) Inference is a benchmark suite for measuring how fast Machine Learning (ML) and Deep Learning (DL) systems can process input inference data and produce results using a trained model. The benchmarks belong to a diversified set of ML use cases that are popular in the industry and provide a standard for hardware platforms to perform ML-specific tasks. Hence, good performance under these benchmarks signifies a hardware setup that is well optimized for real world ML inferencing use cases.
System under Test (SUT)
- Server – Dell EMC PowerEdge R7515
- GPU – NVIDIA Tesla T4
- Framework – TensorRT™ 7.2.0.14
Dell EMC PowerEdge R7515
Table 1 Dell EMC PowerEdge R7515 technical specifications
| Component | Description |
|---|---|
System name | PowerEdge R7515 |
Status | Commercially available |
System type | Data center |
Number of nodes | 1 |
Host processor model lane | AMD® EPYC® 7702P |
Host processors per node | 1 |
Host processor core count | 64 |
Host processor frequency | 2.00 GHz |
Host memory capacity | 256 GB DDR4, 2933 MHz |
Host storage | 3.2 TB SSD |
Host accelerator | NVIDIA Tesla T4 |
Accelerators per node | 4 |
NVIDIA Tesla T4
The NVIDIA Tesla T4, based on NVIDIA’s Turing architecture is one of the most widely used AI inference accelerators. The Tesla T4 features NVIDIA Turing Tensor cores which enables it to accelerate all types of neural networks for images, speech, translation, and recommender systems, to name a few. Tesla T4 supports a wide variety of precisions and accelerates all major DL & ML frameworks, including TensorFlow, PyTorch, MXNet, Chainer, and Caffe2.
Table 2 NVIDIA Tesla T4 technical specifications
| Component | Description |
|---|---|
GPU architecture | NVIDIA Turing |
NVIDIA Turing Tensor cores | 320 |
NVIDIA CUDA® cores | 2,560 |
Single-precision | 8.1 TFLOPS |
Mixed-precision (FP16/FP32) | 65 TFLOPS |
INT8 | 130 TOPS |
INT4 | 260 TOPS |
GPU memory | 16 GB GDDR6, 320+ GB/s |
ECC | Yes |
Interconnect bandwidth | 32 GB/s |
System interface | X16 PCIe Gen3 |
Form factor | Low profile PCIe |
Thermal solution | Passive |
Compute APIs | CUDA, NVIDIA TensorRT™, ONNX |
Power | 70W |
MLPerf Inference v0.7
The MLPerf inference benchmark measures how fast a system can perform ML inference using a trained model with new data that is provided in various deployment scenarios. Table 3 shows seven mature models that are in the official v0.7 release.
Table 3 MLPerf Inference Suite v0.7
| Model | Reference application | Dataset |
|---|---|---|
resnet50-v1.5 | vision/classification and detection | ImageNet (224 x 224) |
ssd-mobilenet 300 x 300 | vision/classification and detection | COCO (300 x 300) |
ssd-resnet34 1200 x 1200 | vision/classification and detection | COCO (1200 x 1200) |
bert | language | squad-1.1 |
dlrm | recommendation | Criteo Terabyte |
3d-unet | vision/medical imaging | BraTS 2019 |
rnnt | speech recognition | OpenSLR LibriSpeech Corpus |
The above models serve in various critical inference applications or use cases that are known as “scenarios.” Each scenario requires different metrics and demonstrates performance in a production environment. MLPerf Inference consists of four evaluation scenarios that are shown in Table 4:
- Single-stream
- Multi-stream
- Server
- Offline
Table 4 Deployment scenarios
| Scenario | Sample use case | Metrics |
|---|---|---|
Single-stream | Cell phone augmented reality | Latency in ms |
Multi-stream | Multiple camera driving assistance | Number of streams |
Server | Translation sites | QPS |
Offline | Photo sorting | Inputs/s |
Results
The units on which Inference is measured are based on samples and queries. A sample is a unit on which inference is run, such as an image or sentence. A query is a set of samples that are issued to an inference system together. For detailed explanation of definitions, rules and constraints of MLPerf Inference see: https://github.com/mlperf/inference_policies/blob/master/inference_rules.adoc#constraints-for-the-closed-division
Default Accuracy refers to a configuration where the model infers samples with at least 99% accuracy. High Accuracy refers to a configuration where the model infers samples with 99.9% accuracy.
For MLPerf Inference v0.7 result submissions, Dell EMC used Offline and Server scenarios as they are more representative of datacenter systems. Offline scenario represents use cases where inference is done as a batch job (for instance using AI for photo sorting), while server scenario represents an interactive inference operation (translation app).
MLPerf Inference results on the PowerEdge R7515
Table 5 PowerEdge R7515 inference results
| 3D-UNET | BERT | DLRM | ResNet50 | RNNT | SSD-ResNet34 | |||||
|---|---|---|---|---|---|---|---|---|---|---|
System | Scenario | Default accuracy | High accuracy | Default accuracy | High accuracy | Default accuracy | High accuracy | Default accuracy | Default accuracy | Default accuracy |
Dell EMC R7515 (4 x T4) | Offline (samples/s) | 28 | 28 | 1,708 | 715 | 126,287 | 126,287 | 23,290 | 5,712 | 535 |
Server (queries/s) |
|
| 1,249 | 629 | 126,514 | 126,514 | 21,506 | 4,096 | 450 | |
Table 5 above shows the raw performance of the R740_T4x4 SUT in samples/s for the offline scenario and queries for the server scenario. Detailed results for this and other configurations can be found at https://mlperf.org/inference-results-0-7/
Figures 1 to 4 below show the inference capabilities of two Dell PowerEdge servers; R7515 and PowerEdge R7525. They are both 2U and are powered by AMD processors. The R7515 is single socket, and the R7525 is dual socket. The R7515 used 4xNVIDIA Tesla T4 GPUs while the R7525 used four different configurations of three NVIDIA GPU accelerators; Tesla T4, Quadro RTX8000, and A100. Each bar graph indicates the relative performance of inference operations that are completed in a set amount of time while bounded by latency constraints. The higher the bar graph, the higher the inference capability of the platform.
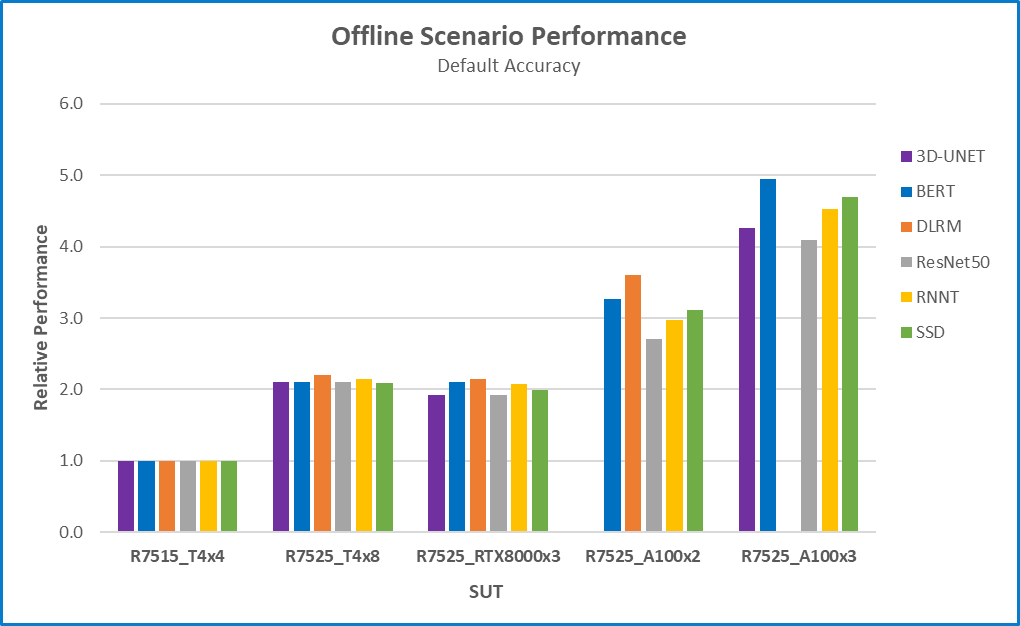
Figure 1 Offline scenario relative performance with default accuracy for six different benchmarks and five different configurations using R7515_T4x4 as a baseline
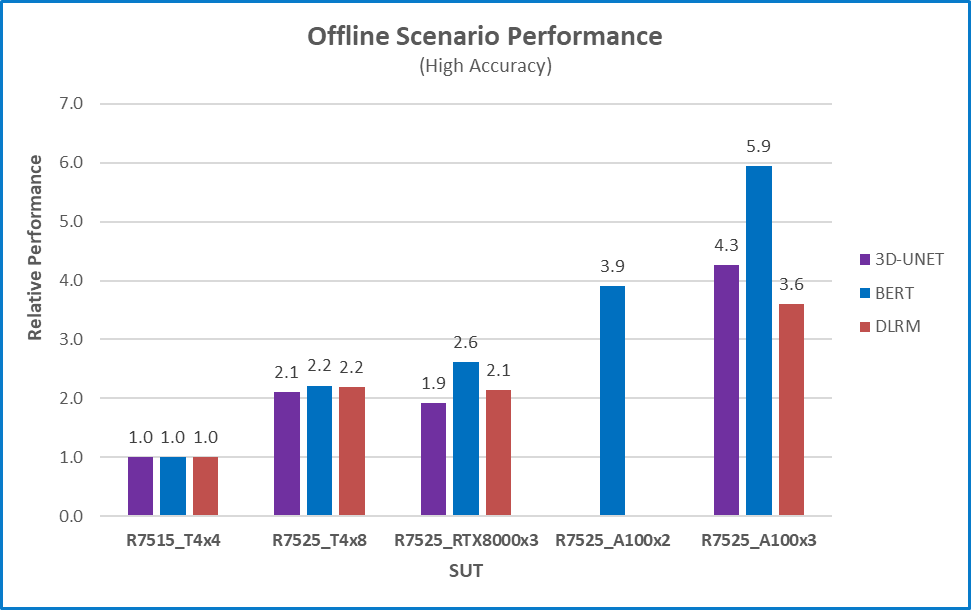
Figure 2 Offline scenario relative performance with high accuracy for six different benchmarks and five different configurations using R7515_T4x4 as a baseline
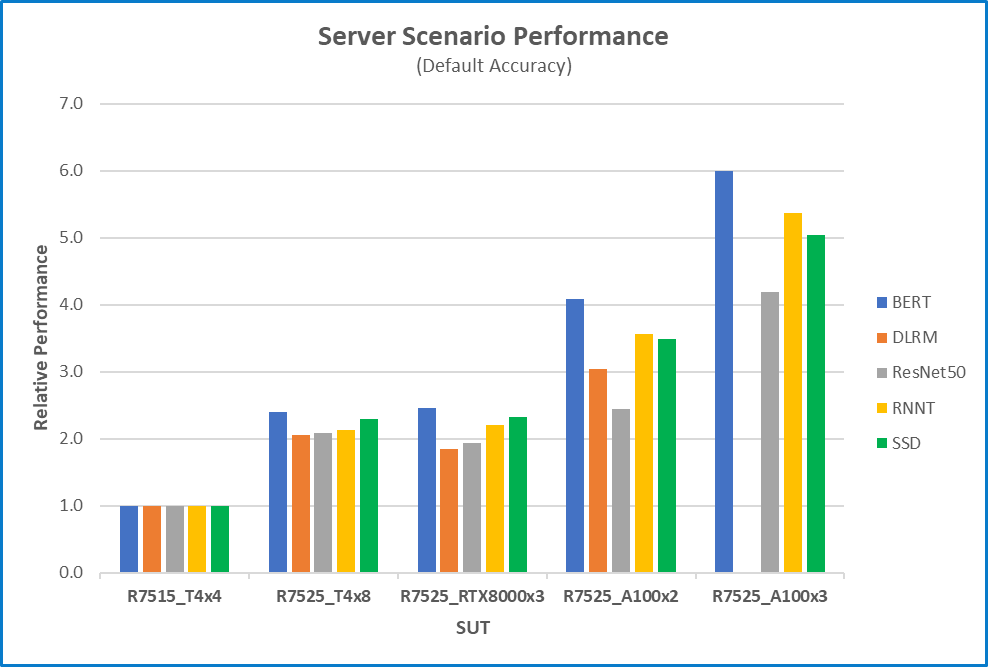
Figure 3 Server scenario relative performance with default accuracy for five different benchmarks and five different configurations using R7515T4x4 as a baseline
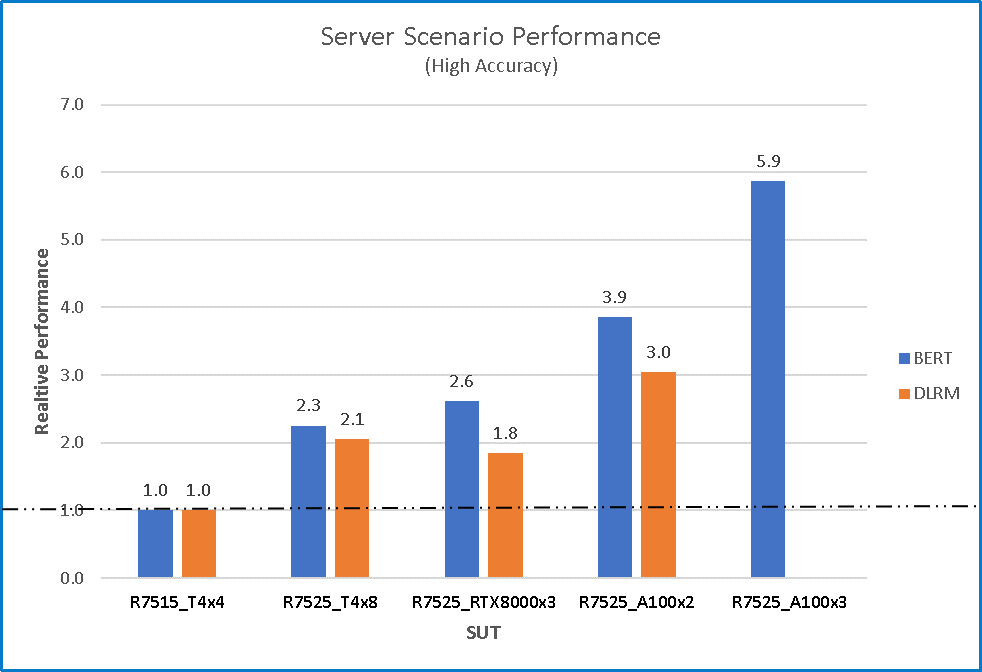
Figure 4 Server scenario relative performance with high accuracy for two different benchmarks and five different configurations using R7515_T4x4 as a baseline
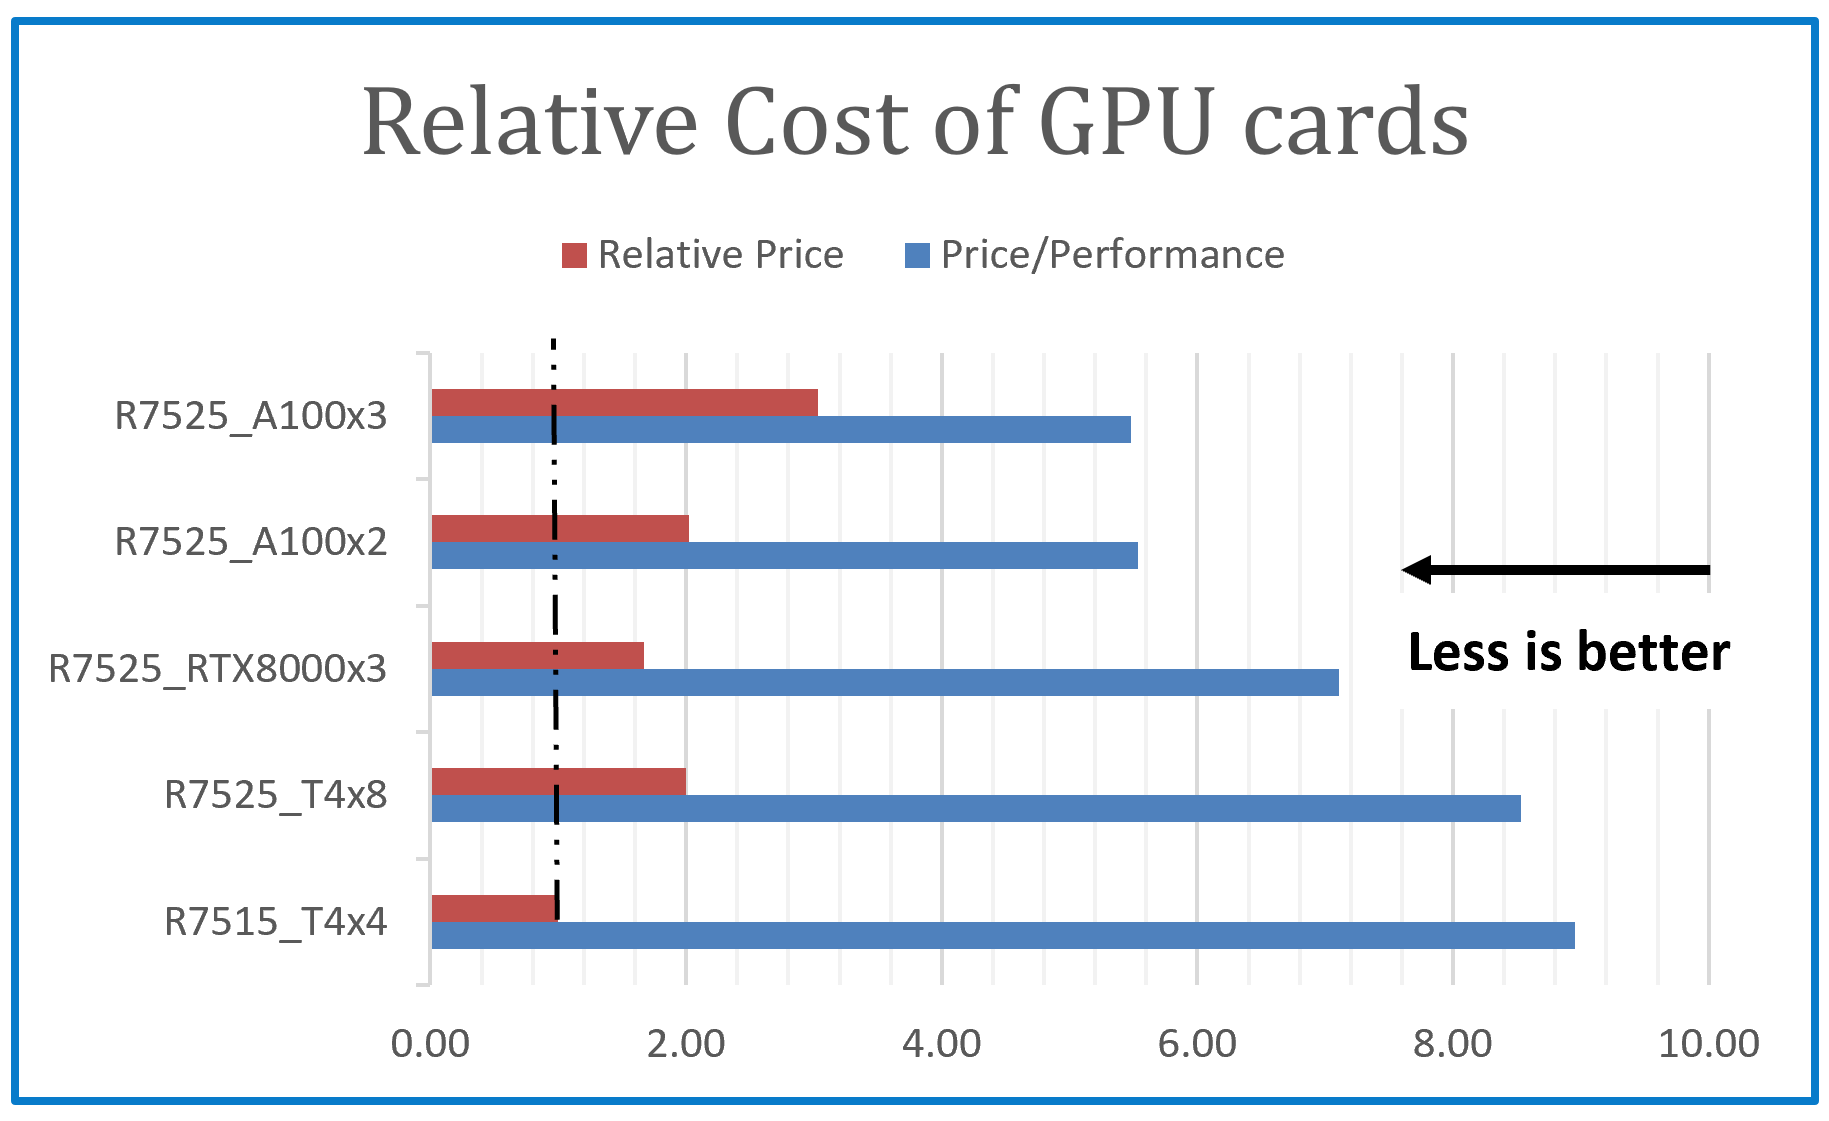
Figure 5 shows the relative price of each GPU configuration using the cost of Tesla T4 as the baseline and the corresponding price performance. The price/performance shown is an estimate to illustrate the “bang “for the money that is spent on the GPU configurations and should not be taken as the price/performance of the entire SUT. In this case, the shorter the bar the better.
Key Takeaways from the results
- Performance is almost linearly proportional to the number of GPU cards. Checkout figures 1 to 4 and compare the performance of the R7515_T4x4 and R7525_T4x8 or R7525_A100x2 and R7525_A100x3.
- Performance significantly tracks the number of GPU cards. The Relative performance of the R7525_T4x8 is about 2.0 for most benchmarks. It has twice the number of GPUs than the reference system. The number of GPUs have a significant impact on performance.
- The more expensive GPUs provide better price/performance. From figure 5, the cost of the R7525_A100x3 configuration is 3x the cost of the reference configuration R7515_T4x4 but its relative price/performance is 0.61.
- The price of the RTX8000 is 2.22x of the price of the Tesla T4 as searched from the Dell website. The RTX8000 can be used with fewer GPU cards, 3 compared to 8xT4, at a lower cost. From Figure 5, the R7525_RTX8000x3 is 0.8333 x the cost of the R7525_T4x8, and it posts better price/performance and performance.
- Generally, Dell Technologies provides server configurations with the flexibility to deploy customer inference workloads on systems that match their requirements:
- The NVIDIA T4 is a low profile, lower power GPU option that is widely deployed for inference due to its superior power efficiency and economic value.
- With 48 GB of GDDR6 memory, the NVIDIA Quadro RTX 8000 is designed to work with memory intensive workloads like creating the most complex models, building massive architectural datasets and visualizing immense data science workloads. Dell is the only vendor that submitted results using NVIDIA Quadro RTX GPUs.
- NVIDIA A100-PCIe-40G is a powerful platform that is popularly used for training state-of-the-art Deep Learning models. For customers who are not on a budget and have heavy Inference computational requirements, its initial high cost is more than offset by the better price/performance.
Conclusion
As shown in the charts above, Dell EMC PowerEdge R7515 performed well in a wide range of benchmark scenarios. The benchmarks that are discussed in this paper included diverse use cases. For instance, image dataset inferencing (Object Detection using SSD-Resnet34 model on COCO dataset), language processing (BERT model used on SQUAD v1.1 for machine comprehension of texts), and recommendation engine (DLRM model with Criteo 1 TB clicks dataset).
Related Blog Posts

MLPerf Inference v0.7 Benchmarks on PowerEdge R740 Servers
Tue, 08 Dec 2020 17:45:45 -0000
|Read Time: 0 minutes
Introduction
MLPerf (https://mlperf.org) Inference is a benchmark suite for measuring how fast Machine Learning (ML) and Deep Learning (DL) systems can process input inference data and produce results using a trained model. The benchmarks belong to a diversified set of ML use cases that are popular in the industry and provide a standard for hardware platforms to perform ML-specific tasks. Hence, good performance under these benchmarks signifies a hardware setup that is well optimized for real world ML inferencing use cases.
System under Test (SUT)
- Server – Dell EMC PowerEdge R740
- GPU – NVIDIA Tesla T4
- Framework – TensorRT™ 7.2.0.14
Dell EMC PowerEdge R740
Table 1 Dell EMC PowerEdge R740 technical specifications
| Component | Description |
|---|---|
System name | PowerEdge R740 |
Status | Commercially available |
System type | Data center |
Number of nodes | 1 |
Host processor model lane | Intel® Xeon® Gold 6248R |
Host processors per node | 2 |
Host processor core count | 24 |
Host processor frequency | 3.00 GHz |
Host memory capacity | 384 GB DDR4, 2933 MHz |
Host storage | 3.84 TB SSD |
Host accelerator | NVIDIA Tesla T4 |
Accelerators per node | 4 |
NVIDIA Tesla T4
The NVIDIA Tesla T4, based on NVIDIA’s Turing architecture is one of the most widely used AI inference accelerators. The Tesla T4 features NVIDIA Turing Tensor cores which enable it to accelerate all types of neural networks for images, speech, translation, and recommender systems, to name a few. Tesla T4 supports a wide variety of precisions and accelerates all major DL & ML frameworks, including TensorFlow, PyTorch, MXNet, Chainer, and Caffe2.
Table 2 NVIDIA Tesla T4 technical specifications
| Component | Description |
|---|---|
GPU architecture | NVIDIA Turing |
NVIDIA Turing Tensor cores | 320 |
NVIDIA CUDA® cores | 2,560 |
Single-precision | 8.1 TFLOPS |
Mixed-precision (FP16/FP32) | 65 TFLOPS |
INT8 | 130 TOPS |
INT4 | 260 TOPS |
GPU memory | 16 GB GDDR6, 320+ GB/s |
ECC | Yes |
Interconnect bandwidth | 32 GB/s |
System interface | X16 PCIe Gen3 |
Form factor | Low-profile PCIe |
Thermal solution | Passive |
Compute APIs | CUDA, NVIDIA TensorRT™, ONNX |
Power | 70 W |
MLPerf Inference v0.7
The MLPerf inference benchmark measures how fast a system can perform ML inference using a trained model with new data that is provided in various deployment scenarios. Table 3 shows seven mature models that are in the official v0.7 release.
Table 3 MLPerf Inference Suite v0.7
| Model | Reference application | Dataset |
|---|---|---|
resnet50-v1.5 | vision/classification and detection | ImageNet (224 x 224) |
ssd-mobilenet 300 x 300 | vision/classification and detection | COCO (300 x 300) |
ssd-resnet34 1200 x 1200 | vision/classification and detection | COCO (1200 x 1200) |
bert | language | squad-1.1 |
dlrm | recommendation | Criteo Terabyte |
3d-unet | vision/medical imaging | BraTS 2019 |
rnnt | speech recognition | OpenSLR LibriSpeech Corpus |
The above models serve in various critical inference applications or use cases that are known as “scenarios.” Each scenario requires different metrics and demonstrates performance in a production environment. MLPerf Inference consists of four evaluation scenarios that are shown in Table 4:
- Single-stream
- Multi-stream
- Server
- Offline
Table 4 Deployment scenarios
| Scenario | Sample use case | Metrics |
|---|---|---|
Single-stream | Cell phone augmented reality | Latency in milliseconds |
Multi-stream | Multiple camera driving assistance | Number of streams |
Server | Translation sites | QPS |
Offline | Photo sorting | Inputs/s |
Results
The units on which Inference is measured are based on samples and queries. A sample is a unit on which inference is run, such as an image or sentence. A query is a set of samples that are issued to an inference system together. For detailed explanation of definitions, rules and constraints of MLPerf Inference see: https://github.com/mlperf/inference_policies/blob/master/inference_rules.adoc#constraints-for-the-closed-division
Default Accuracy refers to a configuration where the model infers samples with at least 99% accuracy. High Accuracy refers to a configuration where the model infers samples with 99.9% accuracy. For MLPerf Inference v0.7 result submissions, Dell EMC used Offline and Server scenarios as they are more representative of datacenter systems. Offline scenario represents use cases where inference is done as a batch job (for instance using AI for photo sorting), while server scenario represents an interactive inference operation (translation app).
MLPerf Inference results on the PowerEdge R740
Table 5 PowerEdge R740 inference results
| 3D-UNET | BERT | DLRM | ResNet50 | RNNT | SSD-ResNet34 | |||||
|---|---|---|---|---|---|---|---|---|---|---|
System | Scenario | Default accuracy | High accuracy | Default accuracy | High accuracy | Default accuracy | High accuracy | Default accuracy | Default accuracy | Default accuracy |
Dell EMC R740 (4 x T4) | Offline (samples/s) | 29 | 29 | 1,7329 | 743 | 13,1571 | 13,1571 | 23,844 | 5,875 | 546 |
Server (queries/s |
|
| 1,349 | 679 | 126,015 | 126,015 | 21,805 | 4,196 | 470 | |
Table 5 above shows the raw performance of the R740_T4x4 SUT in samples/s for the offline scenario and queries for the server scenario. Detailed results for this and other configurations can be found at https://mlperf.org/inference-results-0-7/.
Figures 1 and 2 below show the raw data inference performance of the R740_T4x4 SUT for five of the six MLPerf benchmarks that were submitted. Each bar graph indicates the relative performance of inference operations that are completed in a set amount of time while bounded by latency constraints. The higher the bar graph is, the higher the inference capability of the platform. Figure 3 compares offline scenario performance to server scenario and figure 4 compares offline performance using the default and high accuracy.
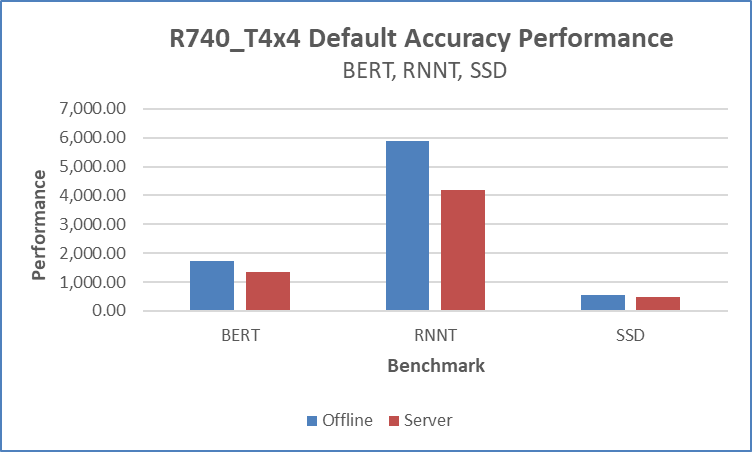
Figure 1 Default accuracy performance for (BERT,RNNT and SSD) offline and server scenarios
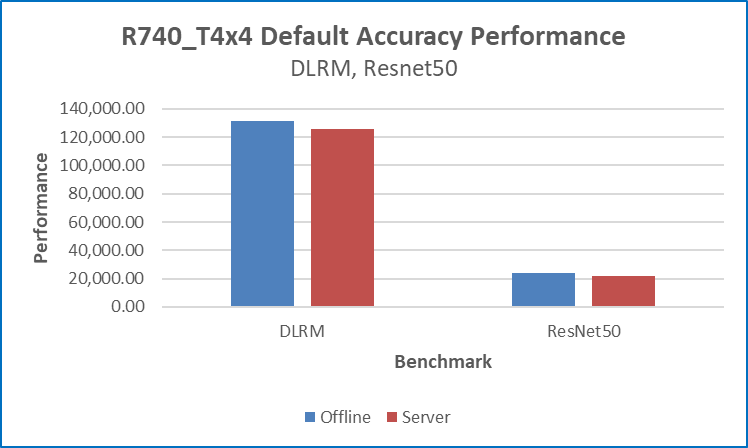
Figure 2 Default accuracy performance for DLRM and ResNet50 offline and server scenarios
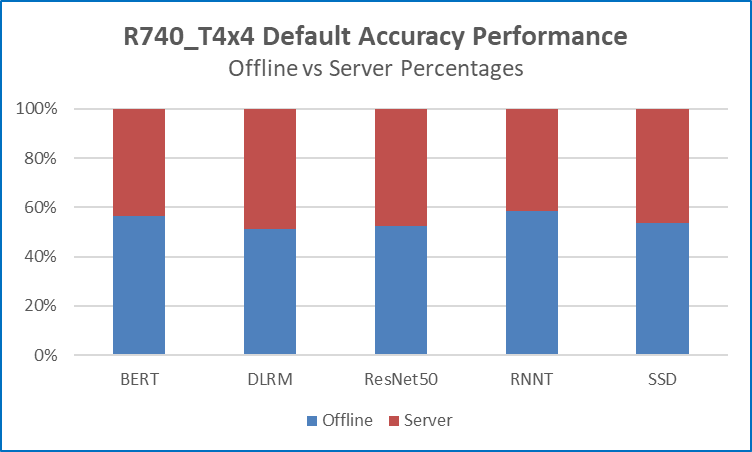
Figure 3 Comparing offline to server scenario performance
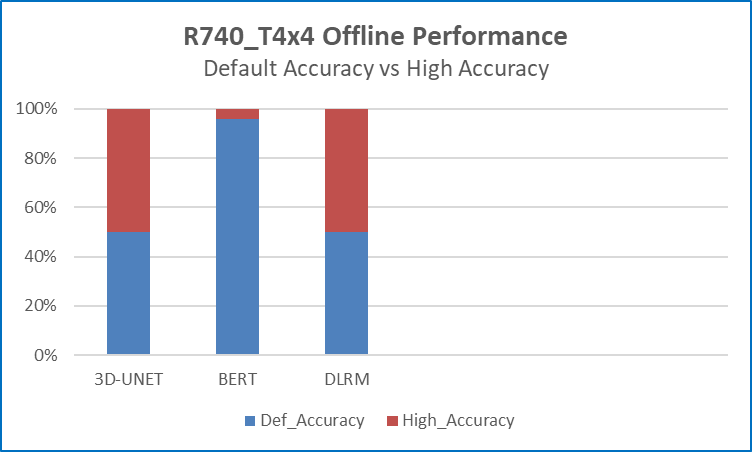
Figure 4 Comparing offline default accuracy to high accuracy performance
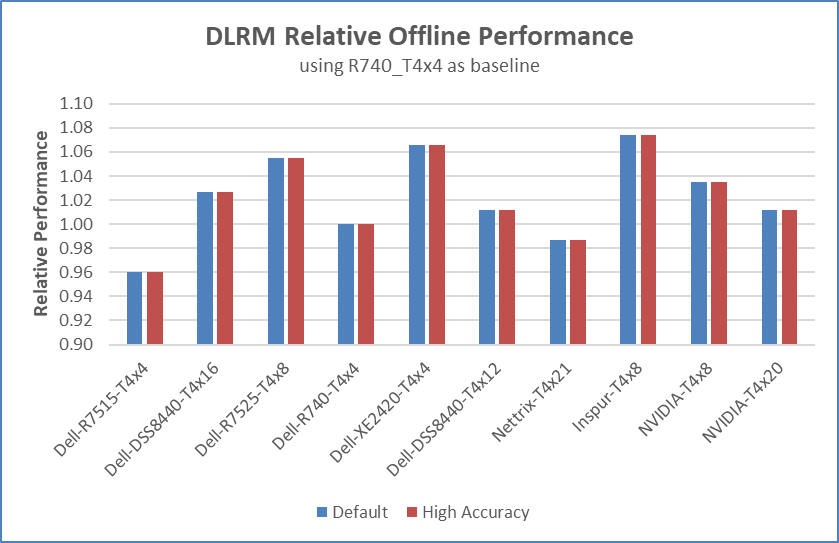
Figure 5 Comparing NVIDIA Tesla T4 configurations’ offline performance using R740_T4x4 as a baseline
Figure 5 shows the relative offline performance per GPU card for Tesla T4 configurations from several submitter organizations.
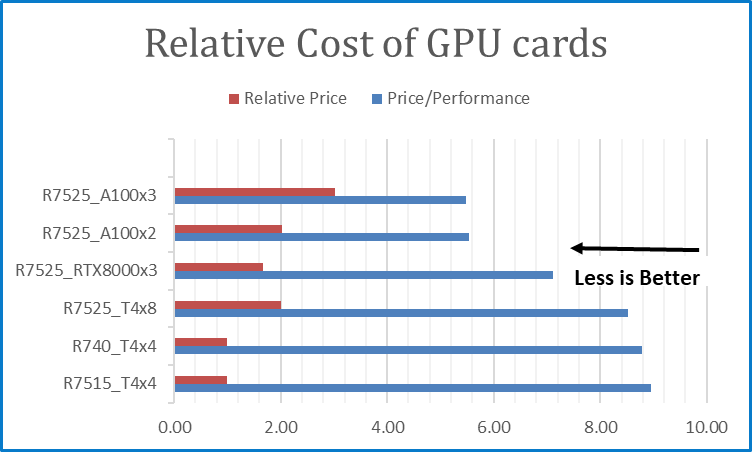
Figure 6 Relative cost of GPU card configurations using R740_T4x4 as baseline and its BERT default Performance
Figure 6 shows the relative price of each GPU configuration using the cost of Tesla T4 as the baseline and the corresponding price performance. The price/performance shown is an estimate to illustrate the “bang“ for the money that is spent on the GPU configurations and should not be taken as the price/performance of the entire SUT. In this case, the shorter the bar the better.
Key takeaways from the results
- The R740_T4x4 configuration could successfully perform Inference operations using six different MLPerf benchmarks for the offline scenario and five for the offline scenario.
- Performance is relatively stable across the two datacenter-centric scenarios. Figure 3 shows that the R740_T4x4 inference performance scores for the offline and server scenarios across five different benchmarks are very close. This means that performance will not drastically change due to changes in the type of input stream.
- It is all about accelerators. Figure 5 shows that the relative performance per GPU card of several Tesla T4 configurations is within 4% of each other. These are SUTs with different server platforms from several submitter organizations. 4% is statistically insignificant as it could be attributed to the performance noise level of these systems.
- The more expensive GPUs provide better price/performance. From figure 6, the cost of the R7525_A100x3 configuration is 3x the cost of the reference configuration R740_T4x4 but its relative price/performance is 0.61x.
- The price of the RTX8000 is 2.22x of the price of the Tesla T4 as searched from the Dell website. The RTX8000 can be used with fewer GPU cards, three compared to 8xT4, at a lower cost. From Figure 6, the R7525_RTX8000x3 is 0.8333 x the cost of the R7525_T4x8, and it posts better price/performance.
- Generally, Dell Technologies provides server configurations with the flexibility to deploy customer inference workloads on systems that match their requirements.
- The NVIDIA T4 is a low profile, lower power GPU option that is widely deployed for inference due to its superior power efficiency and economic value.
- With 48 GB of GDDR6 memory, the NVIDIA Quadro RTX 8000 is designed to work with memory intensive workloads like creating the most complex models, building massive architectural datasets and visualizing immense data science workloads. Dell is the only vendor that submitted results using NVIDIA Quadro RTX GPUs.
- NVIDIA A100-PCIe-40G is a powerful platform that is popularly used for training state-of-the-art Deep Learning models. For customers who are not on a budget and have heavy Inference computational requirements, its initial high cost is more than offset by the better price/performance.
Conclusion
As shown in the charts above, Dell EMC PowerEdge R740 performed well in a wide range of benchmark scenarios. The benchmarks that are discussed in this blog included diverse use cases. For instance, image dataset inferencing (Object Detection using SSD-Resnet34 model on COCO dataset), language processing (BERT model used on SQUAD v1.1 for machine comprehension of texts), and recommendation engine (DLRM model with Criteo 1 TB clicks dataset).

Unveiling the Power of the PowerEdge XE9680 Server on the GPT-J Model from MLPerf™ Inference
Tue, 16 Jan 2024 18:30:32 -0000
|Read Time: 0 minutes
Abstract
For the first time, the latest release of the MLPerf™ inference v3.1 benchmark includes the GPT-J model to represent large language model (LLM) performance on different systems. As a key player in the MLPerf consortium since version 0.7, Dell Technologies is back with exciting updates about the recent submission for the GPT-J model in MLPerf Inference v3.1. In this blog, we break down what these new numbers mean and present the improvements that Dell Technologies achieved with the Dell PowerEdge XE9680 server.
MLPerf inference v3.1
MLPerf inference is a standardized test for machine learning (ML) systems, allowing users to compare performance across different types of computer hardware. The test helps determine how well models, such as GPT-J, perform on various machines. Previous blogs provide a detailed MLPerf inference introduction. For in-depth details, see Introduction to MLPerf inference v1.0 Performance with Dell Servers. For step-by-step instructions for running the benchmark, see Running the MLPerf inference v1.0 Benchmark on Dell Systems. Inference version v3.1 is the seventh inference submission in which Dell Technologies has participated. The submission shows the latest system performance for different deep learning (DL) tasks and models.
Dell PowerEdge XE9680 server
The PowerEdge XE9680 server is Dell’s latest two-socket, 6U air-cooled rack server that is designed for training and inference for the most demanding ML and DL large models.
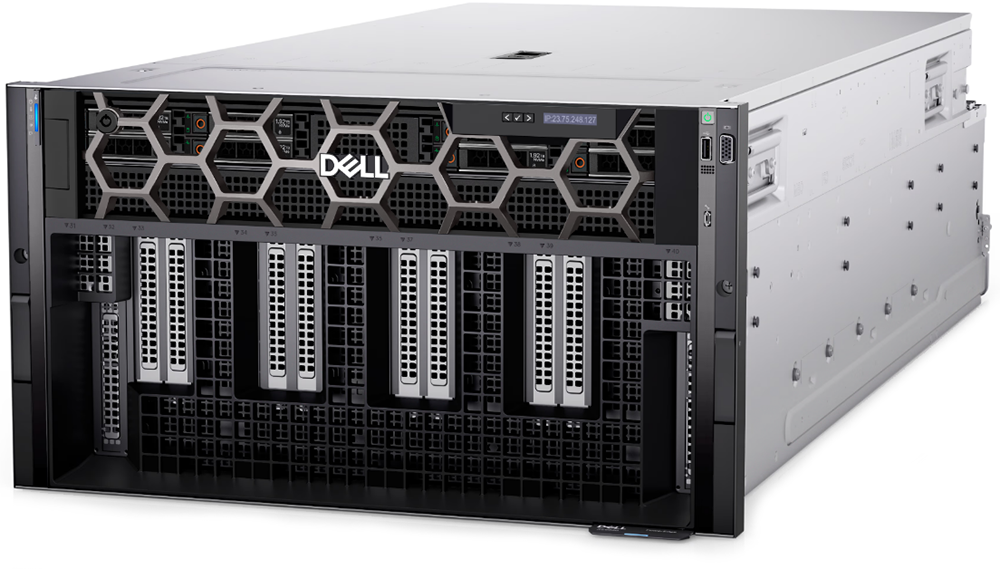
Figure 1. Dell PowerEdge XE9680 server
Key system features include:
- Two 4th Gen Intel Xeon Scalable Processors
- Up to 32 DDR5 DIMM slots
- Eight NVIDIA HGX H100 SXM 80 GB GPUs
- Up to 10 PCIe Gen5 slots to support the latest Gen5 PCIe devices and networking, enabling flexible networking design
- Up to eight U.2 SAS4/SATA SSDs (with fPERC12)/ NVMe drives (PSB direct) or up to 16 E3.S NVMe drives (PSB direct)
- A design to train and inference the most demanding ML and DL large models and run compute-intensive HPC workloads
The following figure shows a single NVIDIA H100 SXM GPU:
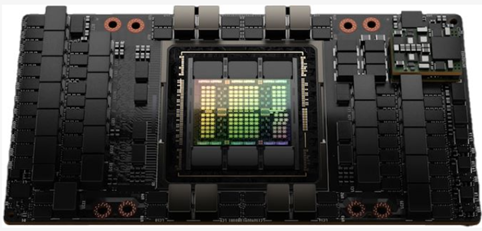
Figure 2. NVIDIA H100 SXM GPU
GPT-J model for inference
Language models take tokens as input and predict the probability of the next token or tokens. This method is widely used for essay generation, code development, language translation, summarization, and even understanding genetic sequences. The GPT-J model in MLPerf inference v3.1 has 6 B parameters and performs text summarization tasks on the CNN-DailyMail dataset. The model has 28 transformer layers, and a sequence length of 2048 tokens.
Performance updates
The official MLPerf inference v3.1 results for all Dell systems are published on https://mlcommons.org/benchmarks/inference-datacenter/. The PowerEdge XE9680 system ID is ID 3.1-0069.
After submitting the GPT-J model, we applied the latest firmware updates to the PowerEdge XE9680 server. The following figure shows that performance improved as a result:
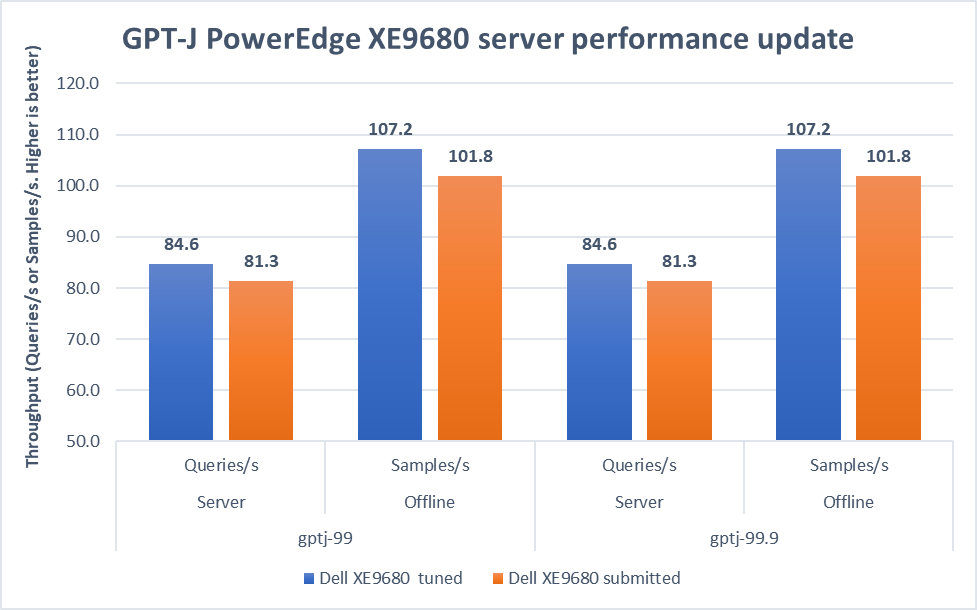
Figure 3. Improvement of the PowerEdge XE9680 server on GPT-J Datacenter 99 and 99.9, Server and Offline scenarios [1]
In both 99 and 99.9 Server scenarios, the performance increased from 81.3 to an impressive 84.6. This 4.1 percent difference showcases the server's capability under randomly fed inquires in the MLPerf-defined latency restriction. In the Offline scenarios, the performance saw a notable 5.3 percent boost from 101.8 to 107.2. These results mean that the server is even more efficient and capable of handling batch-based LLM workloads.
Note: For PowerEdge XE9680 server configuration details, see https://github.com/mlcommons/inference_results_v3.1/blob/main/closed/Dell/systems/XE9680_H100_SXM_80GBx8_TRT.json
Conclusion
This blog focuses on the updates of the GPT-J model in the v3.1 submission, continuing the journey of Dell’s experience with MLPerf inference. We highlighted the improvements made to the PowerEdge XE9680 server, showing Dell's commitment to pushing the limits of ML benchmarks. As technology evolves, Dell Technologies remains a leader, constantly innovating and delivering standout results.
[1] Unverified MLPerf® v3.1 Inference Closed GPT-J. Result not verified by MLCommons Association.
The MLPerf name and logo are registered and unregistered trademarks of MLCommons Association in the United States and other countries. All rights reserved. Unauthorized use is strictly prohibited. See www.mlcommons.org for more information.