


Live Broadcast Recording Using OneFS for Google Cloud, Gallery SIENNA ND, and Adobe Premiere Pro
Here at Dell Technologies, we tested a cloud native real-time NDI ISO feed ingest workflow based on Gallery SIENNA, OneFS, and Adobe Premiere Pro, all running natively in Google Cloud.
TL; DR... it's awesome!
Mark Gilbert (CTO at Gallery SIENNA) had noticed there was a growing demand in the market for highly scalable, enterprise-grade file storage in the public cloud for ISO recording. So, we were excited to test this much-needed solution.
Sure, we could have just spun up a cloud-compute instance, created some SMB shares or NFS exports on it, and off you go. But then you quickly find that your ability to scale becomes an issue.
Arguably, the most critical part of any live broadcast is the bulk recording of ISO feeds, and as camera technology improves, recorded data is growing at an ever-increasing pace. Resolutions are increasing, frame rates are faster and internet connection pipes are getting larger.
This is where OneFS for Google Cloud steps in.
Remote production is now a must rather than a nice-to-have for every studio. The production world has had to adopt it, embrace it and buckle in for the ride. There are some great products out there to help businesses enable remote-production workflows. Gallery SIENNA is one of these products. It enables NDI-from-anywhere workflows that help to reduce utilization on over-contended connections.
You can purchase OneFS for Google Cloud through the Google Cloud Marketplace, attach it to a Gallery SIENNA Processing Engine via NFS export and start recording at the click of a button. In our testing, as soon as the recorders began writing, we were able to open and manipulate the files in Adobe Premiere Pro, which we connected to via SMB to prove out that multi-protocol worked too. This was all while the files were being recorded, and we could expand them in real-time in the timeline as they grow.
Infrastructure components (provisioned in Google Cloud):
- 1 x OneFS for Google Cloud
- 1 x Ubuntu VM
- Running Gallery SIENNA ND Processing Engine
- 1 x Windows 10 VM
- NDI Tools
- Adobe Premiere Pro
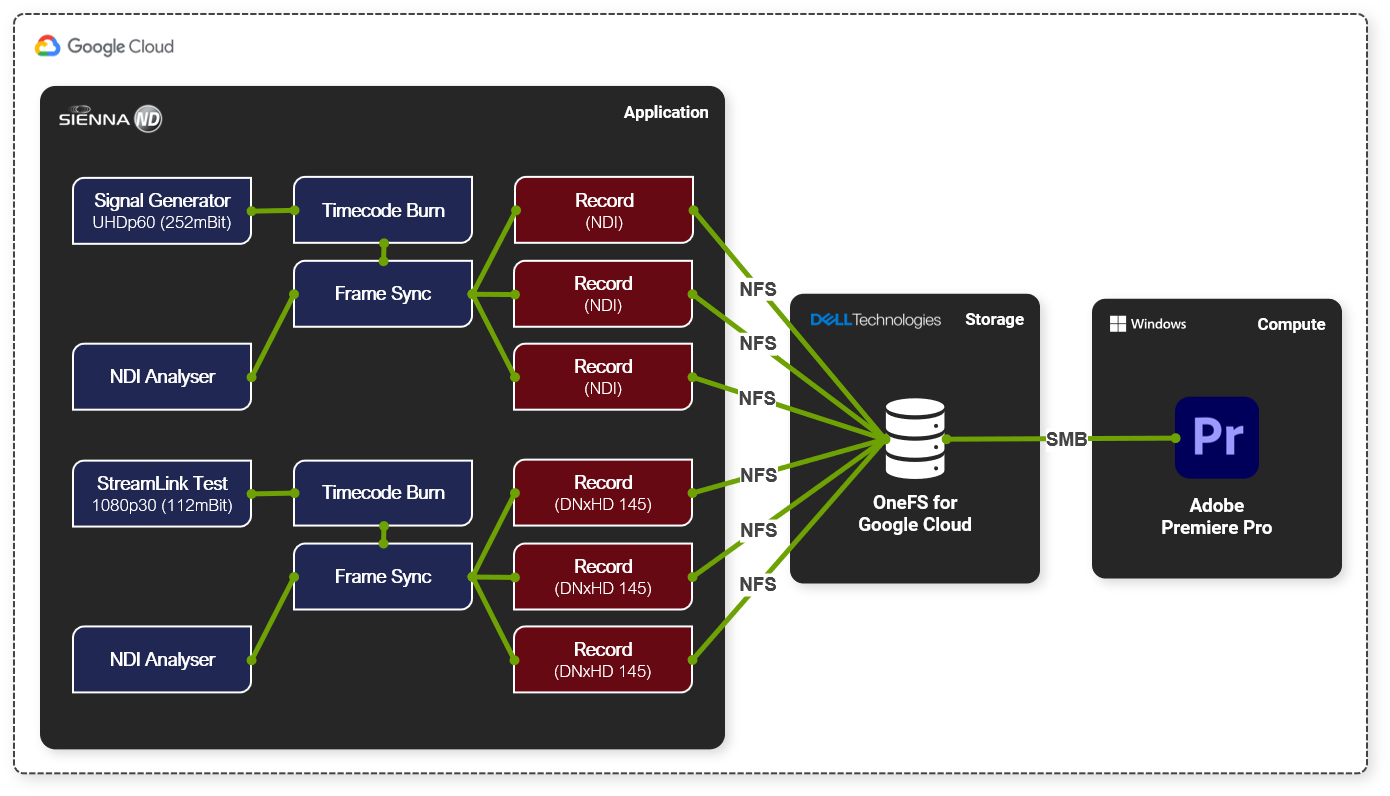
We used a SIENNA ND Processing Engine to generate six real-time record feeds, three of which were 3840p60 NDI and the other three of 1080p30 DNxHD 145
One of the great benefits of using Gallery SIENNA ND on Google Cloud is that our ingest could have come from anywhere. We could have used any internet-connected device that can reach the Google Cloud instance, be that a static connection in a purpose-built facility or a 4G/5G cell phone camera on the street with the NDI tools on it.
High-level workflow:
- Added a Signal Generator node (3840p60) into our SIENNA ND Processing Engine instance
- Used the SIENNA ND node-based architecture to add on a timecode burn and frame sync
- Added 3 x <NDI Recorder>
- Configured the recorders to write out to an NFS export on our OneFS for Google Cloud instance
- Added a StreamLink Test node (1080p30) into the same SIENNA ND Processing Engine instance
- Added timecode burn and frame sync nodes again
- Added 3 x <DNxHD 145 Recorder>
- Configured the recorders to write out to the same NFS export on our OneFS for Google Cloud instance
- Hit record on all recorders
Once the record was running, we added a "Media Picker" node and selected one of the files that we were recording. Then, we connected this growing file and one of the frame-sync outputs to a "multiviewer" node. We then watched both the live feed and chase play from disk as it was being laid down.
To cap it off, we also mounted one of the output paths using SMB from a Google Cloud hosted Windows 10 instance running Adobe Premiere Pro, and we were able to import, scrub and expand the files as they grew in real-time, allowing us to chase edit.
To find out more about the Dell Technologies offers for Media and Entertainment, feel free to get in touch by DM, or click here to find one of our experts in your time zone.
See the following links for more information about OneFS for Google Cloud and Gallery SIENNA.
Author: Andy Copeland
Related Blog Posts

Setting Up PowerScale for Google Cloud SmartConnect
Wed, 29 Dec 2021 17:48:23 -0000
|Read Time: 0 minutes
In the Dell EMC PowerScale for Google Cloud solution, OneFS uses the cluster service FQDN as its SmartConnect Zone name with a round-robin client-connection balancing policy. The round-robin policy is a default setting and is recommended for most cases in OneFS. (For more details about the OneFS SmartConnect load-balancing policy, see the Load Balancing section of the white paper Dell EMC PowerScale: Network Design Considerations.)
After the cluster is deployed, you must find the OneFS SmartConnect service IP in the clusters page within Google Cloud Console. Then, configure your DNS server to delegate the cluster service FQDN zone to the OneFS Service IP. You need to configure a forwarding rule in Google Cloud DNS which forwards the cluster service FQDN query to the DNS server, and set up a zone delegation on the DNS server that points to the cluster service IP. The following figure shows the DNS query flow by leveraging Google Cloud DNS along with a DNS server in the project.
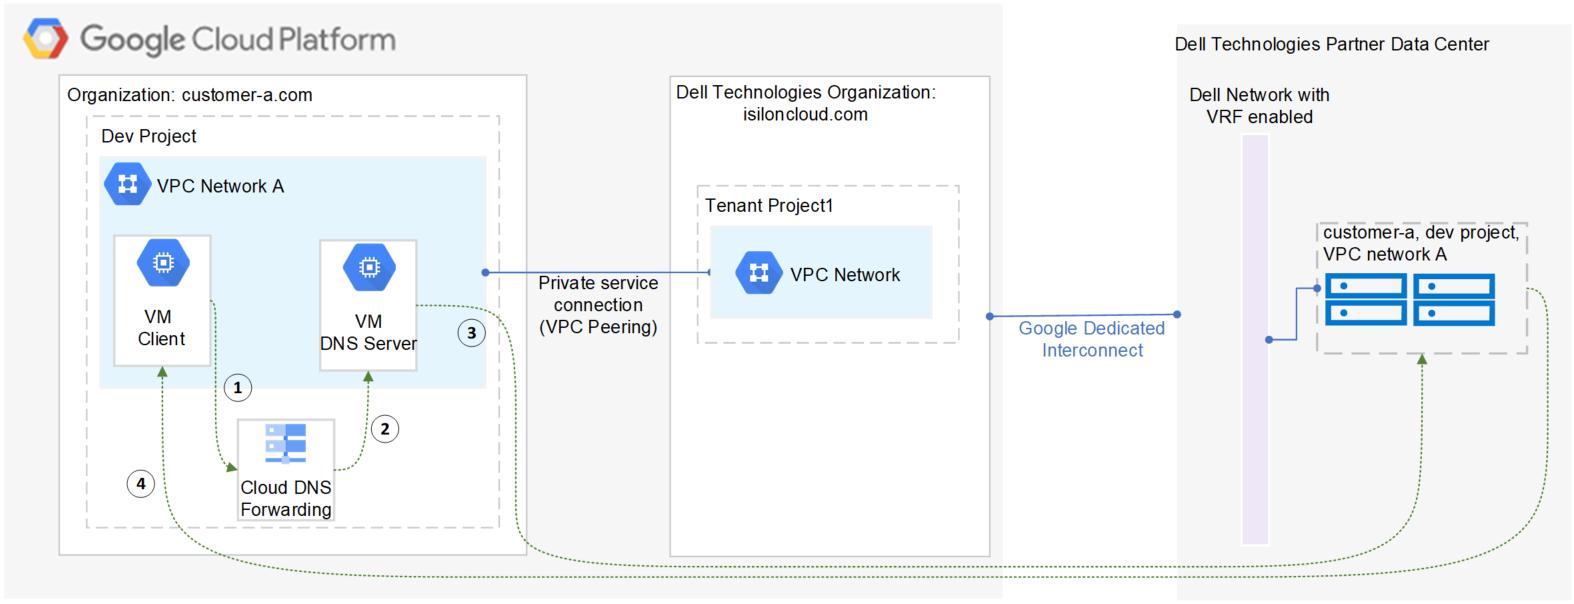
- VM clients send a DNS request for Cluster service FQDN to the Google Cloud DNS service.
- Google Cloud DNS forwards the request to the DNS server.
- The DNS server forwards the request to the cluster service IP. The service IP is responsible for translating the cluster service IP into an available node IP.
- SmartConnect returns a node IP to the client. The client can now access cluster data.
Because Google Cloud DNS cannot communicate with the OneFS cluster directly, we use a DNS server that is located in the authorized VPC network to forward the SmartConnect DNS request to the cluster. You can use either a Windows server or a Linux server. In this blog we use a Windows server to show the detailed steps.
Obtain required cluster information
The following information is required before setting up SmartConnect:
- Cluster service FQDN -- This is the OneFS SmartConnect zone name used by clients.
- Service IP -- This is the OneFS SmartConnect service IP that is responsible for resolving the client DNS request and returning an available node IP to clients.
- Authorized network -- By default, only the machines on an authorized VPC network can access a PowerScale cluster.
To obtain this required information, do the following:
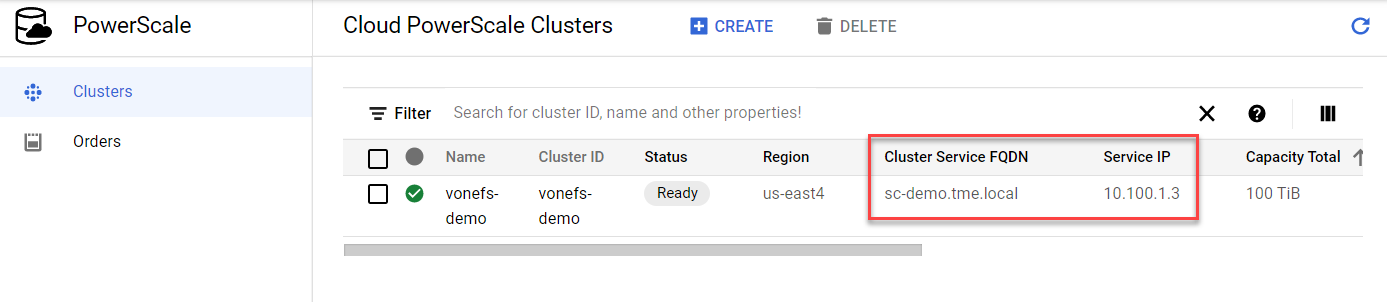
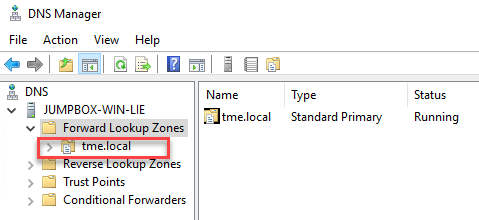
- In the Google Cloud Console navigation menu, click PowerScale and then click Clusters.
- Find your cluster row, where you can see the cluster service FQDN and service IP:
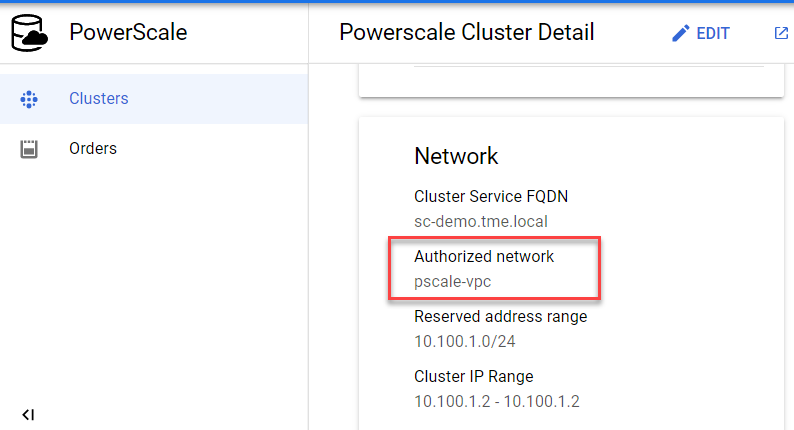
3. To find the authorized network information, click the name of the cluster. From the PowerScale Cluster Details page, find the authorized network from the Network information, highlighted here:
Set up a DNS server
If you already have an available DNS server that is connected to the cluster authorized network, you can use this existing DNS server and skip Step 1 and Step 2 below.
- In the Google Cloud Console navigation menu, click Compute Engine and then click VM instances. In this example, we are creating a Windows VM instance as a DNS server. Make sure your DNS server is connected to the cluster authorized network.
- Log into the DNS server and install DNS Server Role in the Windows machine. (If you are using a Linux machine, you can use Bind software instead.)
- Create a new DNS zone in the DNS server:
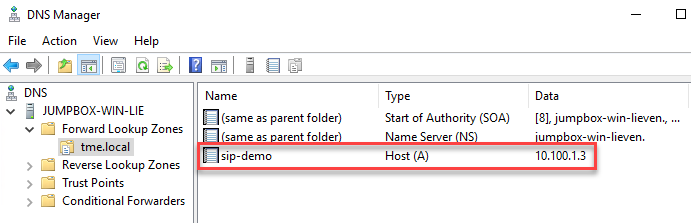
4. Create an (A) record for the cluster service IP. (See the section DNS delegation best practices of the white paper Dell EMC PowerScale: Network Design Considerations for more details.)
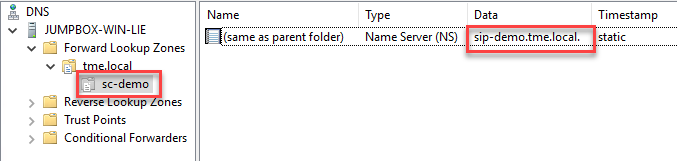
5. Create a new delegation for your cluster service FQDN (sc-demo.tme.local in this example) and point the delegation server to your cluster service IP (A) record created above (sip-demo.tme.local in this example), as shown here:
Configure Cloud DNS and firewall rules
- In the Google Cloud Console navigation menu, click Network services and then click Cloud DNS.
- Click the CREATE ZONE button.
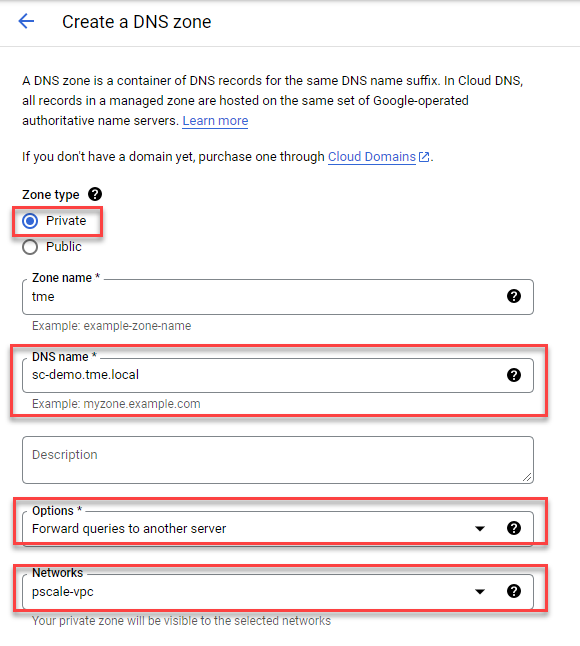
- Choose the Private zone type and enter your Cluster Service FQDN in the DNS name field. Choose Forward queries to another server and your cluster authorized network, as shown here:
4. Obtain the DNS server IP address that you configured in the ‘Set up a DNS server’ step.
5. Point the destination DNS server to your own DNS server IP address, then click the Create button.

6. Add firewall rules to allow ingress DNS traffic to your DNS server from Cloud DNS. In the Google Cloud Console navigation menu, click VPC network and then click Firewall.
7. Click the CREATE FIREWALL RULE button.
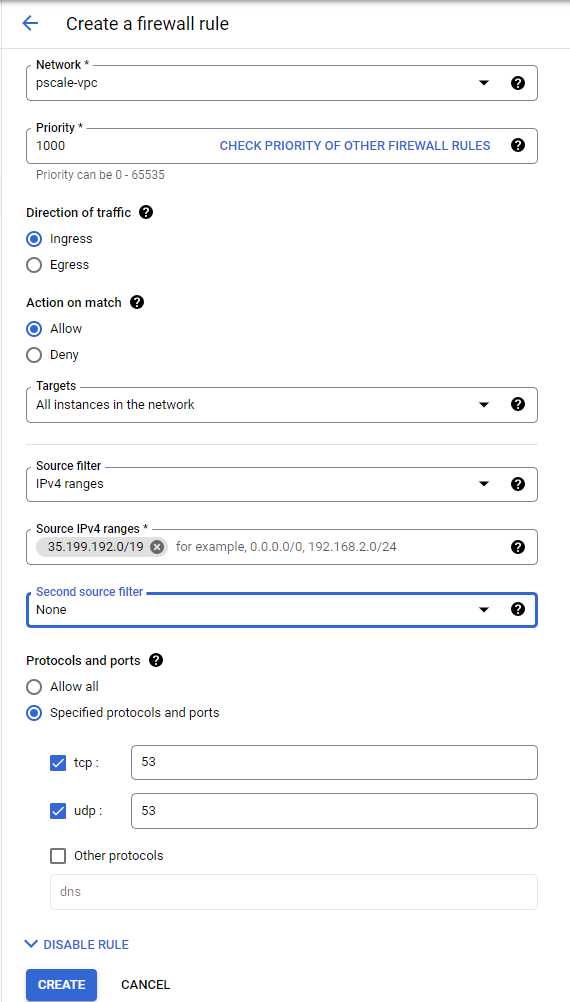
8. Create a new Firewall rule and include the following options:
- In the Network field, make sure the cluster authorized network is selected.
- Source filter: IPv4 ranges
- Source IPv4 ranges: 35.199.192.0/19. This is the IP range Cloud DNS requests will originate from. See Cloud DNS zones overview for more details.
- Protocols and ports: TCP 53 and UDP 53.
See the following example:
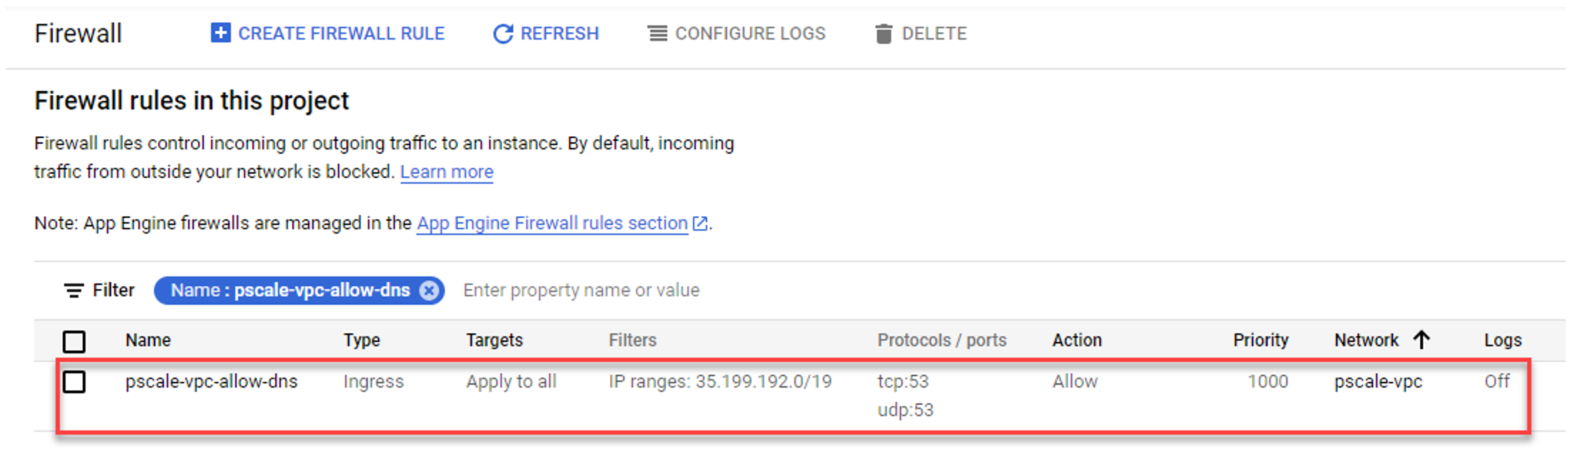
4. The resulting firewall rule in Google Cloud will appear as follows:
Verify your SmartConnect
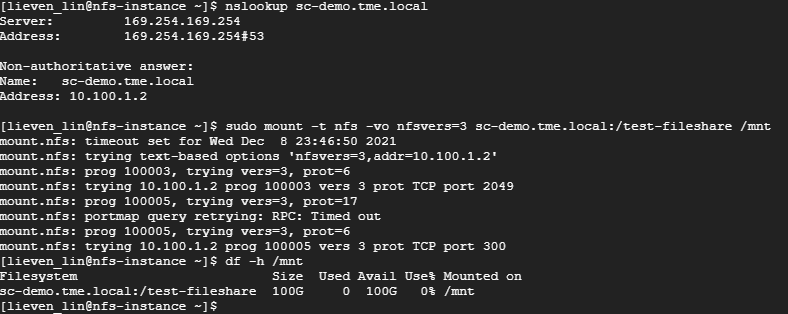
- Log into a VM instance that is connected to an authorized network. (This example uses a Linux machine.)
- Resolve the cluster service FQDN via nslookup and mount a file share via NFS.
Conclusion
PowerScale cluster is a distributed file system composed of multiple nodes. We always recommend using the SmartConnect feature to balance the client connections to all cluster nodes. This way, you can maximize PowerScale cluster performance to provide maximum value to your business. Try it now in your Dell EMC PowerScale for Google Cloud solution.
Author: Lieven Lin

Diary of a VFX Systems Engineer—Part 1: isi Statistics
Thu, 17 Aug 2023 20:57:36 -0000
|Read Time: 0 minutes
Welcome to the first in a series of blog posts to reveal some helpful tips and tricks when supporting media production workflows on PowerScale OneFS.
OneFS has an incredible user-drivable toolset underneath the hood that can grant you access to data so valuable to your workflow that you'll wonder how you ever lived without it.
When working on productions in the past I’ve witnessed and had to troubleshoot many issues that arise in different parts of the pipeline. Often these are in the render part of the pipeline, which is what I’m going to focus on in this blog.
Render pipelines are normally fairly straightforward in their make-up, but they require everything to be just right to ensure that you don’t starve a cluster of resource, which, if your cluster is at the center of all of your production operations can cause a whole studio outage, causing impact to your creatives, revenue loss, and unnecessary delays in production.
Did you know that any command that is run on a OneFS cluster is an API call down to the OneFS API. This can be observed if you add the --debug flag to any command that you run on the CLI. As shown here, this displays the call information that was sent to gather the information requested, which is helpful if you're integrating your own administration tools into your pipeline.
# isi --debug statistics client list
        2023-06-22 10:24:41,086 DEBUG rest.py:80: >>>GET ['3', 'statistics', 'summary', 'client']
        2023-06-22 10:24:41,086 DEBUG rest.py:81:    args={'sort': 'operation_rate,in,out,time_avg,node,protocol,class,user.name,local_name,remote_name', 'degraded': 'False', 'timeout': '15'}
        body={}
        2023-06-22 10:24:41,212 DEBUG rest.py:106: <<<(200, {'content-type': 'application/json', 'allow': 'GET, HEAD', 'status': '200 Ok'}, b'n{\n"client" : [  ]\n}\n')
There are so many potential applications for OneFS API calls, from monitoring statistics on the cluster to using your own tools for creating shares, and so on. (We'll go deeper into the API in a future post!)
When we are facing production-stopping activities on a cluster, they're often caused by a rogue process outside the OneFS environment that is as yet unknown to us, which means we have to figure out what that process is and what it is doing.
In walks isi statistics.
By using the isi statistics command, we can very quickly see what is happening on a cluster at any given time. It can give us live reports on which user or connection is causing an issue, how much I/O they're generating as well as what their IP is, what protocol they’re connected using, and so on.
If the cluster is experiencing a sudden slowdown (during a render, for example), we can run a couple of simple statistics commands to show us what the cluster is doing and who's hitting it the hardest. Some examples of these commands are as follows:
isi statistics system --n=all --format=top
Displays all nodes’ real-time statistics in a *NIX “top” style format:
# isi statistics system --n=all --format=top
Node   CPU SMB FTP HTTP NFS HDFS  S3 Total NetIn NetOut DiskIn DiskOut
 All 33.7% 0.0 0.0  0.0 0.0   0.0 0.0   0.0 401.6  215.6     0.0     0.0
   1 33.7% 0.0 0.0  0.0 0.0   0.0 0.0   0.0 401.6  215.6     0.0     0.0
isi statistics client list --totalby=UserName --sort=Ops
This command displays all clients connected and shows their stats, including the UserName they are connected with. It places the users with the highest number of total Ops at the top so that you can track down the user or account that is hitting the storage the hardest.
# isi statistics client --totalby=UserName --sort=Ops
 Ops     In  Out  TimeAvg   Node  Proto  Class   UserName  LocalName  RemoteName
-----------------------------------------------------------------------------
12.8 12.6M 1.1k  95495.8     *       *      *      root          *           *
-----------------------------------------------------------------------------
isi statistics client --UserName=<username> --sort=Ops
This command goes a bit further and breaks down ALL of the Ops by type being requested by that user. If you know the protocol that the user you’re investigating is using we can also add the operator “--proto=<nfs/smb>” to the command too.
# isi statistics client --user-names=root --sort=Ops
 Ops     In   Out  TimeAvg   Node  Proto           Class  UserName        LocalName    RemoteName
----------------------------------------------------------------------------------------------
 5.8   6.1M 487.2 142450.6     1   smb2           write      root 192.168.134.101 192.168.134.1
 2.8 259.2 332.8    497.2      1   smb2      file_state      root 192.168.134.101 192.168.134.1
 2.6 985.6 549.8  10255.1      1   smb2          create      root 192.168.134.101 192.168.134.1
 2.6 275.0 570.6   3357.5      1   smb2  namespace_read      root 192.168.134.101 192.168.134.1
 0.4   85.6  28.0   3911.5      1   smb2 namespace_write      root 192.168.134.101 192.168.134.1
----------------------------------------------------------------------------------------------
The other useful command, particularly when troubleshooting ad hoc performance issues, is isi statistics heat.
isi statistics heat list --totalby=path --sort=Ops | head -12
This command shows the top 10 file paths that are being hit by the largest number of I/O operations.
# isi statistics heat list --totalby=path --sort=Ops | head -12
  Ops   Node  Event  Class Path
----------------------------------------------------------------------------------------------------
141.7     *       *      * /ifs/
127.8     *       *      * /ifs/.ifsvar
 86.3      *      *      * /ifs/.ifsvar/modules
 81.7      *      *      * SYSTEM (0x0)
 33.3      *      *      * /ifs/.ifsvar/modules/tardis
 28.6      *      *      * /ifs/.ifsvar/modules/tardis/gconfig
 28.3      *      *      * /ifs/.ifsvar/upgrade
 13.1      *      *      * /ifs/.ifsvar/upgrade/logs/UpgradeLog-1.db
 11.9      *      *      * /ifs/.ifsvar/modules/tardis/namespaces/healthcheck_schedules.sqlite
 10.5      *      *      * /ifs/.ifsvar/modules/cloud
Once you have all this information, you can now find the user or process (based on IP, UserName, and so on) and figure out what that user is doing and what's causing the render to fail or high I/O generation. In many situations, it will be an asset that is either sitting on a lower-performance tier of the cluster or, if you're using a front side render cache, an asset that is sitting outside of the pre-cached path, so the spindles in the cluster are taking the I/O hit.
For more tips and tricks that can help to save you valuable time, keep checking back. In the meantime, if you have any questions, please feel free to get in touch and I'll do my best to help!
Author: Andy Copeland
Media & Entertainment Solutions Architect