


Increase Operational Efficiency with the Dell EMC PowerFlex App for Splunk
Tue, 04 Jul 2023 09:59:24 -0000
|Read Time: 0 minutes
In modern IT, admins struggle to manage and analyze enormous amounts of machine-generated data in order to understand its patterns and make important decisions. The Splunk Platform enables apps that can analyze and derive insights from data generated by disparate infrastructure layers, such as compute, storage, and network. The platform helps admins manage, visualize, analyze, and understand the various patterns efficiently and effectively to make the right decisions.
The Dell DMC PowerFlex software-defined platform is often used as an infrastructure foundation supporting multiple heterogeneous and SLA-sensitive workloads due to its scale-out nature and its ability to host workloads on a variety of hypervisors, containers, and bare metal platforms.
To support Splunk workloads, Dell Technologies offers the Dell EMC PowerFlex App for Splunk, integrating the PowerFlex environment with Splunk Enterprise. As a source for a vast amount of telemetry, the PowerFlex App for Splunk is a great tool for visualizing, monitoring, and capturing various PowerFlex storage metrics. It empowers the IT organizations to harness the power of data to improve IT outcomes by simplifying the storage management and operations.
Benefits to organizations
This app provides various benefits to organizations:
- Greater operational and storage efficiency
- Deeper storage environment insights
- Future capacity predictions
- Monitoring multiple storage environments from a single window
- Enhancing decision making capabilities based on historical trends
Key capabilities of the PowerFlex App for Splunk
Real-time visibility
24 out-of-the-box intuitive dashboards to visualize PowerFlex metrics in real-time. These metrics are logically grouped and presented in different dashboards.
Historical data
Historical data plays an important role in decision making. Taking decisive action before any event becomes a reality requires understanding the pattern over time. .
Health of the system
The app captures real time alerts at different levels, and they are categorized by severity.
Storage projection
This is one of the coolest features: using the native Splunk environment capabilities to forecast the future storage requirements based on the current usage.
Some sample dashboards
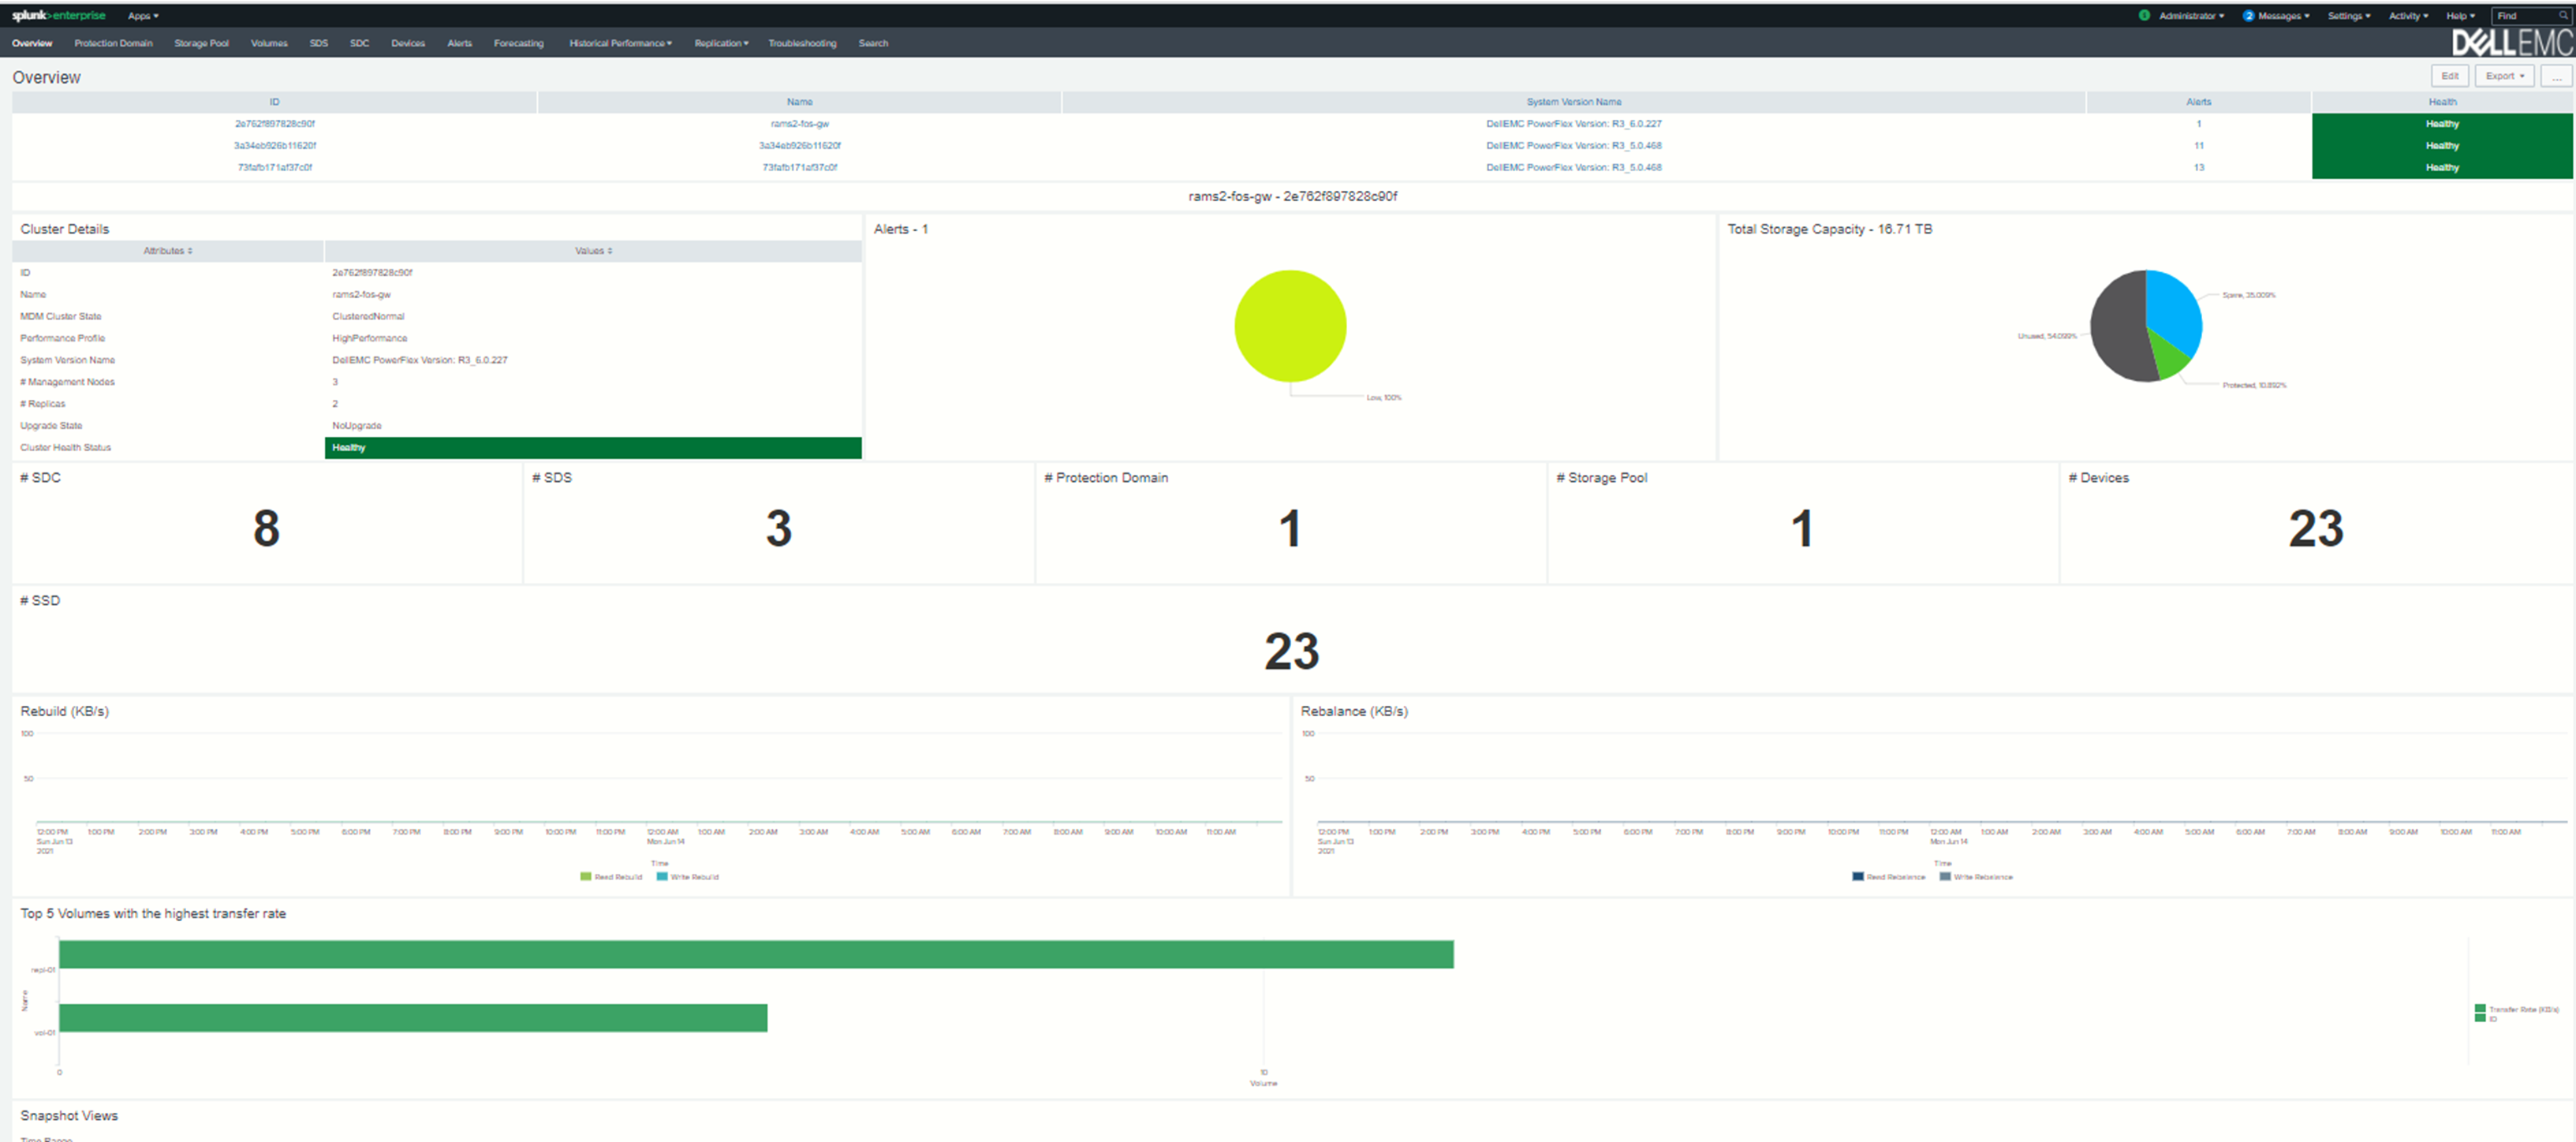
Overview Dashboard: Provides a summary of clusters and associated high level metrics, with navigation capabilities.
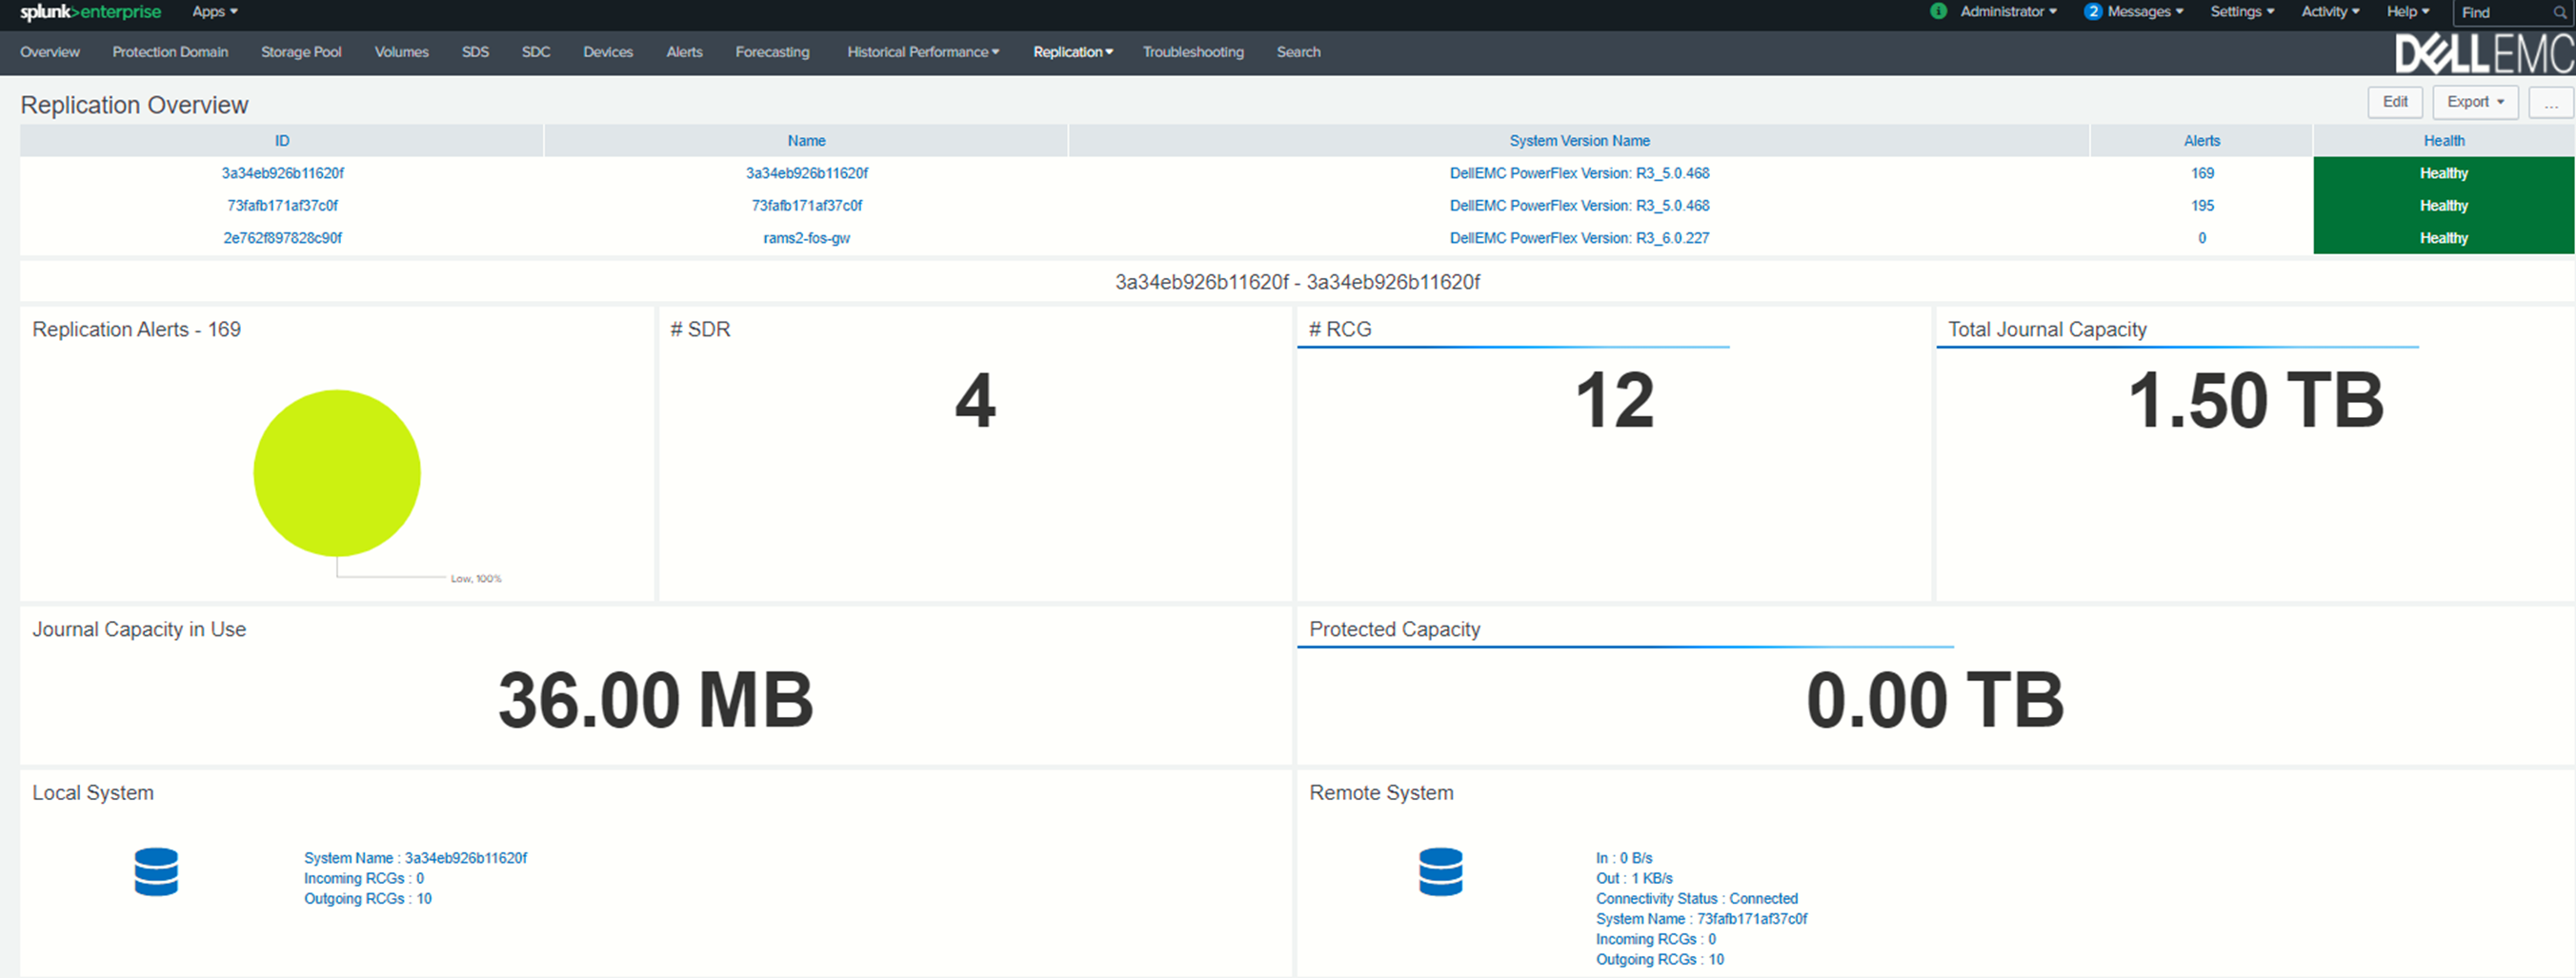
Replication Overview Dashboard: Provides a summary of Replication clusters and associated high level metrics.
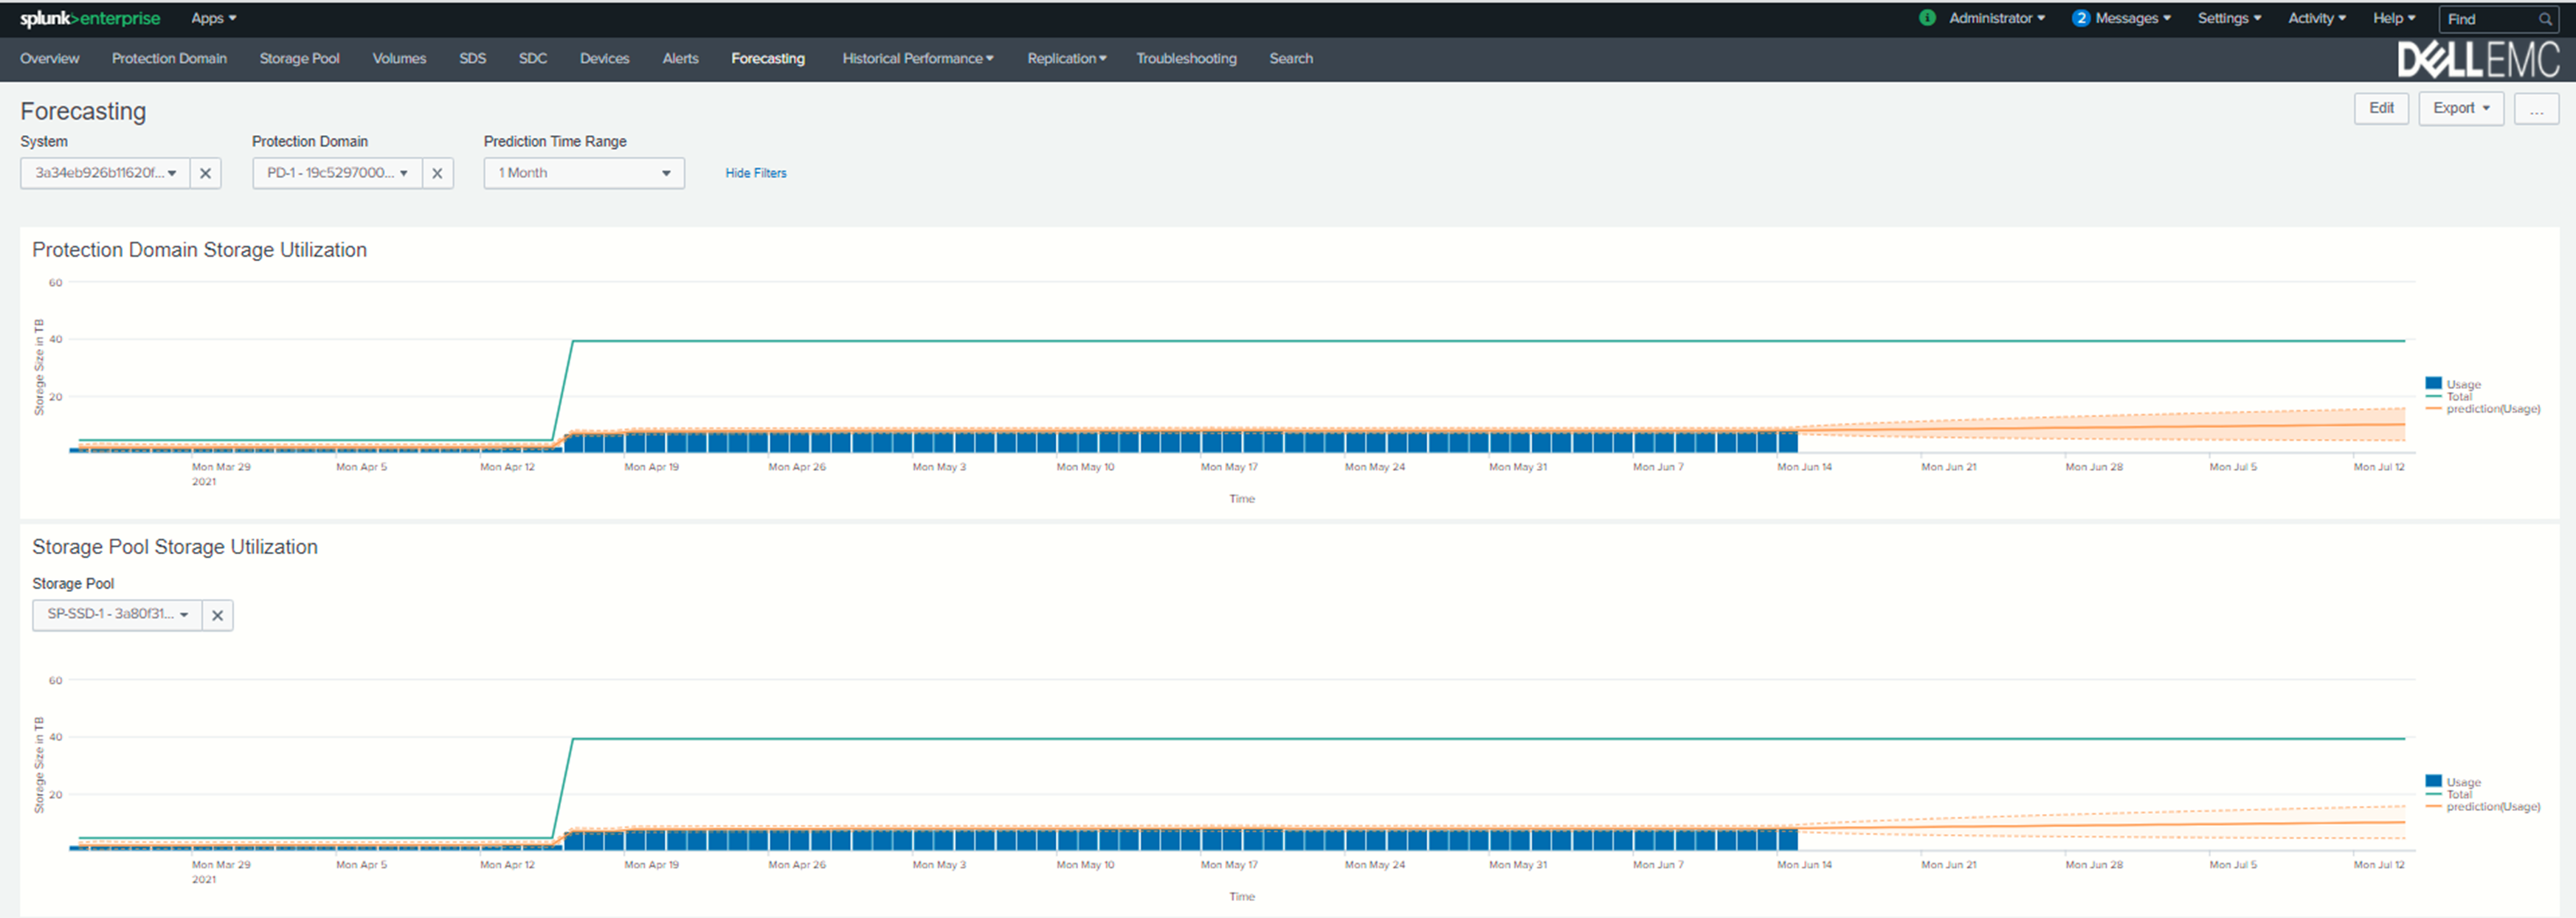
Storage Forecasting Dashboard: Provides the details of future storage requirements depending upon the current storage utilization.
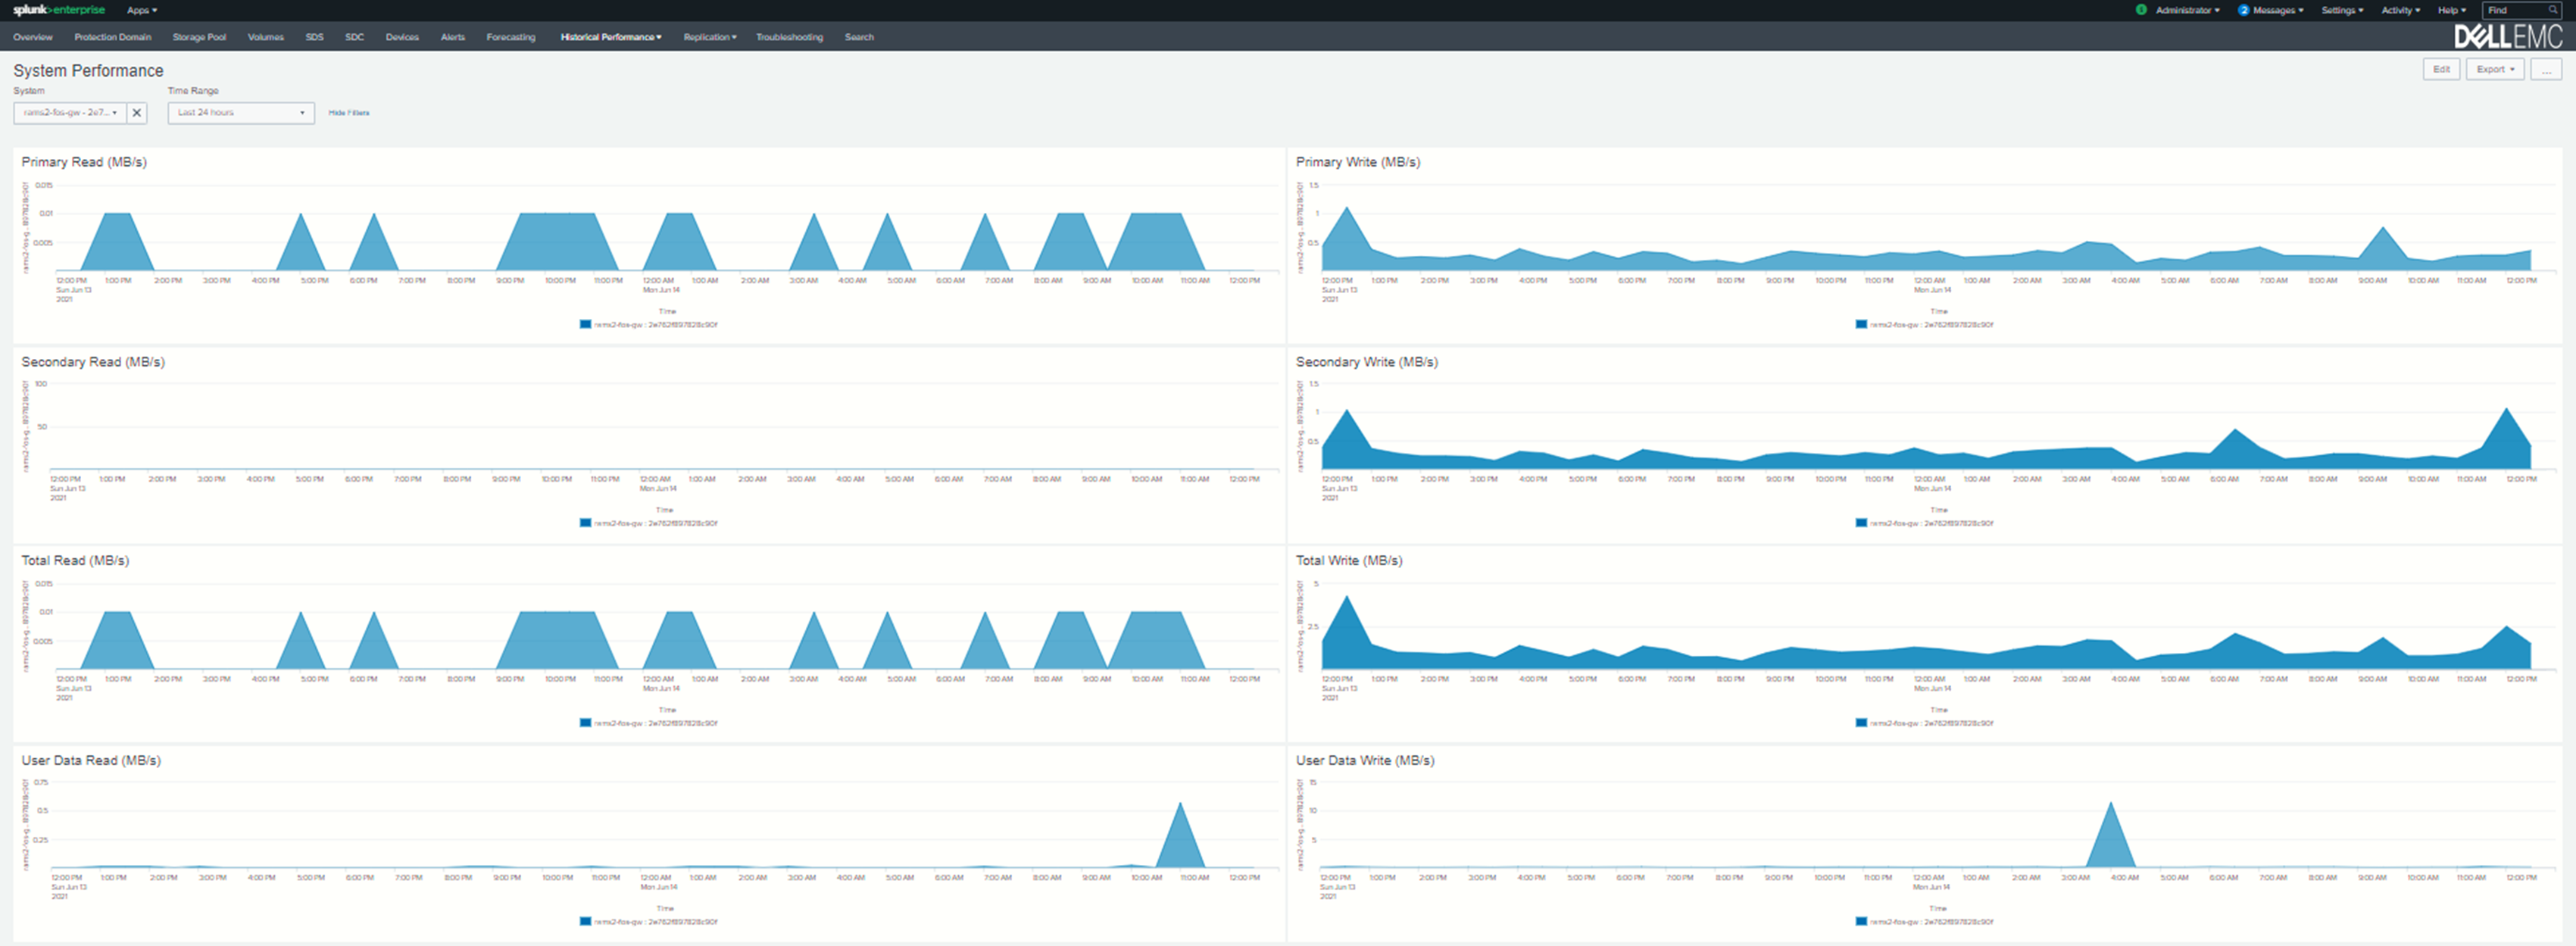
Historical Data Dashboard: Provides the historical performance data for the specified time intervals.
Related resources
PowerFlex App for Splunk infographic
Video: Dell EMC PowerFlex App for Splunk
Where to find Dell EMC PowerFlex App for Splunk
For those who are new to Splunk, you can get this app from http://splunkbase.splunk.com. This app comes in two parts:
- The Dell EMC PowerFlex App is available here https://splunkbase.splunk.com/app/5528/ and provides all the beautiful and awesome visualizations.
- The Add-on is available here https://splunkbase.splunk.com/app/5529/. This helps to configure the Gateways and to define the Instance End Points to make REST API calls.
Thanks for reading!
Author: Nataraj Naikar
Related Blog Posts

What’s new with the Dell AppSync 4.6 release?
Wed, 22 Mar 2023 21:21:49 -0000
|Read Time: 0 minutes
AppSync Overview
Dell AppSync is a software package that can simplify and automate the process of generating and consuming copies of production data. At a high level, AppSync can perform end-to-end operations such as quiescing the database, snapping the volumes, and mounting and recovering the database. For many end users, these manual operations can be complex without AppSync, because of different applications and storage platforms.
AppSync provides a single pane of glass, and its workflows work the same, regardless of the underlying array or application being protected. AppSync natively supports Oracle, Microsoft SQL Server, Microsoft Exchange, SAP HANA, VMware, Kubernetes, and file systems from various operating systems. The product also provides an extensible framework through plug-in scripts and REST API to deliver a copy data management solution for custom applications.
What’s new with the Dell AppSync 4.6 release?
The new version of AppSync, 4.6, was released on 03-22-2023. In this blog, we will go over some of the enhancements. This release brings many improvements to the application integration. SAP HANA now has PowerMax Scale out support. The Rancher distribution, PowerStore platform, and Microsoft SQL Server 2022 database are now supported with AppSync Kubernetes use cases. This release of AppSync also supports the newly released VMware 8.x and increases the SCSI controller limit. The Oracle database discovery process has also been improved, and Microsoft SQL Server 2022 use cases are supported for existing SQL service plans.
The SAP HANA scale-out architecture has two types. Shared NFS/File only and non-shared (shared folder on NFS file and data + log) on block iSCSI storage. AppSync 4.6 supports implementing this scale-out configuration on PowerMax 10.0+ storage with the file side implemented by SDNAS. Check out the screenshots below showing AppSync discovering the PowerMax NAS Servers and allowing users to choose the preferred NAS interface for the mount.
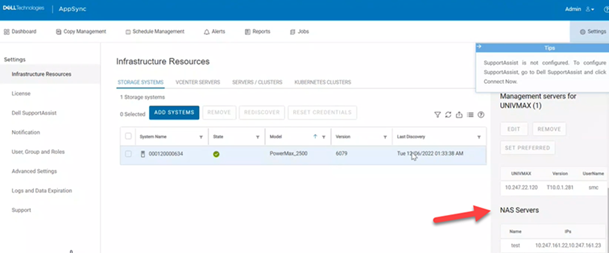 Figure 1 – PowerMax SDNAS support
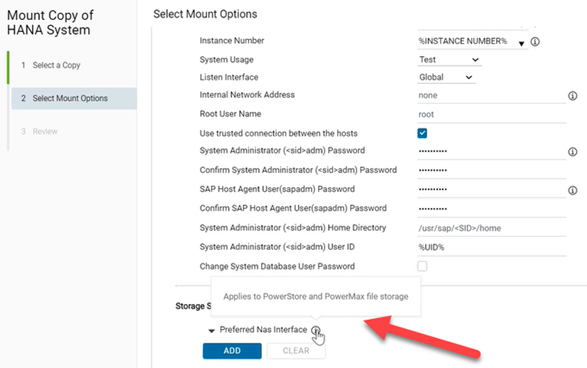 Figure 2 – Preferred NAS interface
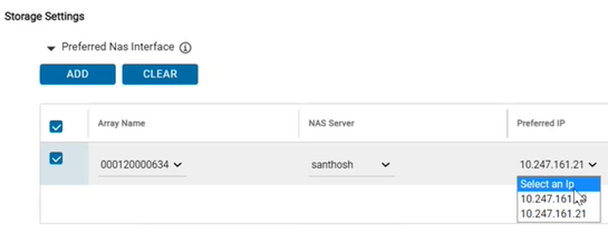 Figure 3 – NAS interface options
This AppSync 4.6 release allows customers to run AppSync Kubernetes use cases and workflows on PowerStore storage. Previous Kubernetes support with AppSync included support for SLES and Red Hat on bare metal and the Red Hat Openshift container platform, but with this new release of AppSync, we also support the SUSE Rancher distribution. Support for the Microsoft SQL 2022 database has also been added for Kubernetes use cases. Check out the screenshot below showing the new RKE or Rancher Kubernetes Engine cluster type.
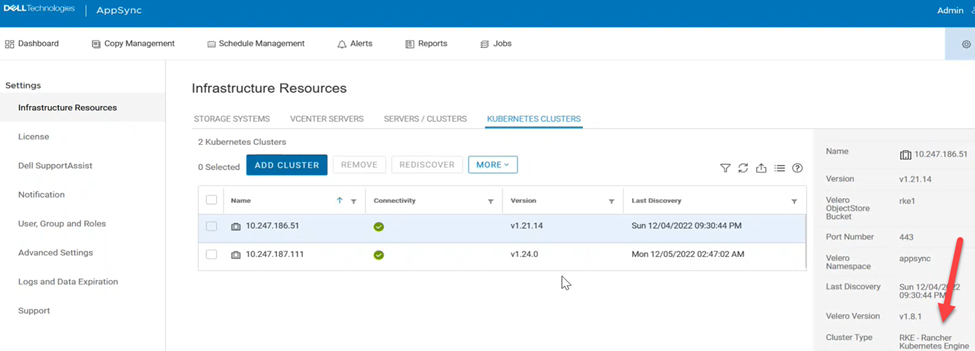 Figure 4 – Rancher Kubernetes Engine support
This release of AppSync also supports VMware 8.x and increases the SCSI controller limit. AppSync now supports 64 disks per VMware paravirtual SCSI controller.
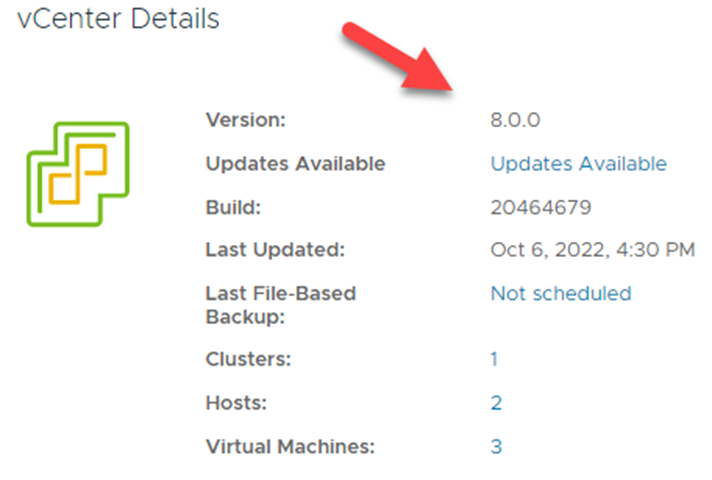 Figure5 – VMware 8.x support
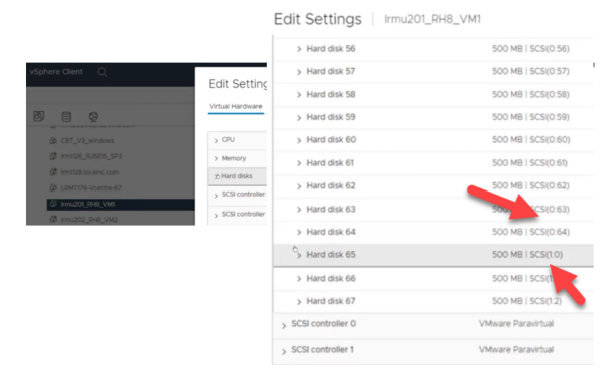 Figure 6 – Increased SCSI Controller limit
The AppSync Oracle database discovery process has also been improved with the 4.6 release. Oracle discovery can now be done using the PMON process and does not require an entry in the /etc/oratab file. This streamlined process involves AppSync checking every Oracle PMON process running on a given host to derive the corresponding SID and database name.
To improve the total customer experience, AppSync has added the ability for users to use and schedule maintenance mode. This allows users to suspend all scheduled jobs to perform maintenance activities as needed. Users can then perform whatever tasks they need to accomplish and not encounter any failed AppSync jobs or false alerts. They can also easily see which hosts are in maintenance mode and which are not. Alerts are also raised when hosts are put in and removed from maintenance mode. Check out the screenshots below showcasing the new exciting maintenance mode feature.
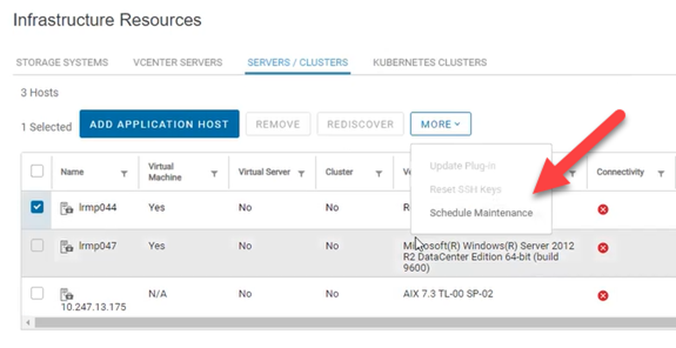 Figure 7 – Maintenance Mode
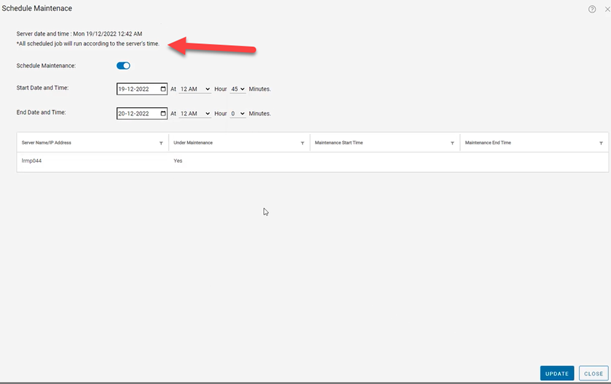 Figure 8 – Schedule Maintenance
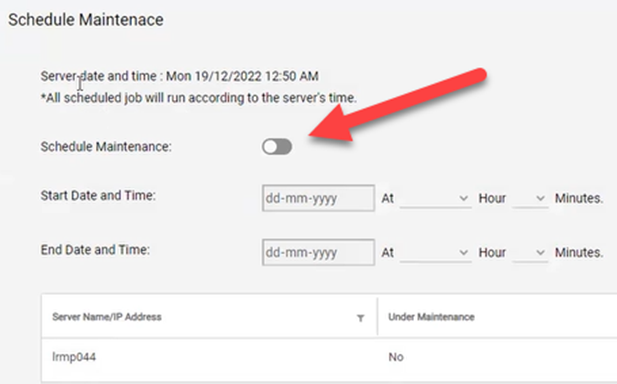 Figure 9 – Maintenance Toggle
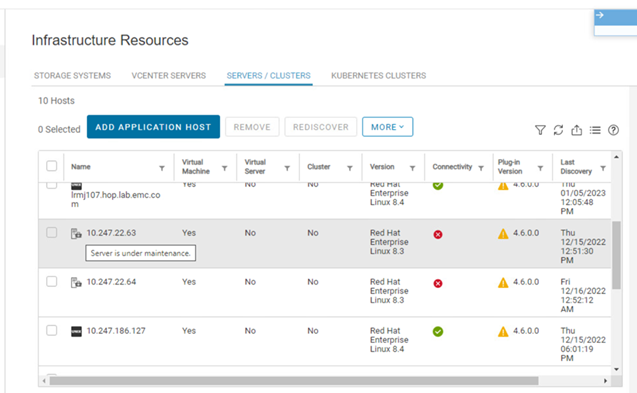 Figure 10 – Maintenance Status
Conclusion
I have outlined some of the Dell AppSync 4.6 release features. For more information, check out these resources:
- Dell Technologies Main Info Hub
- Dell Technologies AppSync Info Hub
- AppSync 90-day Trial Download
- Dell Technologies PowerStore Info Hub
- Dell Technologies PowerMax Info Hub
Author: Andrew Sirpis
Linkedin - https://www.linkedin.com/in/andrew-sirpis-2091162/

Smart Scale for Dell PowerProtect Appliances, Part III: MSU Migration, Replication, Recoverability, Security

Tue, 18 Jul 2023 15:44:25 -0000
|Read Time: 0 minutes
In the first blog post of this series, we covered what Smart Scale is and why we need it. In the second part of the series, we covered the architecture deep dive of the solution and how to deploy, set up, and configure workflows.
In this part, let’s discuss Smart Scale Mobile Storage Unit (MSU) migration, replication topology, recovery, and security.
Migrating Mobile Storage Units
Migrating a Mobile Storage Unit (MSU) is a new feature that helps to migrate a MSU from one DD series appliance to another. In the following figure, notice that “MSU7” has been migrated to DD series appliance 3 from DD series appliance 2 and the client continues to use the “MSU7” on DD series appliance 3 for backup and recovery operations.
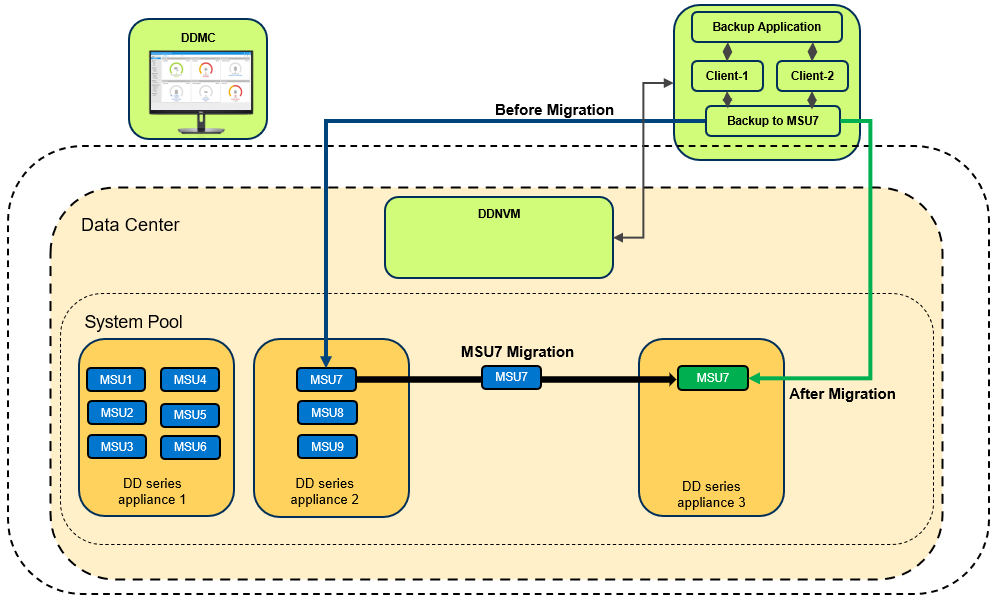
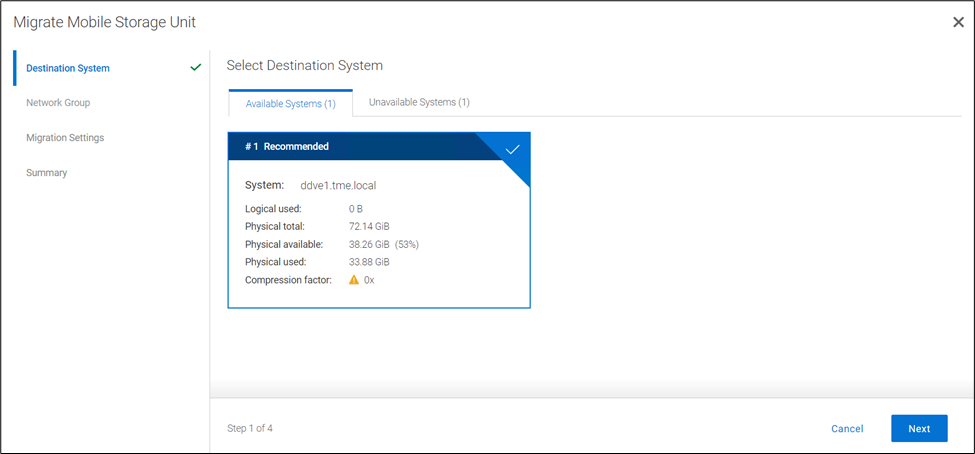
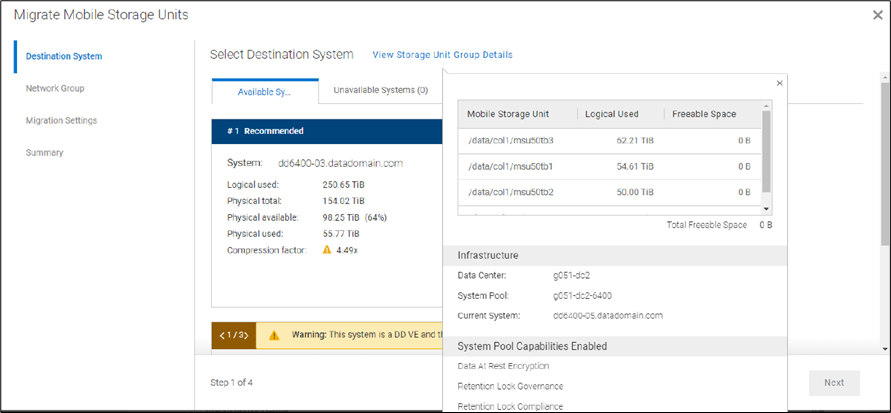
When you initiate the migration, the Migration and Placement Service provides the recommended list of DD series appliances from the available list of DD series appliances in the Data Center. Based on that list, you can select the target system and initiate the migration.
You can select which Network Group to use, and can select from the following migration transfer priorities:
- Balanced Transfer – Balances the resources between the backup and the migration
- Fast Transfer – Uses more resources for migration
- Minimum system impact – Uses fewer resources for the migration
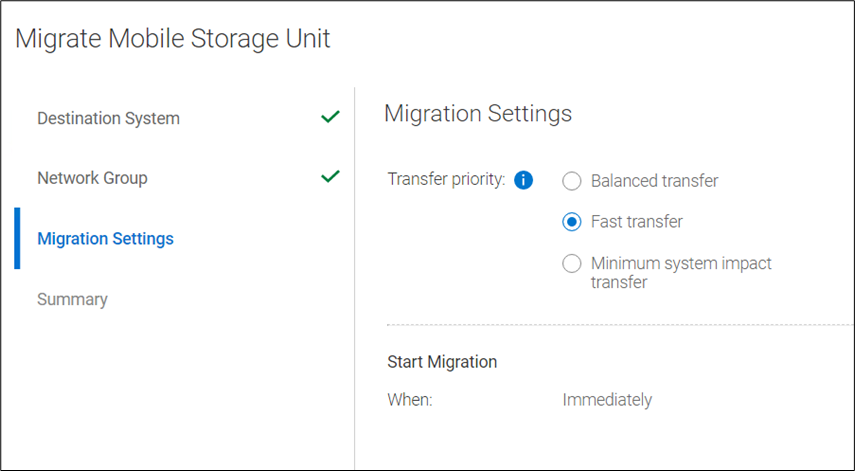
The final step of the migration provides a Review and Commit screen, which includes several migration statistics (such as logical capacity used, physical capacity used and available, and compression factor). Using these analytics, users can optimize appliance and workload lifecycles. When the migration job reaches 100%, it is ready to commit. All the operations (backup or restore) to the source MSU need to be canceled or stopped before committing the migration. There are two options available for the source MSU: you can either mark the MSU to be deleted after a successful migration or you can keep the MSU on the source system. When the commit is done, the remaining data that needs to be synced with the target DDR will be updated. The source MSU is marked as read only; the target MSU is marked as read write. The source MSU is demoted to an Mtree and target system has a new MSU with the same name. The Migration and Placement Service in PowerProtect DD Management Center updates the Namespace Redirection Service Data Manager (NRSDM) about the new location of the MSU. NRSDM then provides that information to the NRS. When a boost client now requests the physical location of the MSU to write the data, NRS provides the target DDR’s IP address. Critically, none of these operations requires reconfiguring the backup software.
Note: Smart Scale is an additional feature of DDMC designed to make administration simple, agile, and flexible. When Smart Scale services are enabled, the customer’s existing environment remains undisturbed. This means that traditional backup operations and storage units co-exist with operations that system pools and mobile storage units support.
MSU affinity group migration
Starting with DDMC version 7.12, migration of a group of MSUs in an affinity group (or a subset of the group) from one DD system to another in a system pool is supported. With MSU affinity group migration, a DDMC administrator can migrate a group of MSUs without having to manually set up multiple migration jobs. There can be up to 32 MTrees in an affinity group.
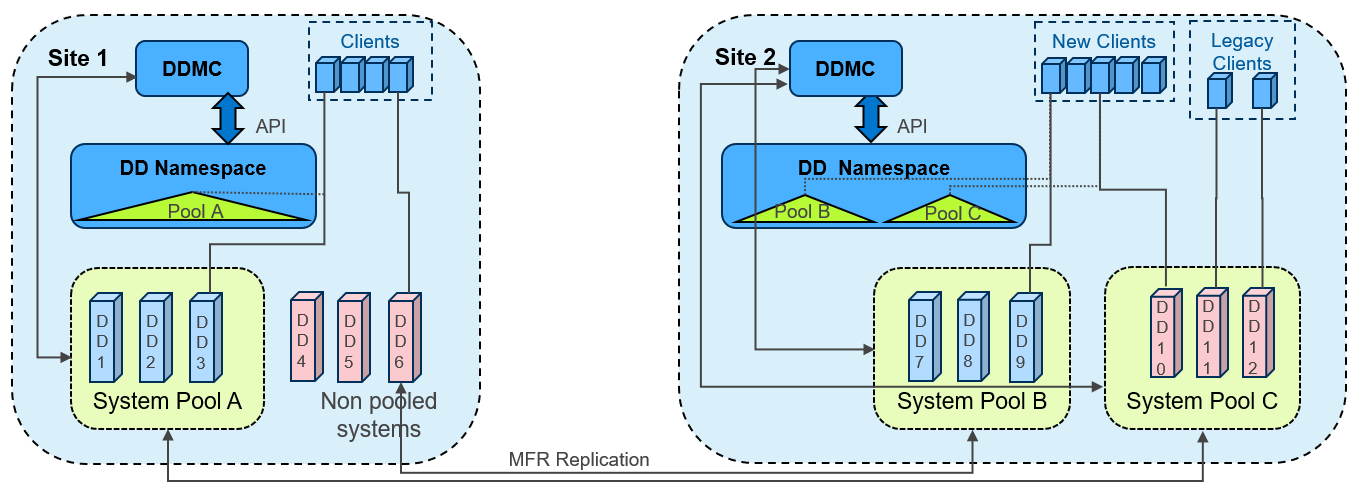
Replicating Mobile Storage Units
DD series appliances provide automated, policy based, network efficient, and encrypted replication for disaster recovery and multi-site backup and archive consolidation. Smart Scale supports Managed File Replication (MFR) on Mobile Storage Units (MSUs) with Dell PowerProtect Data Manager, Dell NetWorker, and Veritas NetBackup. Types of replications supported are:
- Storage Unit to Storage Unit
- MSUs to Storage Unit, and Storage Unit to MSUs
- MSUs to MSUs
Replication is supported between storage units or MSUs that are within the same data center or not, within the same system pool or not, within the same appliance or not, and within the management domain of a single DDMC or across DDMC deployments.
Recoverbility of Smart Scale services
In the era of performance on appliances, what organizations often ignore is the recoverability of the appliance or service when failures occur. Dell recognizes the importance of your SLA and RPO, keeping that in mind we have built Smart Scale architecture so that it provides an automated response to any disaster, by providing options for quick recovery to ensure minimum downtime.
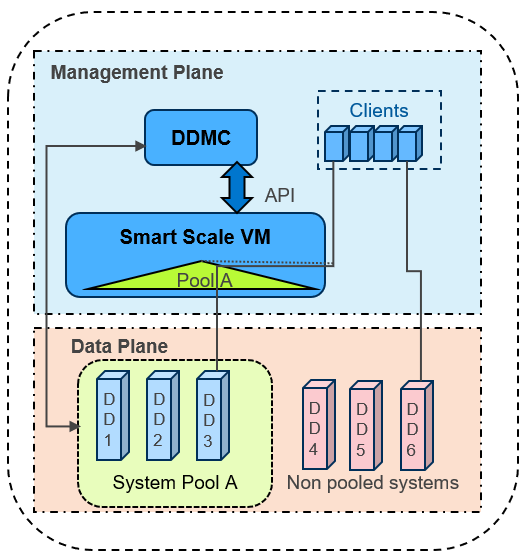
Let’s divide the Smart Scale architecture into two parts: the Management plane which has all the Smart Scale management services, and the Data plane which stores the actual data (that is, the DD series appliance). Now let’s examine the various recovery abilities available in both planes.
In the management plane
- Smart Scale has intelligent Analytics Services that provide capacity predictions, initial placement, and rebalancing recommendations.
- Micro services in PowerProtect DD Management Center (DDMC) and DD Namespace VM (DDNVM) automatically restart and recover as needed.
- Automated alert notifications are triggered by periodic monitoring of services in DDMC and Namespace VM. In the worst case, DDMC administrators may need to redeploy DDNVM using DDMC (which is quick, by just re-entering the VM credentials).
- The reconciliation service automatically resynchronizes and fixes discrepancies between DDMC and DDNVM.
- DDMC backs up the configuration regularly on a timed basis and whenever administrators make a configuration change.
- DDMC can be recovered with a clean reinstall using configuration backup. If there are no issues in the DDNVM, DDMC can then resynchronize with the running DDNVM, with no need to redeploy DDNVM.
In the data plane
- Data Center services hold a copy of the overall namespace for each pool of DD series appliances, to enable the redirection of backup clients to the appropriate DD series appliance in the pool
- After it is redirected, the backup client connects to the DD series appliance and starts data transfer, then (unless it is restarted) it continues to work even if DDMC or DDNVM have any issues.
- DDMC VM will redeploy DDNVM if necessary
- DDNVM continues working even if DDMC is not available
- Reinstalling DDMC does NOT require reinstalling DDNVM
Security options with Smart Scale services
With the increased rate of cyber-attacks and ransomware threats, it is essential to have services and appliances that have adequate security restrictions for shielding your data from malicious attacks. Smart Scale enables security at every level of the solution. Let’s take a look at the security options available:
Data plane
- D@RE Encryption at rest is supported within Smart Scale. A System Pool may have a mix of encrypted and non-encrypted systems. During migration a warning is given if the selected migration is from encrypted to non-encrypted systems.
- Encryption in flight is supported both for backup/restore and replication, with the same modes of operation as regularly available for PowerProtect appliances.
- MSUs are protected by Mobile Boost Users. These users are migrated between systems automatically as required when MSUs are migrated.
Management plane
- Overall security is applied and managed from DDMC, both in the creation of System Pools and in the creation and mobility of MSUs.
- Certificates are enabled to secure communications between DDMC and DDNVM.
- Most services run as non-root user.
- DDNVM is guest OS enabled, and no customer login is allowed.
Network security
- When creating and enabling MSUs, the supported network groups are selected. Redirection from Pool Access IP to MSUs is restricted only to those network groups enabled for specific MSUs.
- VLANs are supported (but not mandated) using either trunk or access mode (that is, tagging on the node or the network switch) for both appliances and DDNVM.
Smart Scale is about simplifying capacity management across multiple DD series appliances, but it's more than just management and reporting. While it includes analytics, insights, and recommendations around capacity needs and placement, the real value is the system pooling and management it provides. Smart Scale services deliver the next generation of data protection scale, mobility, and insights for PowerProtect DD series appliances.
Thank you for taking a moment to read this series of Smart Scale blog posts. We hope they were useful and helped you to understand the Smart Scale feature comprehensively.
To catch up on the previous Smart Scale blog posts in this series, see:
- Smart Scale for Dell PowerProtect Appliances, Part I: Innovative Technology to Manage Multi-Exabyte Data
- Smart Scale for Dell PowerProtect Appliances, Part II: Architecture Deep Dive
Additional resources for Smart Scale
- Dell PowerProtect DD series appliances
- Smart Scale for PowerProtect Appliances – Technical white paper
- Dell PowerProtect DD Management Center Interactive Demo
Authors: