


Direct from Development - PowerEdge MX7000 Chassis Management Networking Cabling
Thu, 12 Nov 2020 18:48:02 -0000
|Read Time: 0 minutes
Summary
This blog describes the new and improved features of the MX7000 chassis management network, provide recommended network cabling diagrams, and show the fault tolerant capabilities of the new network design in the new Dell EMC 14G MX7000 chassis.
The MX7000 chassis features dual redundant management modules, with each management module featuring two management network ports, for a total of 4 management network ports on the chassis.
The management network is meant to provide network connections for chassis management that is separate from the customer data network. There are several new and improved design points for this network compared to previous generation chassis that significantly impact how these new chassis should be cabled and managed.
New Feature: Automatic Uplink Detection
The first thing to notice about the MX7000 network physical chassis is labelling: as opposed to the older M1000e chassis, you will notice that the management ports are not labelled “STK” (stacking) or GB (uplink), but rather just GB 1 and GB 2. Because of the new automatic detection features in MX7000, you can use any port for stacking and/or uplink, and the management module will automatically detect each port to determine if it is a stacking or uplink port.
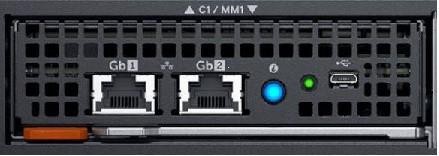
Figure 1 – MX7000 Management Module
New Feature: Network Loop Prevention
When cabling chassis in a stack, you will notice is what appear to be connections forming network loops and redundant connections between the chassis. The management modules will automatically detect redundant ports between chassis and will block packets automatically to prevent network loops from forming.
There are a couple points worth noting about this feature. First, when you stack chassis and cable them together, only one uplink will ever forward traffic out of the stack. The recommended cabling configuration has two links from chassis to the top of rack switch. However, if you have the recommended redundant connections out of the stack, all of the “extra” redundant connections will be in a “blocking” state, i.e. Link-UP, but not forwarding network traffic. If the system detects a link failure of the active link, the chassis will automatically fail over to the redundant links.
Cabling an Individual Chassis
When cabling an individual chassis, connect one network cable from each management module to the data center top of rack switch. Ensure that both ports on the top of rack switch are enabled and on the same network and VLAN.
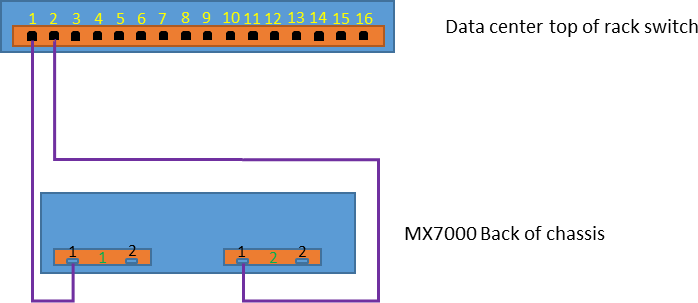
Figure 2 – Schematic representation of single chassis connection
This configuration provides redundant network access to the chassis, protecting against link failure or management module failure. You can cable the redundant connections to the same top of rack switch or to two redundant switches, just be sure to configure both connections the same and have them on the same network and VLAN.
As mentioned above, there is no need to prefer either GB 1 or GB 2 for these connections.
Cabling an Individual Chassis
With the automatic uplink detection and network loop prevention, it is possible to connect multiple chassis one to the other with cables to save port usage in the data center switches and still access each chassis over the network. When multiple chassis are cabled in this manner it is known as a “stack”.
Note: While the automatic uplink detect and network loop prevention allow for chassis to be interconnected without network issues, stacked chassis are not automatically part of a management group.
See the MX7000 Multi Chassis Management feature for group management. This feature (not covered in this blog) lets you manage multiple chassis through one management module, and requires the network stacking arrangement described here.
Recommended Topology for Multiple Chassis
While the auto sensing loop prevention algorithms allow for virtually any topology and provides access to all components in the stack of chassis, there are optimum topologies for connecting a group of chassis. These topologies provide redundant connections into the stack and optimize network down time for firmware updates and possible faults. The cabling diagram shown will protect against any single point of failure in the entire stack. With this configuration you can survive the followingfailures and retain full management network access to all nodes in the stack:
- Any single network cable failure
- Any single management module failure
- Power loss to any single chassis in the stack
It is important to note that these are the minimum failures that we have designed protection for. It is possible to have more failures than the above and still have full functionality, but it would depend heavily on where those failures occurred.
Here is an example topology for a 12 Chassis Dual MM chassis stack, connected to a top of rack switch at ports 1 and 4:
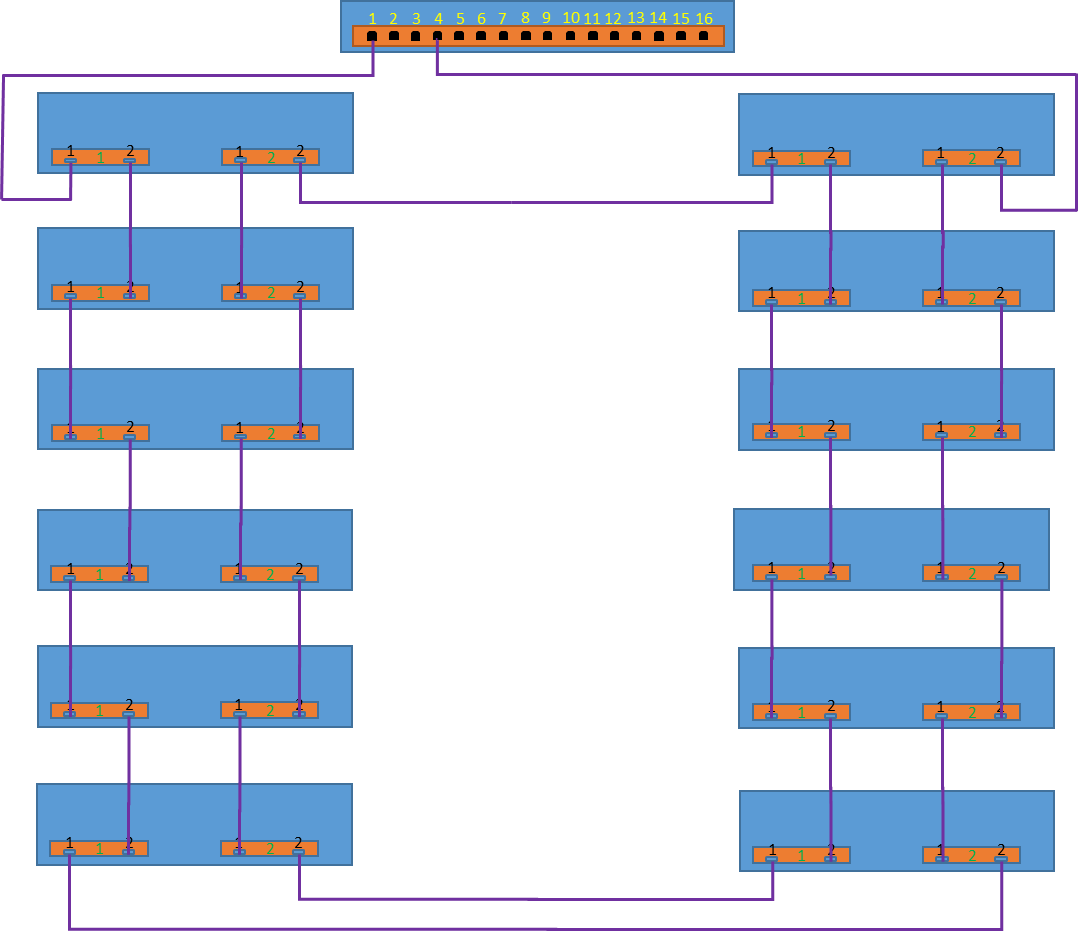 Figure 3 – Schematic representation of multiple chassis connections
For consistent access to all chassis and their components from a management network, it is important that both ports 1 and 4 are connected to the same layer 3 network. A very common misconfiguration that we have seen is accidentally connecting the two redundant uplink ports to different VLANs. If the chassis are connected to different VLANS, when the primary link fails, you will lose access to your management network.
As can be seen, all chassis are connected with their neighbor chassis with redundant connections. The two chassis that are connected to the top of rack switch are connected to each other, providing a redundant connected path. This redundant path is important to allow the stack to survive power loss to a full chassis in the middle of the stack.
While the management module contains a concept of “Active” versus “Passive” roles, networking for the chassis’ is independent of these roles.
The networking algorithm uses Spanning Tree Protocol to determine a network path to each and every component in the Fab-D stack. This may include forwarding paths through “Passive” MM modules. It is important to note that Spanning Tree is *not* enabled on any uplink ports to top of rack switches. Spanning Tree is automatically configured between MX7000 chassis, and is not ever configured on links that are not MX7000 chassis.
One important thing to be aware of are network disruptions caused by cabling or link changes in the stack. When links change, for example if a cable is pulled or added, the network may go down for approximately 30 seconds to re-compute the network topology. This affects all chassis in the stack. One thing you will notice is that every time cabling or link state changes in the stack, all iDRACs and management modules in the stack will reconfigure their network. If the components are configured for DHCP, you will see them refresh their IP addresses.
The above is true for both DHCPv4 and DHCPv6.
Reserved VLANS
To implement the features for auto uplink detection and network loop prevention, the MX7000 chassis internally use VLAN in the series 4000 through 4020. This series is reserved by the management module and chassis components and cannot be used for access through the uplink connection.
All other possible VLANS are available for use and VLAN tagged packets will forward through the stacked chassis.
MX7000 External Port Settings
For all chassis in a stack, it is important that all chassis external port settings are set to the same configuration.
Each management module in the MX7000 chassis has two RJ-45 Ethernet ports labeled “gb1” and “gb2”. Each port is configured to be Auto MDI-X, which typically eliminates the need for an Ethernet crossover cable when connecting any MX7000 port to another chassis or top of rack switch. This is a non-configurable setting.
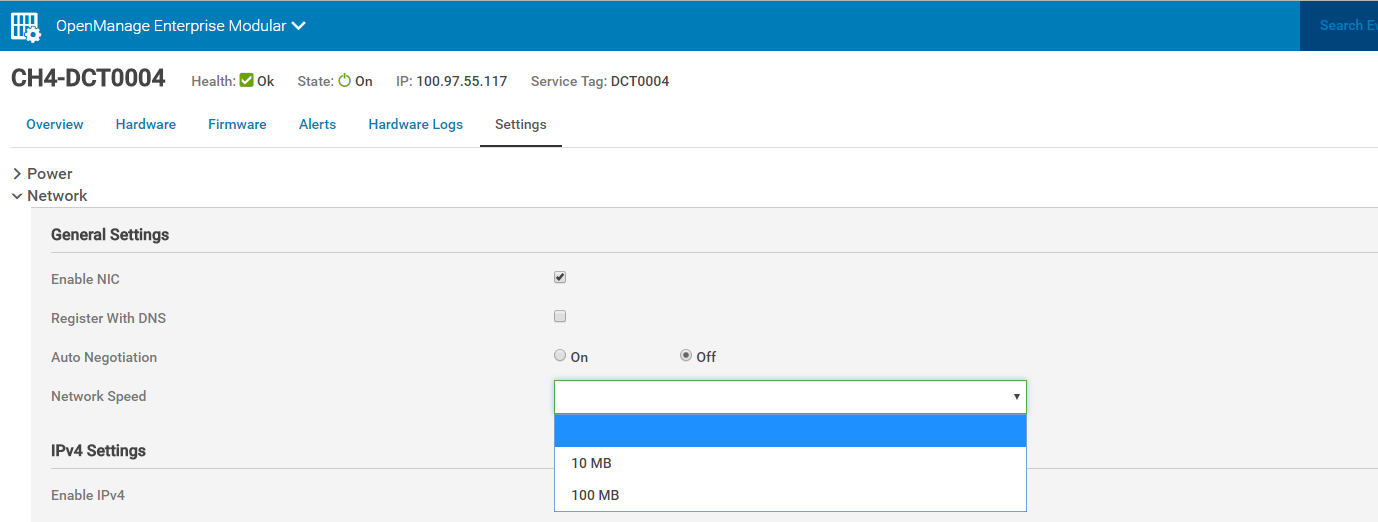
Some port settings, such as speed and auto-negotiation can be configured through the management GUI. All ports on the chassis will configured with the selected values. When actively changing this chassis setting, there will be a delay in access while the settings are applied.
Note: If non-auto negotiate settings are selected, the switch that the chassis is connected with MUST be also changed to the same speed and duplex values.
Additionally, Auto MDI-X may not function properly when auto- negotiate is off, resulting in a link down state.
In a dual management module chassis, all four external gb1 and gb2 ports are set to the same settings.
Related Blog Posts

Direct from Development – PowerEdge MX7000 At the Box Serial Access
Thu, 12 Nov 2020 19:26:21 -0000
|Read Time: 0 minutes
Summary
PowerEdge MX7000 comes with a Management Module that provides chassis management. This technical white paper describes the step by step “at- the-box” serial access feature of the chassis management firmware. A typical use of the serial access feature is for troubleshooting purpose when remote access to the management firmware is not available.
Preparation
What you need?
To prepare for serial access, you need the correct cable for connection. You will need a “micro-USB to USB” cable (Figure-1) long enough to connect your client system to the micro-USB port in the Management Module.
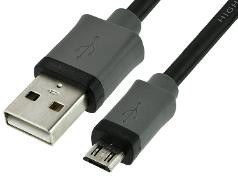
Figure 1 USB to Micro USB Cable
Where to connect?
The micro-USB port (Figure-2) for serial access is in the Management Module located at the rear of the chassis. If you see two Management Modules, look for the module that has the LED under “i” lit.
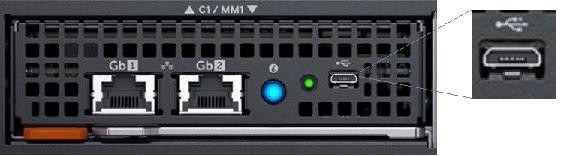
Figure 2 - Micro USB port to connect to
What you need in the client?
You can use any serial terminal client application of your choice, such as Tera Term or PuTTY.
Windows Client Host
If your client host system is running Windows, the default serial device driver should work. Open the Device Manager (type “devmgmt.msc” from command line) to determine which COM port Windows has created for your serial connection.
If Windows is not able to see the serial COM port or it is present but you are not able to connect, you may have to manually install the device driver. You can get this driver from a 3rd party vendor. Search for “cypress semiconductor usb serial driver download”. Look for the driver download link. After the manual driver installation, you should see the COM port for your connection (example in Figure-3).
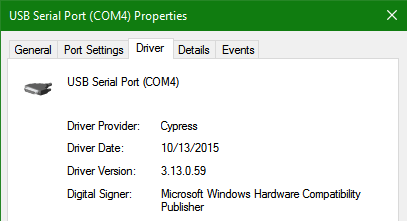
Figure 3 – 3rd party serial device driver in Windows
Linux Client Host
If your client host system is running Linux, the device driver to connect to the serial interface should already be installed. There is an extra step however that is required to correctly recognize the Management Module serial device.
The USB serial device is recognized by Linux as a “Thermometer” device and loads the cytherm kernel module. The following steps help to correctly recognize the Management Module serial device.
First, add this entry “blacklist cytherm” to the file “/etc/modprobe.d/blacklist.conf”. This will prevent loading the incorrect driver.
Next, connect the serial cable to the host system. If you have already connected the serial cable, you will need to unload the incorrect driver with the command “sudo rmmod cytherm”. Then re-connect the serial cable to the host system.
If you see “/dev/ttyACM0” then you are ready to connect. The “0” means it is the first serial device discovered.
Serial Console
Serial Console Menu
When a serial connection is established to the Management Module, the serial client application will be presented with the serial console’s main menu (Figure-4). It is populated with the available components to which serial connection can be made. On the upper right corner of the menu, it shows which Management Module you are connected to (the Active or the Standby). When you are finished, you may simply disconnect the cable and exit the serial client application.
The following sections describe each selection in the Main menu.
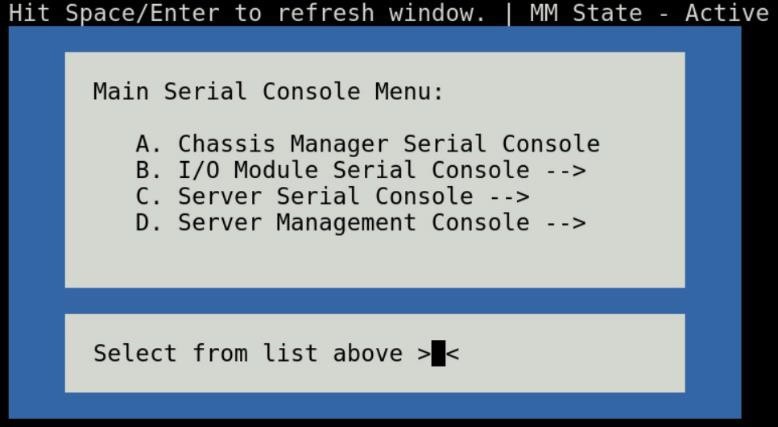
Figure 4 - Main menu
Chassis manager firmware console
Choosing option (A) from the Main menu takes you to the Chassis Manager firmware console. A serial session will open and a login prompt is displayed.
On successful login, you will have access to the Chassis Manager’s firmware racadm interface. To end the session, the exit sequence is “Ctrl-A Ctrl-X”. If using minicom in Linux, the exit sequence is “Ctrl-A Ctrl-A Ctrl-X”. Upon exit, you will see the Main menu.
I/O module firmware console
Choosing option (B) from the Main menu takes you to the I/O Module Console menu (Figure-5). The menu shows you the available I/O modules that support the serial interface.
Prior to selecting an I/O module, you will have the option to toggle the connection mode to either “binary” or non-binary” using option (B) from the menu. In “binary” mode, the terminal control characters from the client application are passed through the serial session.
Upon selection of an I/O module, a serial session will open and a login prompt is displayed. On successful login, you will have access to the I/O module firmware command line.
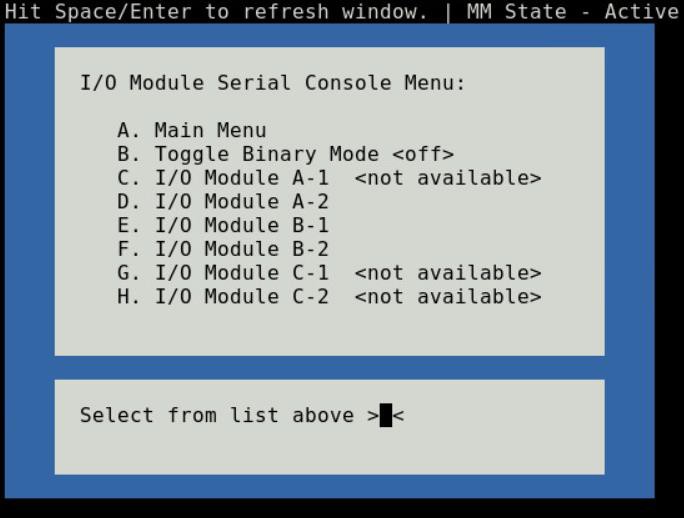
Figure 5 - I/O module console menu
To end a non-binary session, the exit sequence is “Ctrl-\”.
To end a binary session requires an extra step. The extra step is to login to the Chassis Manager’s web interface and go to Home > Troubleshoot > Terminate Serial Connection.
Server serial console
Choosing option (C) from the Main menu takes you to the Sled Host Serial Console menu (Figure-6). The menu shows you the available server host in a sled present in the chassis.
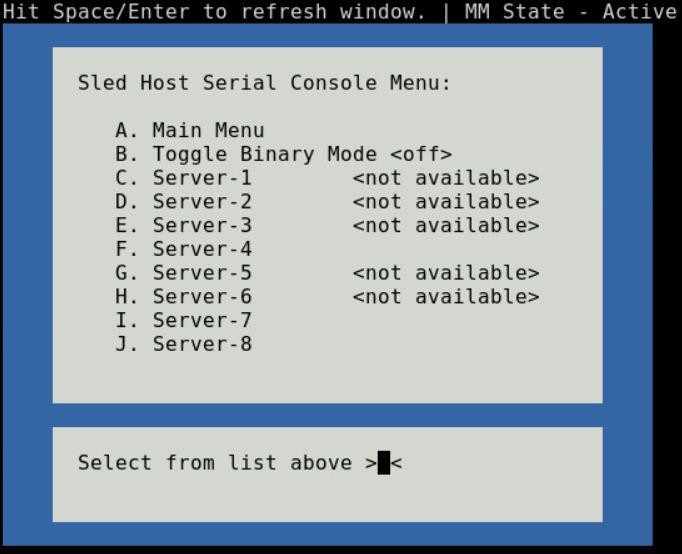
Figure 6 - Sled host serial menu
Prior to selecting a server sled, you will have the option to toggle the connection mode to either “binary” or non-binary” using option (B) from the menu. In “binary” mode, the terminal control characters from the client application are passed through the serial session.
Upon selection of a server sled, you will get access to the serial command line interface of the operating system running on the sled.
To end a non-binary session, the exit sequence is “Ctrl-\”. This exit sequence can be configured from the sled’s iDRAC UI.
To end a binary session requires an extra step. The extra step is to login to the Chassis Manager’s web interface and go to Home > Troubleshoot > Terminate Serial Connection.
Server management firmware console
Choosing option (D) from the Main menu takes you to the iDRAC Serial Console menu (Figure-7). The menu shows you the available iDRAC present in the chassis. iDRAC is the systems management firmware for a compute sled.
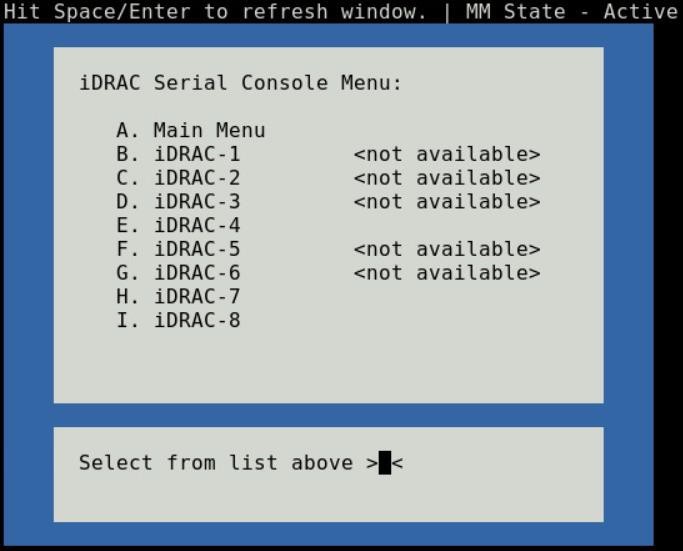
Figure 7- iDRAC console menu

Direct from Development – PowerEdge MX7000 LED Device Status
Thu, 12 Nov 2020 19:10:27 -0000
|Read Time: 0 minutes
Summary
The MX7000 chassis and modular devices in a MX7000 chassis are equipped with multi- purpose LEDs which can indicate the current health state of the device, provide identification or implement device specific features.
This whitepaper intends to provide a single point of comprehensive status information for LED behaviors on PowerEdge MX7000.
Users want to be able to look at the chassis and deduce its current health state when physically in front of the chassis. Most of the components that are present in the MX7000 chassis are able to display their current health state via LEDs.
Users also want to be able to accurately identify components in a chassis. A useful feature to do this is the Identify function that can be activated from the front panel, or remotely via the OpenManage Enterprise Modular GUI. This can be a very useful feature when you are managing a multi- chassis setup and want to remotely identify a particular device in the pool.
Some devices also implement their own specific LED behavior, for example PowerEdge MX5016s implement an LED feature that indicates mapping state. This document will cover these features.
Management Module LED Behavior
The Management Module (MM) is located at the rear of the chassis (Figure 1) and contains two LEDs: Power LED (Green only) and Status LED/Button (Blue or Amber).
Status LED/Button (Blue or Amber) is on the left and the Power LED (Green only) is on the right as shown by red highlights.
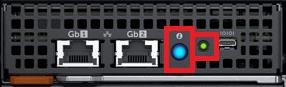
Figure 1: Management Module
The Power and Status LED (color is dependent on status) states are as follows:
Healthy Chassis
MM State | Power LED State | Status LED State |
Active | LED ON (Green) | LED ON (Blue-solid) |
Standby | LED ON (Green) | LED OFF |
Identify (Active) | LED ON (Green) | LED ON (Blue-blinking) |
Faulted Chassis
MM State | Power LED State | Status LED State |
Active | LED ON (Green) | LED ON (Amber-blinking) |
Identify (Active) | LED ON (Green) | LED ON (Blue-blinking) |
(Note: Only active MM will reflect faulted chassis state and provide identification functionality.)
Management Module Hardware Failure
Issue | Power LED State | Status LED State |
MM unable to power on | LED OFF | LED OFF |
MM unable to boot up | LED OFF | LED ON (Amber-solid) |
The Status LED/Button on the rear of the chassis changes to AMBER when any of the Front Panel iconic indicators shows AMBER. When the chassis/MM is in Identify State, the combo Status LED/Button shall always blink BLUE and override any other Status LED state.
IO Module LED Behavior
I/O Modules (IOMs) are inserted in the rear of the chassis and support a two-stacked arrangement of LEDS: Top = AMBER/GREEN, Bottom = BLUE.
Figure 2a – Typical Fab A/B IO Module: Power/Status LED on the top and Identification LED on bottom as shown by red highlights.

Figure 2b – Typical Fab C IO Module: Power/Status LED on the top and Identification LED on bottom as shown by red highlights.
The LEDs support the following functions:
IOM Health | Power/Status LED State | Identification LED State |
Healthy | LED ON (Green) | - |
Faulted | LED ON (Amber) | - |
Identify | - | LED ON (Blue-blinking) |
The green LED behavior can be overridden to indicate fabric mismatch. In case there is a fabric mismatch, green LED will blink for 2.5 seconds and then stay lit.
Sled LED Behavior
The Sleds are inserted in the front of the chassis and contain an LED for Power/Status/Identification via Blue or Amber colors.
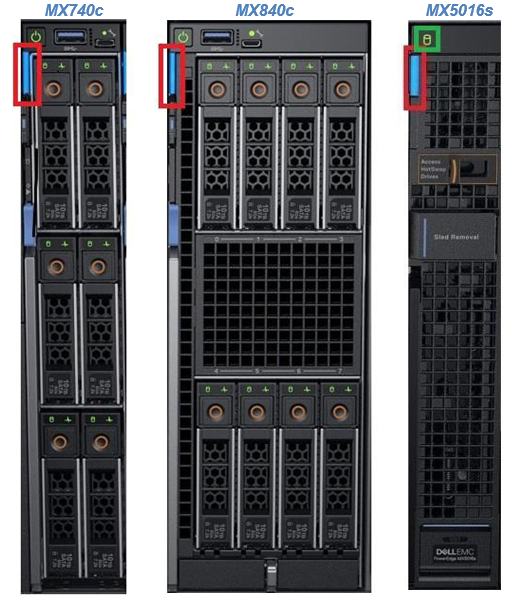
Figure 3: Current PowerEdge MX Sled Options
The Power/Status/Identification LED is on the top left highlighted in red.
The Power/Status/Identification (color is dependent on status) LED states for a sled device will be as follows:
Chassis manager firmware console
Sled Health | Power/Status/Identification LED State |
Off | LED_OFF |
Healthy | LED ON (Blue) |
Errors exist (System on/off) | LED ON (Amber-blinking) |
Identify | LED ON (Blue-blinking) |
Failsafe | LED ON (Amber-solid) |
For PowerEdge MX5016s (Figure 3), a cylindrical LED is also available marked with green highlight in the figure. Its behavior is as follows:
Mapping state | Cylinder LED on PowerEdge MX5016s |
Mapped to Compute that is powered ON | LED ON (Blinking) |
Unmapped | LED OFF |
All mapped compute sleds are off | LED OFF |
NOTE: It is unsafe to remove the PowerEdge MX5016s any time the LED is Blinking, as it is has active mappings to compute sleds that are powered on. To remove the PowerEdge MX5016s, either unmap storage from all compute sleds, or power down all compute sleds that are using this storage. See the User Guide for more information.
PSU LED Behavior
The Power Supply Units (PSUs) are inserted in the front of the chassis and utilize four LEDs: 3 on the front (figure below, left) and 1 in the back (figure below, right).

Figure 4 - Front and Rear PSU LEDs
The PSU LED states are as follows:
PSU State | Health LED (Front) | AC Present (Front) | DC Present (Front) | AC Present (Rear) |
Healthy | LED ON (Green) | LED ON | LED ON | LED ON |
Faulted | LED ON (Amber) | - | - | - |
On the front of the PSU, if the AC Present LED is illuminated, then AC is detected and within tolerance. If the DC Present LED is illuminated, then the PSU is supplying DC to the chassis. The AC Present LED on the rear of the chassis, when illuminated, indicates that AC is detected.
FAN LED Behavior
The Fans are inserted in the front and the back of the chassis (Figure 8) and contain one LED: Power/Status LED (Green or Amber).
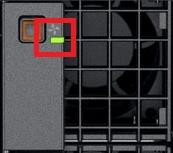
Figure 6 – Front Fans Power/Status LED
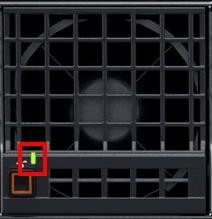
Figure 7 – Rear Fans Power/Status LED
The Power/Status/Identification (color is dependent on status) LED states will be as follows:
Fan Health | Power/Status LED State |
Off | LED_OFF |
Healthy | LED ON (Green) |
Fault | LED ON (Amber-blinking) |
Firmware Update in Progress | LED ON (Green-blinking) |
Conclusion: A thorough understanding of the physical LED status can ensure efficient health status and provide feedback for timely troubleshooting. The PowerEdge MX management module, compute sleds, storage sleds, IO Modules, power supply, and fans, each have LED state indicators that deliver identification on specific features.