


Dell Validated Design for HPC pixstor Storage - PowerVault ME5 Update
Sat, 27 Apr 2024 14:33:12 -0000
|Read Time: 0 minutes
Introduction
Today’s HPC environments have increased demands for high-speed storage. Storage was becoming the bottleneck in many workloads due to higher core-count CPUs, larger and faster memory, a faster PCIe bus, and increasingly faster networks. Parallel File Systems (PFS) typically address these high-demand HPC requirements. PFS provides concurrent access to a single file or a set of files from multiple nodes, efficiently and securely distributing data to multiple LUNs across several storage servers.
These file systems use spinning media to provide the highest capacity at the lowest cost. However, often the speed and latency of spinning media cannot keep up with the demands of many modern HPC workloads. The use of flash technology (that is, NVMe) in the form of burst buffers, faster tiers, or even fast scratch (local or distributed) can mitigate this issue. HPC pixstor Storage offers a cost-effective, high-capacity tier and NVMe nodes as the component to address high-bandwidth demands and for the optional High Demand Metadata module.
This blog is part of a series for PFS solutions for HPC environments, in particular for the flexible, scalable, efficient, and reliable HPC pixstor Storage. Its focus is the upgrade to storage nodes using the new Dell PowerVault ME5084 arrays, which provide a significant boost in performance compared to the previous generation (ME4084 array).
Note: Because arcastream changed its branding to all lowercase characters, we have modified instances of “arcastream,” “pixstor,” and “ngenea” accordingly.
Architecture
The following figure shows the architecture for the new generation of the Dell Validated Design for HPC pixstor Storage. It uses Dell PowerEdge R650, R750, and R7525 servers and the new PowerVault ME5084 storage arrays, with the pixstor 6.0 software from our partner company arcastream.
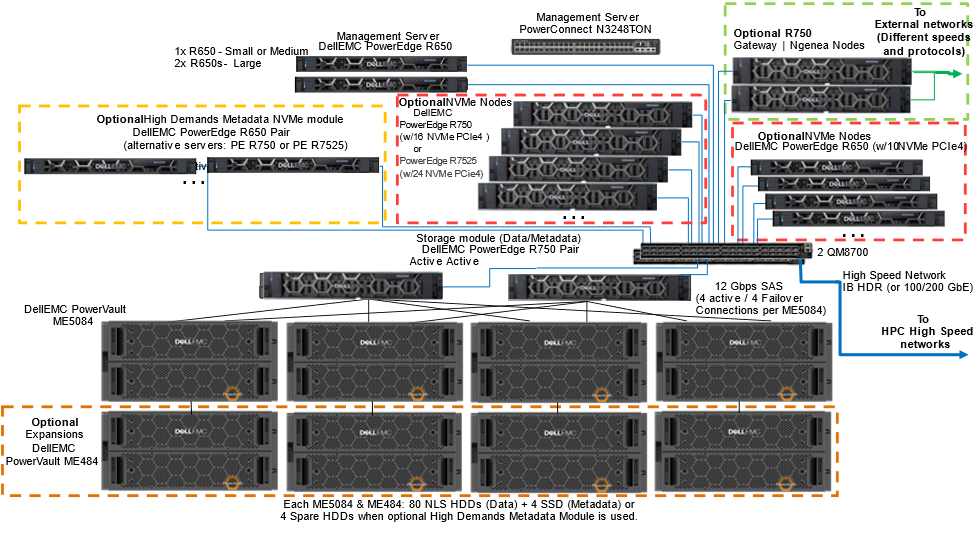
Figure 1 Reference Architecture
Optional PowerVault ME484 EBOD arrays can increase the capacity of the solution as SAS additions to the PowerVault ME5084 storage arrays. The pixstor software includes the widespread General Parallel File System (GPFS), also known as Spectrum Scale, as the PFS component that is considered software-defined storage due to its flexibility and scalability. In addition, the pixstor software includes many other arcastream software components such as advanced analytics, simplified administration and monitoring, efficient file search, advanced gateway capabilities, and many others.
The main components of the pixstor solution are:
- Management servers—PowerEdge R650 servers provide UI and CLI access for management and monitoring of the pixstor solution, as well as performing advanced search capabilities, compiling some metadata information in a database to speed up searches and prevent the search from loading metadata network shared disks (NSDs).
- Storage module—The storage module is the main building block for the pixstor storage solution. Each module includes:
- One pair of storage servers
- One, two, or four backend storage arrays (ME5084) with optional capacity expansions (ME484)
- Network Shared Disks (NSDs) contained in the backend storage arrays
- Storage server (SS)—The storage server is an essential storage module component. HA pairs of PowerEdge R750 servers (failover domains) connect to ME5084s arrays using SAS 12 Gbps cables to manage data NSDs and provide access to NSDs using redundant high-speed network interfaces. For the standard pixstor configuration, these servers have the dual role of being metadata servers and managing metadata NSDs (using SSDs that replace all spare HDDs). The following figure shows the allocation of adapters for the PowerEdge R750 server:
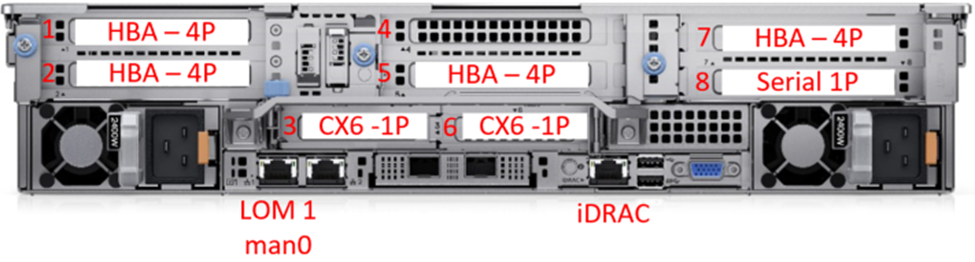
Figure 2 PowerEdge R750 storage nodes - Slot allocation
- Backend Storage—Backend storage is part of the storage module that stores file system data, as shown in Figure 1. The solution uses high-density 5U PowerVault ME5084 disk arrays. The following figure shows the ME5084 array with its two SAS controllers. Two SAS ports from each controller (two from A0-A3 and two from B0-B3) are connected to different HBAs in slots 1, 2, 5 and 7 on each of the storage nodes (four SAS cables per server to each ME5084 array). The ME5084 array requires twice the number of cables previously used by ME4 arrays to match ME5 performance. The SAS connector I/O of each controller (next to the RJ45 management Ethernet port) is used to connect an I/O Module (IOM) in the ME484 expansion array using port I/O 0 (left blue SAS port of each IOM module) of the correspondent I/O Module (Controller A to I/O Module A, Controller B to I/O Module B).
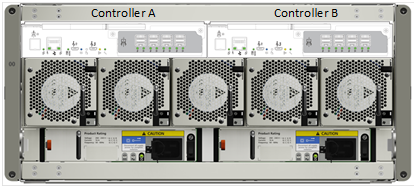
Figure 3 ME5084 array - Controllers and SAS ports
The following figure shows the back of the ME484 expansion array.
- Capacity Expansion Storage—Optional PowerVault ME484 capacity expansions (shown in the following figure and inside the dotted orange square in Figure 1) are connected behind the ME5084 arrays using SAS 12 Gbps cables to expand the capacity of a storage module. For pixstor solutions, each ME5084 array is restricted to use only one ME484 expansion for performance and reliability (despite official ME5084 support for up to three ME484 expansions).
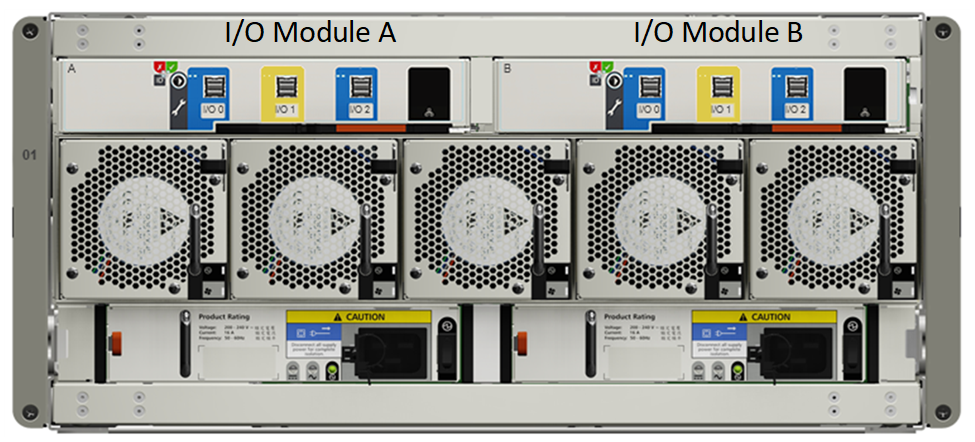
Figure 4 ME484 - I/O Module and SAS ports
- Network Shared Disks (NSDs)—NSDs are backend block devices (that is, RAID 6 LUNs from ME5 arrays or replicated NVMe devices) that store data, metadata, or both. In the pixstor solution, file system data and metadata are stored in different NSDs. Data NSDs use spinning media (NLS SAS3 HDDs) or NVMe. Metadata NSDs use SSDs in the standard configuration or replicated NVMe devices for high metadata demands (metadata include directories, filenames, permissions, timestamps, and the location of data in other NSDs).
- High Demand Metadata Server (HDMD)—The HDMD server is a component of the optional High Demand Metadata module (in the dotted yellow square in Figure 1). Pairs of PowerEdge R650 NVMe servers with up to 10 NVMe devices each in HA (failover domains) manage the metadata NSDs in replicated pairs and provide access using redundant high-speed network interfaces. Other supported servers (PowerEdge R750 and PowerEdge R7525 servers) can be used as NVMe nodes instead of the PowerEdge R650 server.
- NVMe nodes—An NVMe node is the main component of the optional NVMe tier modules (in the dotted red squares in Figure 2). Pairs of the latest PowerEdge servers in HA (failover domains) provide a high-performance flash-based tier for the pixstor solution. The NVMe tier consists of three PowerEdge servers: PowerEdge R650 servers with 10 NVMe direct attached drives, PowerEdge R750 servers with 16 NVMe direct attached devices, or PowerEdge R7525 servers with 24 direct attached drives. To maintain homogeneous performance across the NVMe nodes and allow striping data across nodes in the tier, do not mix different server models in the same NVMe tier. However, multiple NVMe tiers each with different servers and accessed using different filesets is supported.
The selected PowerEdge servers support NVMe PCIe4 and PCIe3 devices. However, mixing NVMe PCIe4 devices with lower performant PCIe3 devices is not recommended for the solution and it is not supported for the same NVMe tier. Additional pairs of NVMe nodes can scale out performance and capacity for this NVMe tier. Increased capacity is provided by selecting the appropriate capacity for the NVMe devices supported on the servers or adding more pairs of servers.
An important difference from previous pixstor releases is that NVMesh is no longer a component of the solution. For HA purposes, an alternative based on GPFS replication of NSDs was implemented across each NVMe server HA pair, to functionally have mirrored NSDs. - Native client software—Native client software is installed on the clients to allow access to the file system. The file system must be mounted for access and appears as a single namespace.
- Gateway nodes—The optional gateway nodes (in the dotted green square in Figure 1) are PowerEdge R750 servers (the same hardware as ngenea nodes but with different software) in a Samba the Clustered Trivial Data Base (CTDB) cluster providing NFS or SMB access to clients that do not have or cannot have the native client software installed.
- ngenea nodes—The optional ngenea nodes (in the dotted green square in Figure 1) are PowerEdge R750 servers (the same hardware as the gateway nodes but using different software) that offer access to external storage systems (for example, object storage, cloud storage, tape libraries, and so on) allowing them to be used as another tier in the same single namespace using enterprise protocols, including cloud protocols.
- Management switch—A PowerConnect N2248X-ON Gigabit Ethernet switch connects the different servers and storage arrays. It is used for administration of the solution interconnecting all the components.
- High-speed network switch—Mellanox QM8700 switches provide high-speed access using InfiniBand (IB) HDR. For Ethernet solutions, the Mellanox SN3700 is used.
Solution components
This solution was released with the latest 3rd Generation Intel Xeon Scalable CPUs, also known as Ice Lake, and the fastest RAM available (3200 MT/s). The following table lists the main components for the solution. Some discrepancies were introduced between the wanted BOM and the actual test hardware because for the prerelease (production level) hardware for our project, only a few CPU models were made available, not including the planned life-cycle model.
The At release column lists the components planned to be used at release and available to customers with the solution. The Test bed column lists the components actually used for characterizing the performance of the solution. The drives listed for data (12 TB NLS) were used for performance characterization, but all supported HDDs and SSDs in the PowerVault ME5 Support Matrix can be used for the solution. Because the ME5 controllers are no longer the first bottleneck of the backend storage, using drives with higher rated speed (10K, 15K, and SSDs) might provide some increase in sequential performance (a maximum of about 30 to 35 percent for throughput is expected), can provide better Random IOPS, and might improve create and remove metadata operations. For full high-speed network redundancy, two high-speed switches must be used (QM87000 for IB or SN3700 for GbE); each switch must have one CX6 adapter connected from each server.
The listed software components describe the versions used during the initial testing. However, these software versions might change over time in between official releases to include important fixes, support for new hardware components, or addition of important features.
The table lists possible data HDDs and SSDs, which are listed in the Dell PowerVault ME5 Support Matrix.
Table 1. Components used at release time and in the test bed
Solution component | At release | Test bed | |
Internal management switch | Dell PowerSwitch N2248X-ON GbE | PowerSwitch S3048-ON | |
Data storage subsystem | 1 x to 4 x PowerVault ME5084 arrays | 2 x Dell PowerVault ME5084 arrays | |
Optional 4x PowerVault ME484 (one per ME5084 array) 80 – 12 TB 3.5" NL SAS3 HDD drives Alternative options: 15K RPM: 900GB; 10K RPM: 1.2TB, 2.4 TB SSD: 960GB, 1.92 TB, 3.84 TB; NLS: 4 TB, 8 TB, 12 TB, 16 TB, 20 TB 8 LUNs, linear 8+2 RAID 6, chunk size 512 KiB 4 - 1.92 TB (or 3.84 TB or 7.68 TB) SAS3 SSDs per ME5084 array for metadata – 2 x RAID 1 (or 4 - Global HDD spares, if optional HDMD is used) | |||
Optional HDMD storage subsystem | One or more pairs of NVMe-tier servers | ||
RAID storage controllers | Duplex 12 Gbps SAS | ||
Capacity without expansion (with 12 TB HDDs) | Raw: 4032 TB (3667 TiB or 3.58 PiB) Formatted: approximately 3072 GB (2794 TiB or 2.73 PiB) | ||
Capacity with expansion (Large) (12 TB HDDs) | Raw: 8064 TB (7334 TiB or 7.16 PiB) Formatted: approximately 6144 GB (5588 TiB or 5.46 PiB) | ||
Processor | Gateway/ngenea | 2 x Intel Xeon Gold 6326 2.9 GHz, 16C/32T, 11.2GT/s, 24M Cache, Turbo, HT (185 W) DDR4-3200 | 2 x Intel Xeon Platinum 8352Y 2.2 GHz, 32C/64T, 11.2GT/s, 48M Cache, Turbo, HT (205 W) DDR4-3200 |
Storage node | |||
Management node | 2x Intel Xeon Gold 6330 2 GHz, 28C/56T, 11.2GT/s, 42M Cache, Turbo, HT (185 W) DDR4-2933 | ||
R650 NVMe Nodes | 2x Intel Xeon Gold 6354 3.00 GHz, 18C/36T, 11.2GT/s, 39M Cache, Turbo, HT (205 W) DDR4-3200 | ||
Optional High Demand Metadata | 2x Intel Xeon Gold 6354 3.00 GHz, 18C/36T, 11.2GT/s, 39M Cache, Turbo, HT (205 W) DDR4-3200 | ||
R750 NVMe nodes |
| 2x Intel Xeon Platinum 8352Y, 2.2 GHz, 32C/64T, 11.2GT/s, 48M Cache, Turbo, HT (205 W) DDR4-3200 | |
R7525 NVMe nodes | 2 x AMD EPYC 7302 3.0 GHz, 16C/32T, 128M L3 (155 W) | 2 x AMD 7H12 2.6 GHz, 64C/64T 256M L3 (280 W) | |
Memory
| Gateway/ngenea | 16 x 16 GiB 3200 MT/s RDIMMs (256 GiB) | |
Storage node | |||
Management node | |||
Operating system | Red Hat Enterprise Linux 8.5 | ||
Kernel version | 4.18.0-348.23.1.el8_5.x86_64 | ||
pixstor software | 6.0.3.1-1 | ||
Spectrum Scale (GPFS) | Spectrum Scale (GPFS) 5.1.3-1 | ||
OFED version | Mellanox OFED 5.6-1.0.3.3 | ||
High-performance NIC | All: 2 x Dell OEM ConnectX-6 Single Port HDR VPI InfiniBand, Low Profile Gateway and ngenea Nodes: 4x CX6 VPI adapters, 2x FS & 2x External | ||
High-performance switch | All: 2 x Dell OEM ConnectX-6 Single Port HDR VPI InfiniBand, Low Profile Gateway and ngenea Nodes: 4x CX6 VPI adapters, 2x FS & 2x External | ||
Local Disks (operating system and analysis/monitoring) | NVMe servers: BOSS-S2 with 2x M.2 240 GB in RAID 1 Other servers: 3x 480 GB SSD SAS3 (RAID 1 + HS) for operating system with PERC H345 front RAID controller | ||
Systems management | iDRAC9 Enterprise + Dell OpenManage 10.0.1-4561 | ||
Performance Characterization
To characterize the new solution component (ME5084 array), we used the following benchmarks:
- IOzone N to N sequential
- IOR N to 1 sequential
- IOzone random
- MDtest
A delay in the delivery of the ME5084 arrays needed for the update of the solution imposed an unexpected limitation. Therefore, the number of ME5 prototypes available for the solution limited this work. Only two ME5084 arrays were used for the benchmark tests, which is the same as a Medium configuration. However, to compare results to the previous generation of the PowerVault array (ME4084), all IOzone and IOR results were extrapolated for a large configuration by multiplying the results by 2. When the additional ME5084 arrays are delivered, all benchmark tests will be repeated on the Large configuration, and then again using ME484 expansions.
For these benchmarks, the test bed included the clients in the following table:
Table 2 Client test bed
Component | Description |
Number of client nodes | 16 |
Client node | C6420 |
Processors per client node | 11 nodes with 2 x Intel Xeon Gold 6230 20 Cores @ 2.1 GHz 5 nodes with 2 x Intel Xeon Gold 6248 20 Cores @ 2.4 GHz |
Memory per client node | 6230 nodes with 12 x 16 GiB 2933 MT/s RDIMMs (192 GiB) 6248 nodes with 12 x 16 GiB 2666 MT/s RDIMMs (192 GiB) |
BIOS | 2.8.2 |
Operating system | CentOS 8.4.2105 |
Operating system kernel | 4.18.0-305.12.1.el8_4.x86_64 |
pixstor software | 6.0.3.1-1 |
Spectrum Scale (GPFS) | 5.1.3-0 |
OFED version | MLNX_OFED_LINUX-5.4-1.0.3.0 |
CX6 FW | 8 nodes with Mellanox CX6 single port: 20.32.1010 8 nodes with Dell OEM CX6 single port: 20.31.2006 |
Because there were only 16 compute nodes available for testing, when a higher number of threads was required, those threads were distributed equally on the compute nodes (that is, 32 threads = 2 threads per node, 64 threads = 4 threads per node, 128 threads = 8 threads per node, 256 threads = 16 threads per node, 512 threads = 32 threads per node, 1024 threads = 64 threads per node). The intention was to simulate a higher number of concurrent clients with the limited number of compute nodes. Because the benchmarks support a high number of threads, a maximum value up to 1024 was used (specified for each test), avoiding excessive context switching and other related side effects.
Sequential IOzone Performance N clients to N files
Sequential N clients to N files performance was measured with IOzone version 3.492. The tests that we ran varied from a single thread up to 1024 threads in increments of powers of 2.
We minimized caching effects by setting the GPFS page pool tunable to 16 GiB on clients and using files larger than twice the memory size of servers and clients (8 TiB). Note that GPFS sets the tunable maximum amount of memory used for caching data, regardless of the amount of RAM that is installed and is free. While in other Dell HPC solutions in which the block size for large sequential transfers is 1 MiB, GPFS was formatted with 8 MiB blocks; therefore that transfer size value is used on the benchmark for optimal performance. The block size on the file system might seem too large and waste too much space, but GPFS uses subblock allocation to prevent that situation. In the current configuration, each block was subdivided into 512 subblocks of 16 KiB each.
The following commands were used to run the benchmark for read and write operations, where the $Threads variable is the number of threads used (1 to 1024 incremented in powers of 2), and threadlist was the file that assign each thread on a different node, using the round-robin method to spread them homogeneously across the 16 compute nodes.
To avoid any possible data caching effects from the clients, the total data size of the files was more than twice the total amount of RAM that the clients and servers have. That is, because each client has 128 GiB of RAM (total 2 TiB) and each server has 256 GiB (total 1 TiB), the total amount is 3 TiB, but 8 TiB of data were used. The 8 TiB were equally divided by the number of threads used.
./iozone -i0 -c -e -w -r 8M -s ${Size}G -t $Threads -+n -+m ./threadlist
./iozone -i1 -c -e -w -r 8M -s ${Size}G -t $Threads -+n -+m ./threadlist
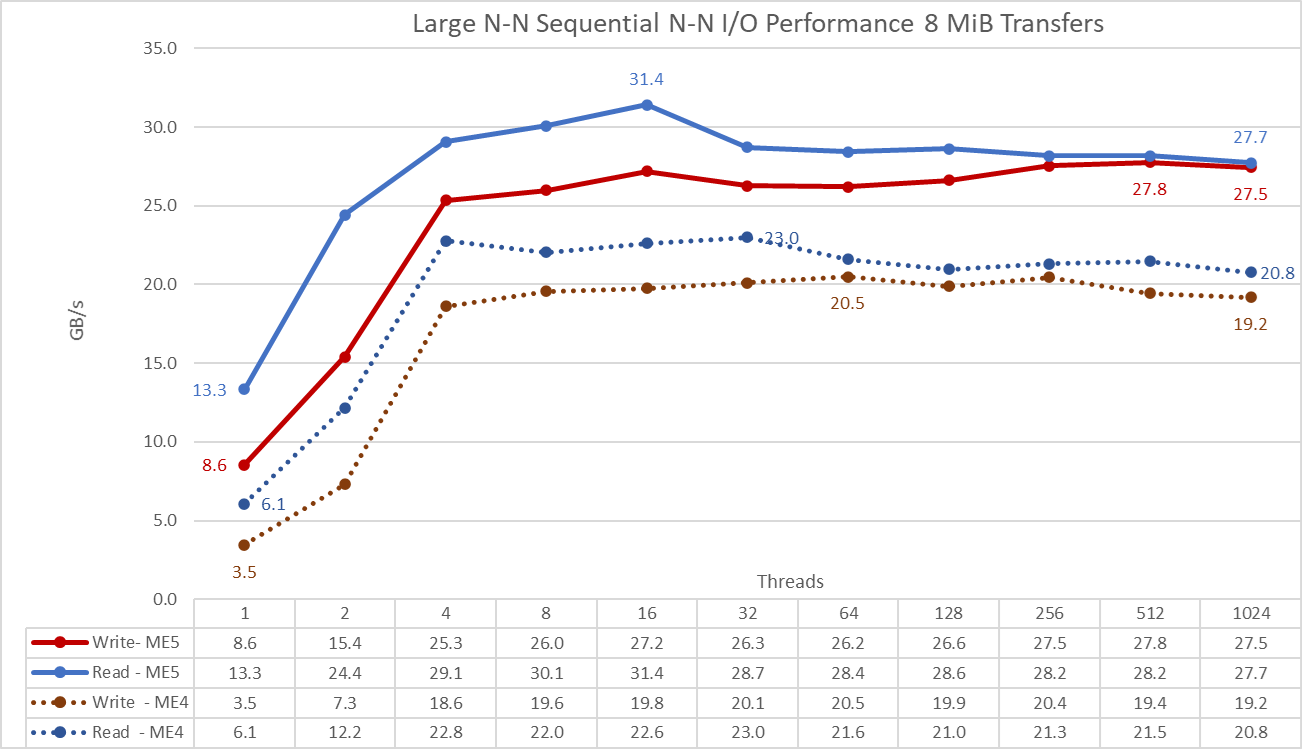
Figure 5 N to N sequential performance
IMPORTANT: To allow comparison of ME5 array values to those previously obtained with ME4 arrays directly on the graph, the IOzone results of the Medium configuration (two ME5084 arrays) were multiplied by 2 to estimate the performance of a Large configuration (four ME5084 arrays).
From the results, we see that write performance rises with the number of threads used and then reaches a plateau at eight threads for read and write operations (the values at four threads are slightly smaller). Read performance rises a little more and then decreases to a more stable value. Write performance seems to be more stable than read performance with a small variation around the sustained performance in the plateau.
The maximum performance for read operations was 31.4 GB/s at 16 threads, about 34.5 percent below the specification of the ME5084 arrays (approximately 48 GB/s), and well below the performance of HDR links (4 x 25 GB/s or 100 GB/s). Even if only one HDR link per storage server was used (ceiling speed of 50 GB/s), the value is higher than the specification of the 4 x ME5084 arrays. Write performance peaks at 512 threads with 27.8 GB/s, but a similar value was observed at 32 threads. The maximum value was about 30.5 percent below the ME5 specifications (40 GB/s). Initial ME5 testing used raw devices with SSDs in RAID (on ME5024 arrays) and HDDs in (8+2) RAID 6 (on ME5084 arrays) and it was able to reach the specifications of the controllers. Therefore, the current assumption is that seek times introduced by GPFS scattered access (random placement of 8 GiB blocks across the surface of all drives) is limiting the performance. Adding ME484 expansions can help reach performance closer to the specifications because having twice the LUNs reduces the effect of the seek time across the file system. Our next whitepaper will include performance for ME484 expansions and benchmark tests will address this assumption.
Sequential IOR Performance N clients to 1 file
Sequential N clients to a single shared file performance was measured with IOR version 3.3.0, with by OpenMPI v4.1.2A1 to run the benchmark over the 16 compute nodes. The tests that we ran varied from one thread up to 512 threads because there were not enough cores for 1024 or more threads. This benchmark used 8 MiB blocks for optimal performance. The previous section provides a more complete explanation about why that block size was selected.
We minimized data caching effects by setting the GPFS page pool tunable to 16 GiB and the total file size to 8192 GiB to ensure neither clients or servers could cache any data. An equal portion of that 8 TiB total was divided by the number of threads (the $Size variable in the following code manages that value).
The following commands were used to run the benchmark for write and read operations, where the $Threads variable is the number of threads used (1 to 512 incremented in powers of two) and my_hosts.$Threads is the corresponding file that allocated each thread on a different node, using the round-robin method to spread them homogeneously across the 16 compute nodes:
mpirun --allow-run-as-root -np $Threads --hostfile my_hosts.$Threads --mca btl_openib_allow_ib 1 --mca pml ucx --oversubscribe --prefix /usr/mpi/gcc/openmpi-4.1.2a1 --map-by node /mmfs1/bench/ior -a POSIX -v -i 1 -d 3 -e -k -o /mmfs1/perftest/tst.file -w -s 1 -t 8m -b ${Size}G
mpirun --allow-run-as-root -np $Threads --hostfile my_hosts.$Threads --mca btl_openib_allow_ib 1 --mca pml ucx --oversubscribe --prefix /usr/mpi/gcc/openmpi-4.1.2a1 --map-by node /mmfs1/bench/ior -a POSIX -v -i 1 -d 3 -e -k -o /mmfs1/perftest/tst.file -r -s 1 -t 8m -b ${Size}G
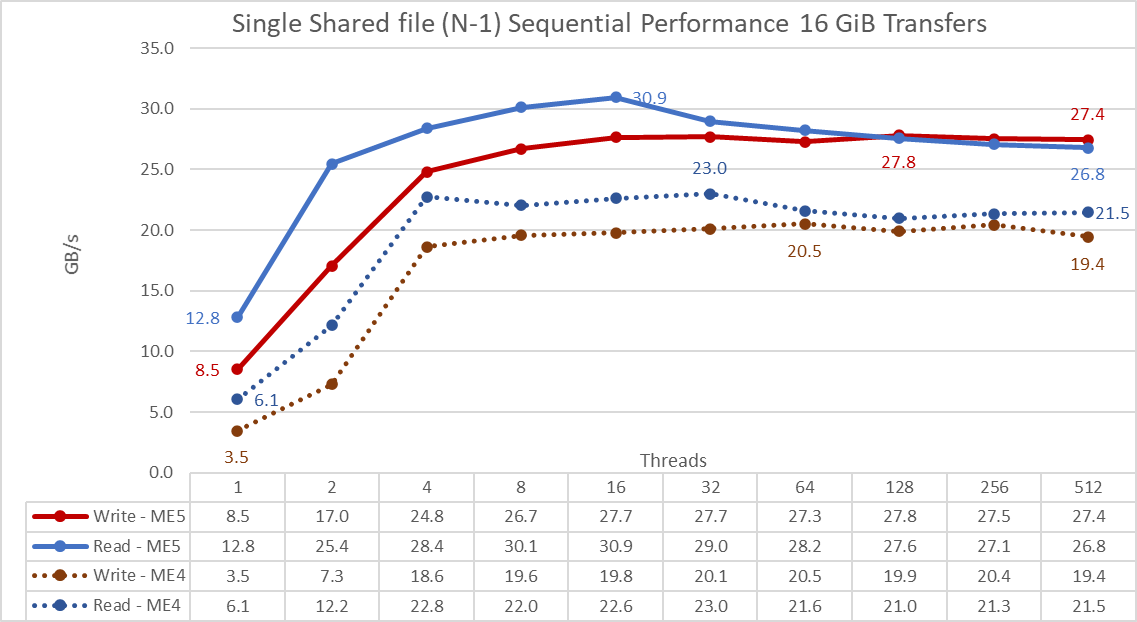
IMPORTANT: To allow comparison of ME5 array values to those previously obtained with ME4 arrays directly on the graph, the IOzone results of the Medium configuration (two ME5084 arrays) were multiplied by 2 to estimate the performance of a Large configuration (four ME5084 arrays).
From the results, we see that read and write performance are high regardless of the implicit need for locking mechanisms because all threads access the same file. Performance rises quickly with the number of threads used and then reaches a plateau at eight threads that is relatively stable up to the maximum number of threads used on this test. Notice that the maximum read performance was 30.9 GB/s at 16 threads, but similar to sequential N to N tests, performance decreases slightly until reaching a more stable value. The maximum write performance of 23 GB/s was achieved at 32 threads and remains stable across a higher number of threads.
Random small blocks IOzone Performance N clients to N files
Random N clients to N files performance was measured with IOzone version 3.492. The tests that we ran varied from a single thread up to 1024 threads in increments of powers of 2.
The tests that we ran varied from a single thread up to 512 threads because there were not enough client cores for 1024 threads. Each thread used a different file and the threads were assigned using the round-robin method on the client nodes. This benchmark test used 4 KiB blocks to emulate small blocks traffic.
We minimized caching effects by setting the GPFS page pool tunable to 4 GiB and to avoid any possible data caching effects from the clients. The total data size of the files created was again 8,192 GiB divided by the number of threads (the $Size variable in the following code was used to manage that value). However, the actual random operations were limited to 128 GiB (4 GiB x 16 clients x 2) to save running time that can be extremely long due to low IOPS on NLS drives.
. ./iozone -i0 -I -c -e -w -r 8M -s ${Size}G -t $Threads -+n -+m ./me5_threadlist <= Create the files sequentially
./iozone -i2 -I -O -w -r 4k -s ${Size}G -t $Threads -+n -+m ./me5_threadlist <= Perform the random reads and writes
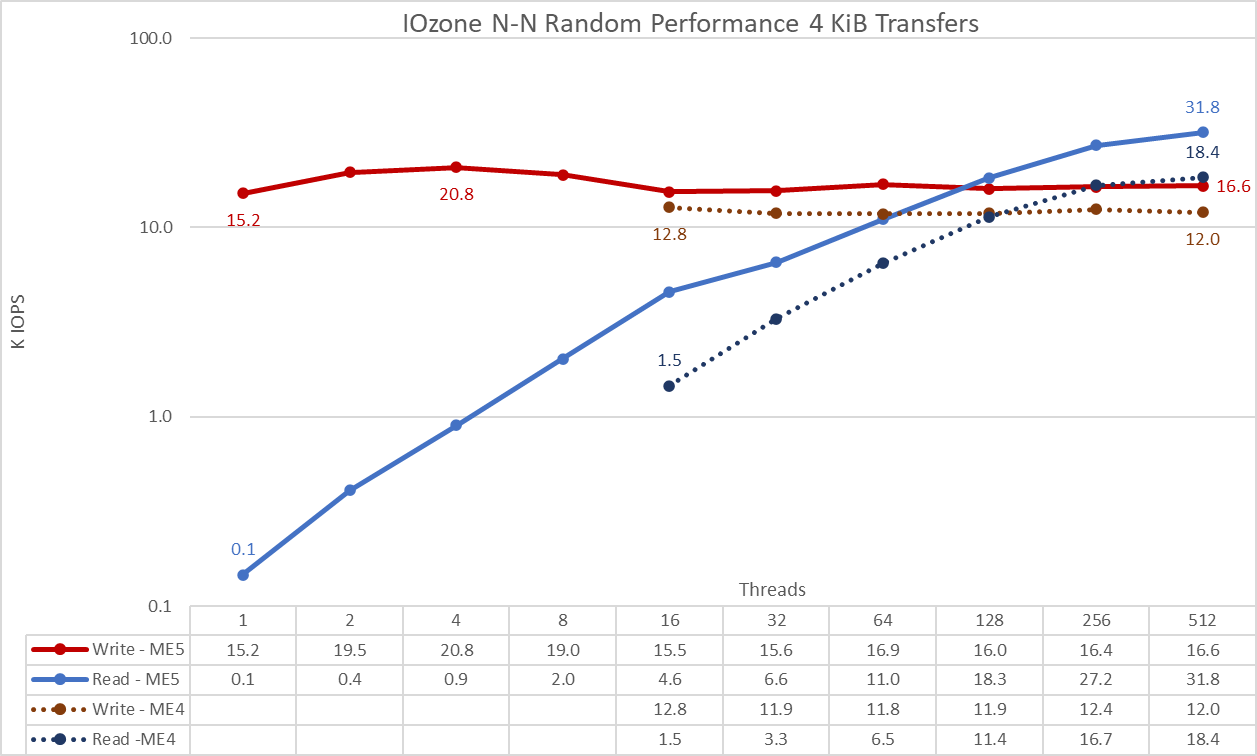
Figure 7 N to N random performance
IMPORTANT: To allow comparison of ME5 array values to those previously obtained with ME4 arrays directly on the graph, the IOzone results of the Medium configuration (two ME5084 arrays) were multiplied by 2 to estimate the performance of a Large configuration (four ME5084 arrays).
From the results, we see that write performance starts at a high value of 15.2K IOPS and rises to the peak of 20.8K IOPS at four threads and then decreases until it reaches a plateau at 16 threads (15-17K IOPS). Read performance starts low at 1.5K IOPS at 16 threads and increases steadily with the number of threads used (the number of threads is doubled for each data point) until achieving a maximum performance of 31.8K IOPS at 512 threads without reaching a plateau. Using more threads requires more than 16 compute nodes to avoid resource starvation and excessive swapping that can lower apparent performance. Because NLS HDDs seek time limits maximum IOPS long before reaching the controller ME5 specification, using ME484 expansions can help to increase IOPS; and faster drives (10K, 15K, or SSDs) can help even more. However, the NVMe tier is better suited to handle extremely high IOPS requirements.
Metadata performance with MDtest
The optional HDMD used in this testbed was with a single pair of PowerEdge R650 servers with 10 PM1735 NVMe PCIe 4 devices on each server. Metadata performance was measured with MDtest version 3.3.0, with OpenMPI v4.1.2A1 to run the benchmark over the 16 compute nodes. The tests that we ran varied from a single thread up to 512 threads. The benchmark was used for files only (no directories metadata), getting the number of create, stat, read, and remove operations that the solution can handle.
Because the same High Demand Metadata NVMe module was used for previous benchmark tests of the pixstor storage solution, metadata results are similar to previous results (NVMe tier). Therefore, the study with empty and 3 KiB files were included for completeness, but results with 4 KiB files are more relevant for this blog. Since 4 KiB files cannot fit into an inode along with the metadata information, ME5 arrays are used to store data for each file. Therefore, MDtest can also provide an approximate estimate of small files performance for read operations and the rest of the metadata operations using ME5 arrays.
The following command was used to run the benchmark, where the $Threads variable is the number of threads used (1 to 512 incremented in powers of two) and my_hosts.$Threads is the corresponding file that allocated each thread on a different node, using the round-robin method to spread them homogeneously across the 16 compute nodes. The file size for read and create operations was stored in $FileSize. Like the Random IO benchmark, the maximum number of threads was limited to 512 because there are not enough cores on client nodes for 1024 threads. Context switching can affect the results, reporting a number lower than the real performance of the solution.
mpirun --allow-run-as-root -np $Threads --hostfile my_hosts.$Threads --prefix /usr/mpi/gcc/openmpi-4.1.2a1 --map-by node --mca btl_openib_allow_ib 1 /mmfs1/bench/mdtest -v -P -d /mmfs1/perftest -i 1 -b $Directories -z 1 -L -I 1024 -u -t -w $FileSize -e $FileSize
Because the total number of IOPS, the number of files per directory, and the number of threads can affect the performance results, we decided to keep the total number of files fixed to 2 MiB files (2^21 = 2097152), the number of files per directory fixed at 1024, and the number of directories varied as the number of threads changed, as shown in the following table:
Table 3 MDtest distribution of files on directories
Number of threads | Number of directories per thread | Total number of files |
1 | 2048 | 2,097,152 |
2 | 1024 | 2,097,152 |
4 | 512 | 2,097,152 |
8 | 256 | 2,097,152 |
16 | 128 | 2,097,152 |
32 | 64 | 2,097,152 |
64 | 32 | 2,097,152 |
128 | 16 | 2,097,152 |
256 | 8 | 2,097,152 |
512 | 4 | 2,097,152 |
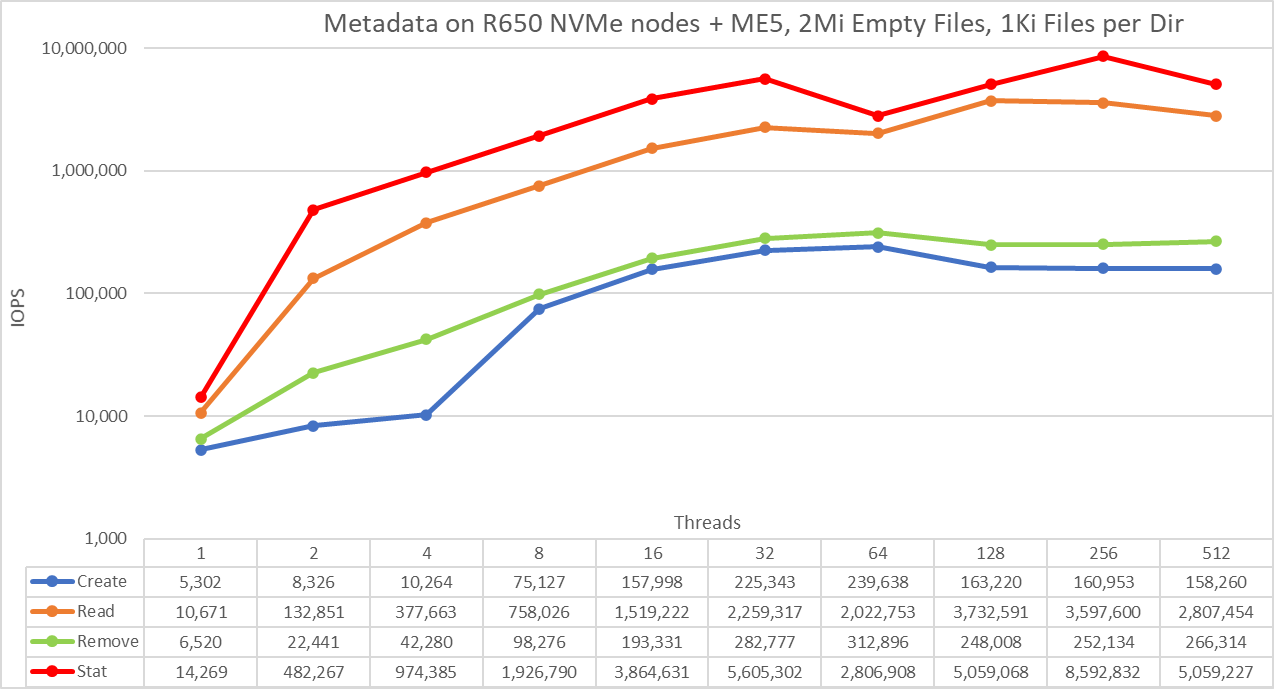
Figure 8 Metadata Performance – empty Files
The scale chosen was logarithmic with base 10 to allow comparing operations that have differences of several orders of magnitude; otherwise, some of the operations would appear like a flat line close to 0 on a linear scale. A log graph with base 2 is more appropriate because the number of threads are increased by powers of 2. Such a graph would look similar, but people tend to perceive and remember numbers based on powers of 10 better.
Empty files do not involve all ME5 arrays and only represent the performance on the PowerEdge R650 servers with NVMe drives. The system provides good results with stat operations reaching the peak value at 256 threads with almost 8.6M op/s and then is reduced for 512 threads. Create operations reach the maximum of 239.6K op/s at 64 threads and then decrease slightly until reaching a plateau at 128 threads. Read operations attain a maximum of 3.7M op/s at 128 threads, then decrease slowly. Remove operations peak at 312.9K op/s at 64 threads, then decrease slightly and seem to reach a plateau.
Metadata Performance with 3 KiB files
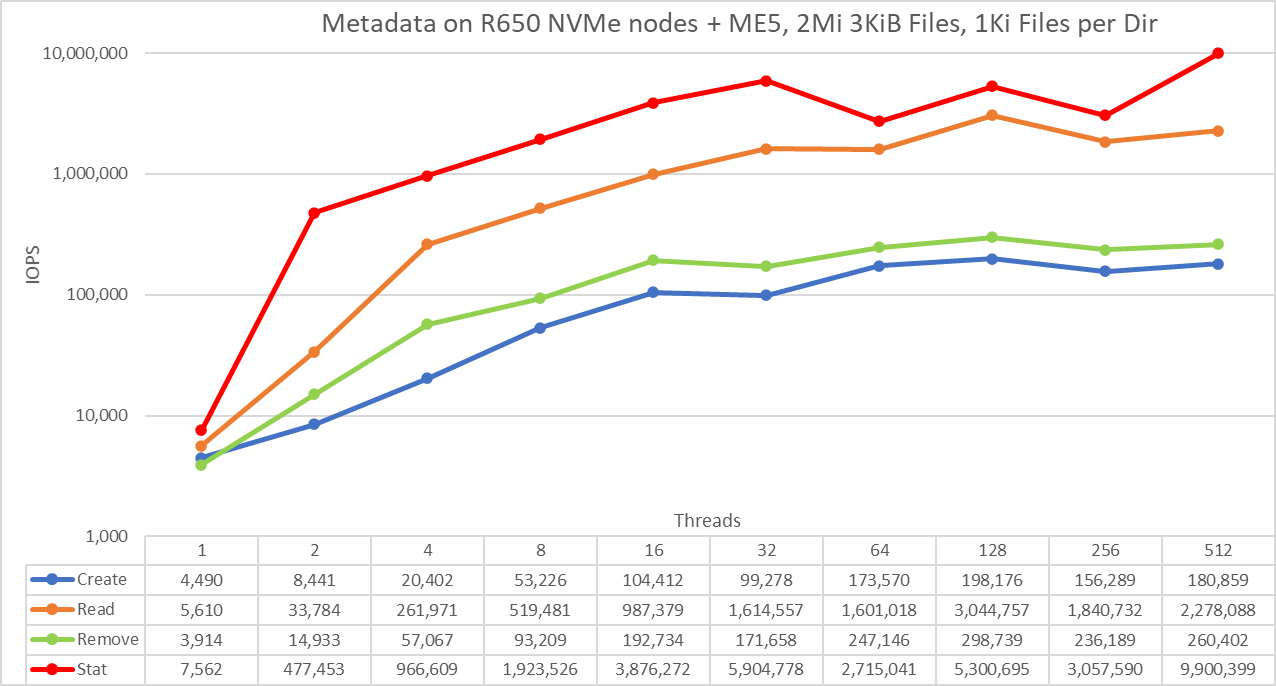
Figure 9 Metadata Performance – 3 KiB Files
The scale chosen was logarithmic with base 10 to allow comparing operations that have differences of several orders of magnitude; otherwise, some of the operations would appear like a flat line close to 0 on a linear scale. A log graph with base 2 is more appropriate because the number of threads are increased by powers of 2. Such a graph would look similar, but people tend to perceive and remember numbers based on powers of 10 better.
Note that 3 KiB files still fit completely on inodes and therefore do not involve ME5 arrays, but only represent the performance on the PowerEdge R650 servers with NVMe drives. The system provides good results with stat operations reaching the peak value at 512 threads with 9.9M op/s. Create operations reach the maximum of 192.2K op/s at 128 threads and seem to reach a plateau. Read operations attained a maximum of 3M op/s at 128 threads. Remove operations peaked at 298.7K op/s at 128 threads.
Metadata Performance with 4 KiB files
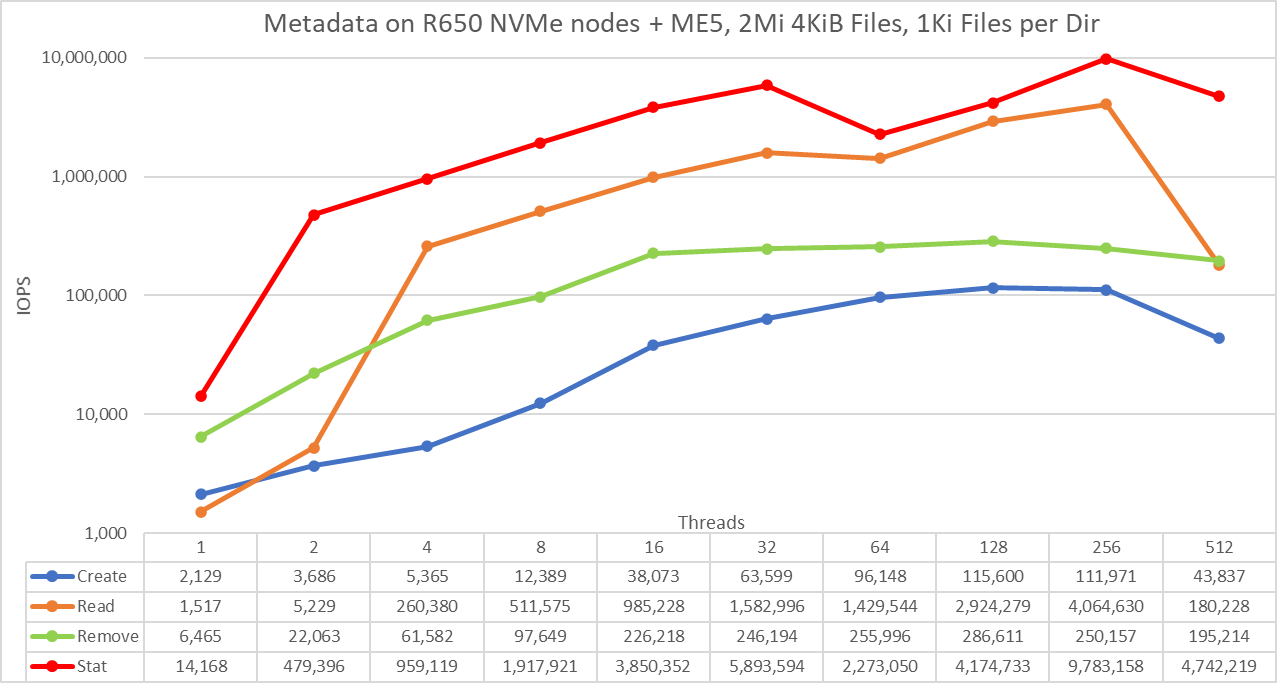
The scale chosen was logarithmic with base 10 to allow comparing operations that have differences of several orders of magnitude; otherwise, some of the operations would appear like a flat line close to 0 on a linear scale. A log graph with base 2 is more appropriate because the number of threads are increased by powers of 2. Such a graph would look similar, but people tend to perceive and remember numbers based on powers of 10 better.
The system provides good results with stat operations reaching the peak value at 256 threads with almost 9.8M op/s and then is reduced for 512 threads. Create operations reach the maximum of 115.6K op/s at 128 threads and then decrease slightly until reaching 512 threads where the value drops to less than 40 percent of the peak. Read operations attain a maximum of 4M IOPS at 256 threads, which seems too high for NLS drives (possibly implying the file system is caching all data needed for most data points), suddenly dropping also at 512 threads. More work is needed to understand the sudden drop for create operations and the high read performance. Finally, remove operations peak at 286.6K op/s at 128 threads and decrease at higher thread counts.
Conclusions and future work
The new ME5 arrays provide a significant increase in performance (71 percent for read operations and 82 percent for write operations from specifications). The new arrays directly increased the performance for the pixstor solution, but not to the level expected from the specification, as seen in Table 4. Because the pixstor solution uses scattered access by default, it is expected that ME484 expansions will help get closer to the limit of the ME5 controllers.
This solution provides HPC customers with a reliable parallel file system (Spectrum Scale – also known as GPFS) that is used by many Top500 HPC clusters. In addition, it provides exceptional search capabilities without degrading performance, and advanced monitoring and management. By using standard protocols like NFS, SMB, and others, optional gateways allow file sharing to as many clients as needed. Optional ngenea nodes allow tiering of other Dell storage such as Dell PowerScale, Dell ECS, other vendors, and even cloud storage.
Table 4 Peak and sustained performance with ME5084 arrays
Benchmark | Peak performance | Sustained performance | ||
Write | Read | Write | Read | |
Large Sequential N clients to N files | 31.4 GB/s | 27.8 GB/s | 28 GB/s | 26 GB/s |
Large Sequential N clients to single shared file | 30.9 GB/s | 27.8 GB/s | 27.3 GB/s | 27 GB/s |
Random Small blocks N clients to N files | 31.8K IOPS | 20.8K IOPS | 15.5K IOPS | 27K IOPS |
Metadata Create 4 KiB files | 115.6K IOPS | 50K IOPS | ||
Metadata Stat 4 KiB files | 9.8M IOPS | 1.4M IOPS | ||
Metadata Remove 4 KiB files | 286.7K IOPS | 195K IOPS | ||
When two additional ME5084s are added to the pixstor solution, it will be fully benchmarked as a Large configuration (four ME5084 arrays). It will also be fully benchmarked after adding expansion arrays (four ME484 arrays). Another document will be released with this and any additional information.
Related Blog Posts

Dell Reinforces its TPCx-AI Benchmark Leadership using the 16G PowerEdge R6625 Hardware Platform at SF1000
Wed, 12 Jul 2023 18:52:17 -0000
|Read Time: 0 minutes
Overview
On 06-13-2023, Dell Technologies published a TPCx-AI SF1000 result that was based on an 11 x Dell PowerEdge R6625 hardware platform powered by AMD Genoa processors. As of the publication date, Dell results held number one slots on the Top Performance and Price/Performance tables for TPCx-AI on SF3, SF100, SF300, and SF1000. These results reinforce Dell Technologies’ TPCx-AI benchmark leadership position; a statement to the great performance provided by its AI, ML, and DL solutions.
This blog presents the hardware platform that was tested, what was measured and what the results mean.
What TPCx-AI tests measure
TPCx-AI measures the end-to-end machine learning or data science platform using a diverse representative dataset scaling from 1 GB to 10 TB. The TPCx-AI benchmark assesses various aspects of AI training and inference performance, including data generation, model training, serving, scoring, and system scalability. The benchmark can be used across a wide range of different systems from edge to data center. It aims to provide a standardized and objective measure of AI performance across different platforms and configurations.
By using TPCx-AI, organizations and vendors can make informed decisions about the AI infrastructure that best suits their needs. The benchmark helps in understanding the system's capability to handle large-scale AI training workloads and can help optimize performance and resource allocation for AI tasks.
The TPCx-AI standard defines 10 use cases based on data science pipelines modeled on a retail business data center to evaluate the performance of artificial intelligence systems. The workload trains deep neural networks on large datasets using prominent machine learning frameworks such as TensorFlow. The benchmark measures:
- The total time taken to train a model for each use case to a specific level of accuracy
- The time taken for that model to be used for inference or serving
The blog, Interpreting the results of the TPCx-AI Benchmark, outlines the ten use cases, their data science models, and the benchmark phases.
System under test (SUT)
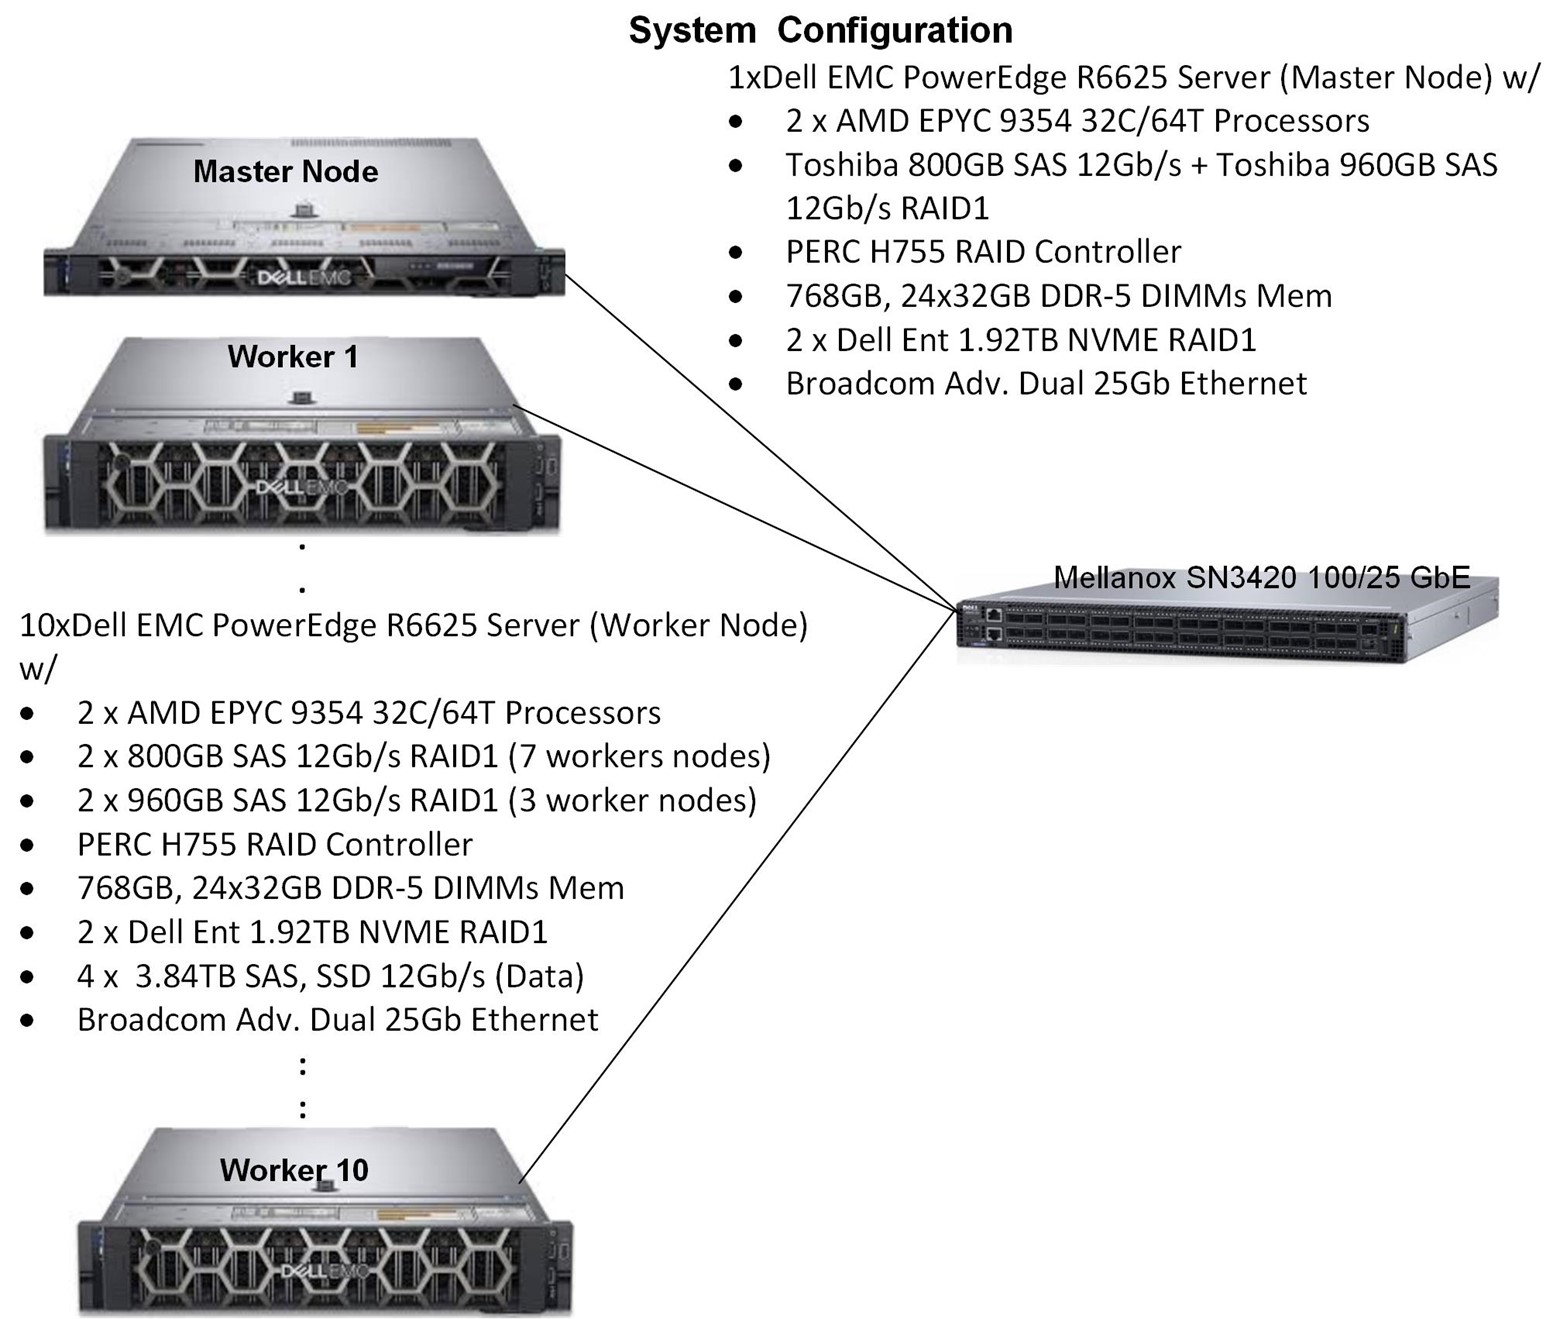
Figure 1 System Under Test (SUT).
Software versions
Table 1 Software versions
Software | Version |
Cloudera Data Platform (CDP) | 7.1.7 SP2 |
Hadoop | 3.1.1 |
HDFS | 3.1.1 |
YARN | 3.1.1 |
MR2 | 3.1.1 |
Spark | 2.4.7 |
ZooKeeper | 3.5.5 |
Java | 1.8.0 |
Python | 3.7.16 |
Red Hat Enterprise Linux | 8.7 (Master node) |
TPCx-AI Kit | 1.0.2 |
The result
Primary metrics
Table 2 Primary metric scores
Primary Metric | Score |
Performance (AIUCpm@1000) | 3,258.01 |
Price/Performance (USD/AIUCpm@100) | 267.96 |
Availability | June 13, 2023 |
The three primary metrics in Table 2 are required for all TPC results. The top ten results, based on performance or price/performance at a particular SF category, are displayed in the tables of the respective benchmark standard categorized by the metric and SF. To compare any results, all three metrics must be disclosed in the body of the message. The TPC does not allow comparing TPCx-AI results from different SF categories. The blog, Interpreting the results of the TPCx-AI Benchmark, goes into the details of how the performance and price/performance metrics are calculated. The availability date is the date all the priced line items (SKUs) are available to customers and must be within 185 days of the submission date. For the performance metric, the higher the score the better. For price/performance, the lower the better.
Other metrics
Table 3 Other metrics
Metric | Score |
Total system cost | $872,988 |
Framework | Cloudera SEL Data Platform Private Cloud Base Edition |
Operating system | Red Hat Enterprise Linux 8.6/8.7 |
Scale factor | 1,000 |
Physical storage divided by scale factor | 214.56 |
Scale factor divided by physical memory | 0.12 |
Main data redundancy mode | Replication 3, RAID 1 |
Number of servers | 11 |
Total processors, cores, and threads | 22/704/1,344 |
Number of streams | 4 |
The metrics in Table 3 are required to be reported and disclosed in the Full Disclosure Report (FDR) and Executive Summary (ES). Except for the total system cost, these other metrics are not used in the calculation of the primary metrics but provide additional information about the system that was tested. For instance, the total system cost is the total cost of ownership (TCO) for one year. The redundancy modes provide the data protection mechanisms that were used in the configuration as required by the benchmark standard. The number of streams refers to the number of concurrent serving tests during the Throughput phase.
Numerical quantities
Benchmark run times
Table 4 Benchmark run times
Benchmark run | Time |
Benchmark start | 06-07-2023 9:35:25 PM |
Benchmark end | 06-08-2023 3:20:10 AM |
Benchmark duration | 5:44:45.193 |
Benchmark phase times
Table 5 Benchmark phase metrics
Benchmark phase | Metric_name | Metric value |
Data Generation | DATAGEN | 2419.613 |
Data Loading | TLOAD | 927.45 |
Load Test | TLD | 927.45 |
Power Training | TPTT | 492.143 |
Power Serving 1 | TPST1 | 56.998 |
Power Serving 2 | TPST2 | 57.357 |
Power Serving | TPST | 57.357 |
Throughput | TTT | 43.934 |
AIUCpm@1000.0 | 3258.066 |
The seven benchmark phases and their metrics are explained in Interpreting the results of the TPCx-AI Benchmark, and are performed sequentially from data generation to throughput tests. In power training, models are generated and trained for each use case sequentially from UC1 to UC10. In power serving, the models obtained during the training phase are used to conduct the serving phase sequentially, one use case at a time. There are two power serving tests. The test that registers the longer time provides the TPST metric. The throughput phase runs multiple streams of serving tests concurrently. The more the number of streams, the more the system resources are taxed. Typically, the number of streams are increased until TTTn+1 > TTTn (where n+1 refers to the next throughput test). The duration of the longest running stream (TTPUT) is used to calculate the throughput test metric TTT.
Use case times and accuracy
Table 6 Use case times and accuracy
Use case | TRAINING | SERVING_1 | SERVING_2 | Throughput | Accuracy | Threshold |
1 | 523.703 | 51.215 | 49.736 | 56.083 | -1.00000 | -1.0 >= -1 |
2 | 1813.764 | 85.354 | 88.783 | 129.274 | 0.43830 | word_error rate <= 0.5 |
3 | 95.795 | 12.443 | 12.811 | 13.84 | 4.57451 | mean_squared_log_error <= 5.4 |
4 | 59.08 | 25.475 | 25.489 | 31.016 | 0.71189 | f1_score >= 0.65 |
5 | 943.023 | 76.289 | 78.351 | 91.615 | 0.03347 | mean_squared_log_error <= 5.4 <= 0.5 |
6 | 435.865 | 33.135 | 33.071 | 37.12 | 0.21355 | matthews_corrcoef >= 0.19 |
7 | 43.585 | 15.317 | 15.3 | 17.143 | 1.65306 | median_absolute_error <= 1.8 |
8 | 1940.283 | 338.579 | 341.811 | 372.418 | 0.74996 | accuracy_score >= 0.65 |
9 | 5448.735 | 703.291 | 699.631 | 745.458 | 1.00000 | accuracy_score >= 0.9 |
10 | 818.635 | 28.326 | 28.19 | 31.162 | 0.81691 | accuracy_score >= 0.7 |
Table 6 shows the use case run times (in seconds) for each benchmark phase and the accuracy of the model that was used. For instance, the RNN model that was generated and trained for UC2 had a word_error rate of 0.4383 which was less (better) than the threshold error_rate of 0.5. The XGBoost model trained for UC8 was 74.99% accurate which was above and better than the 65% minimum accuracy threshold requirement.
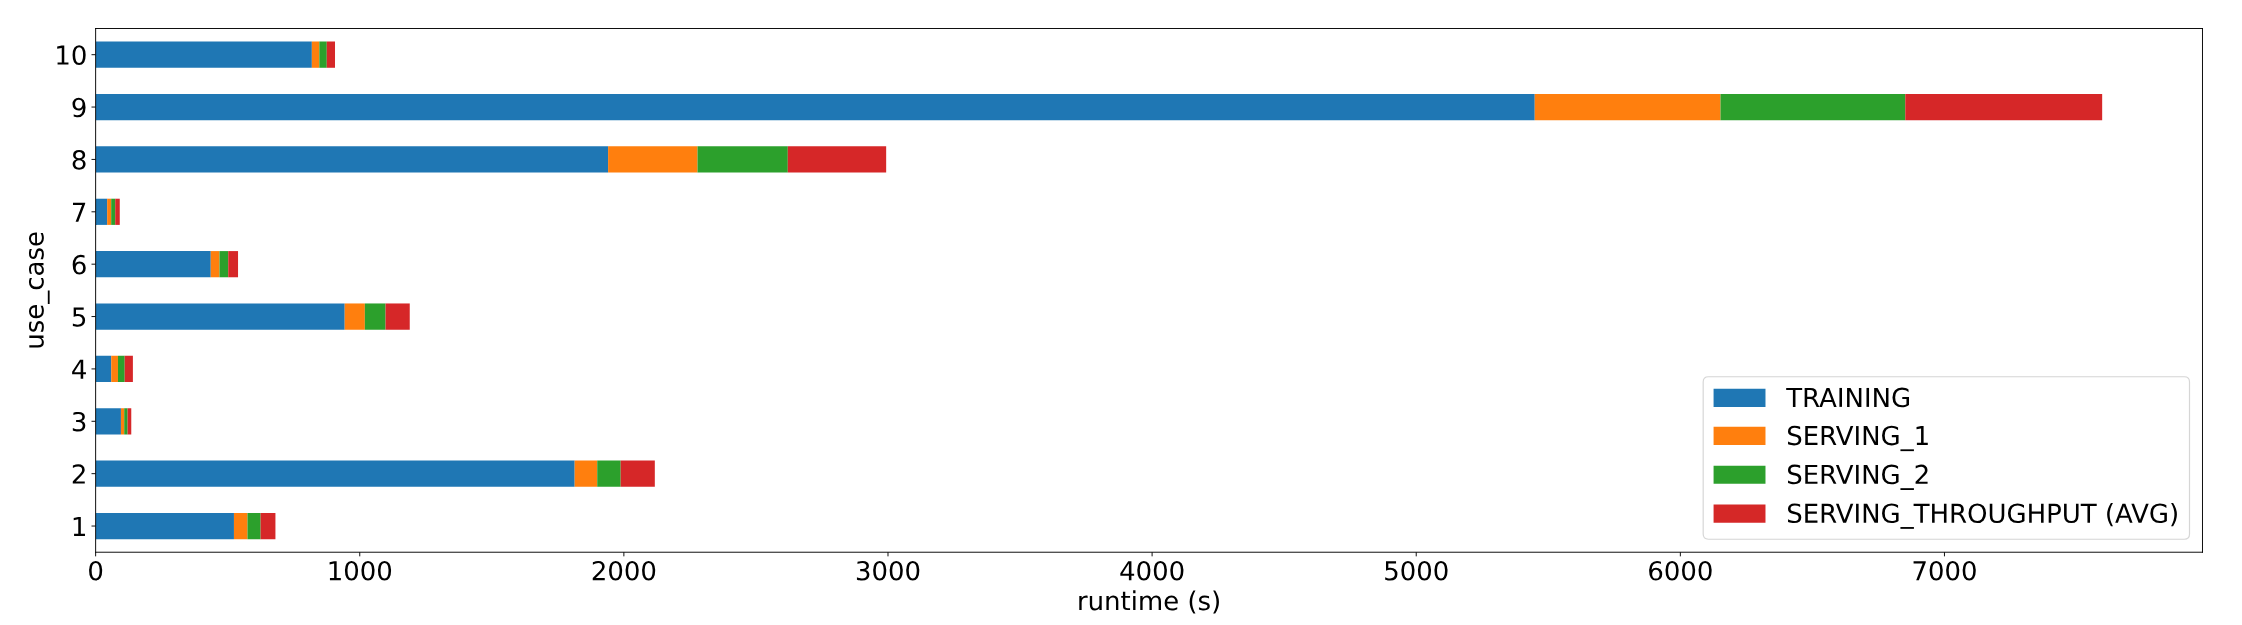
Figure 2 Use case time by benchmark phase
TPCx-AI SF1000 results tables
Table 7 displays the top TPCx-AI SF1000 tables as of the publication of this blog.
Table 7 SF1000 top performance table
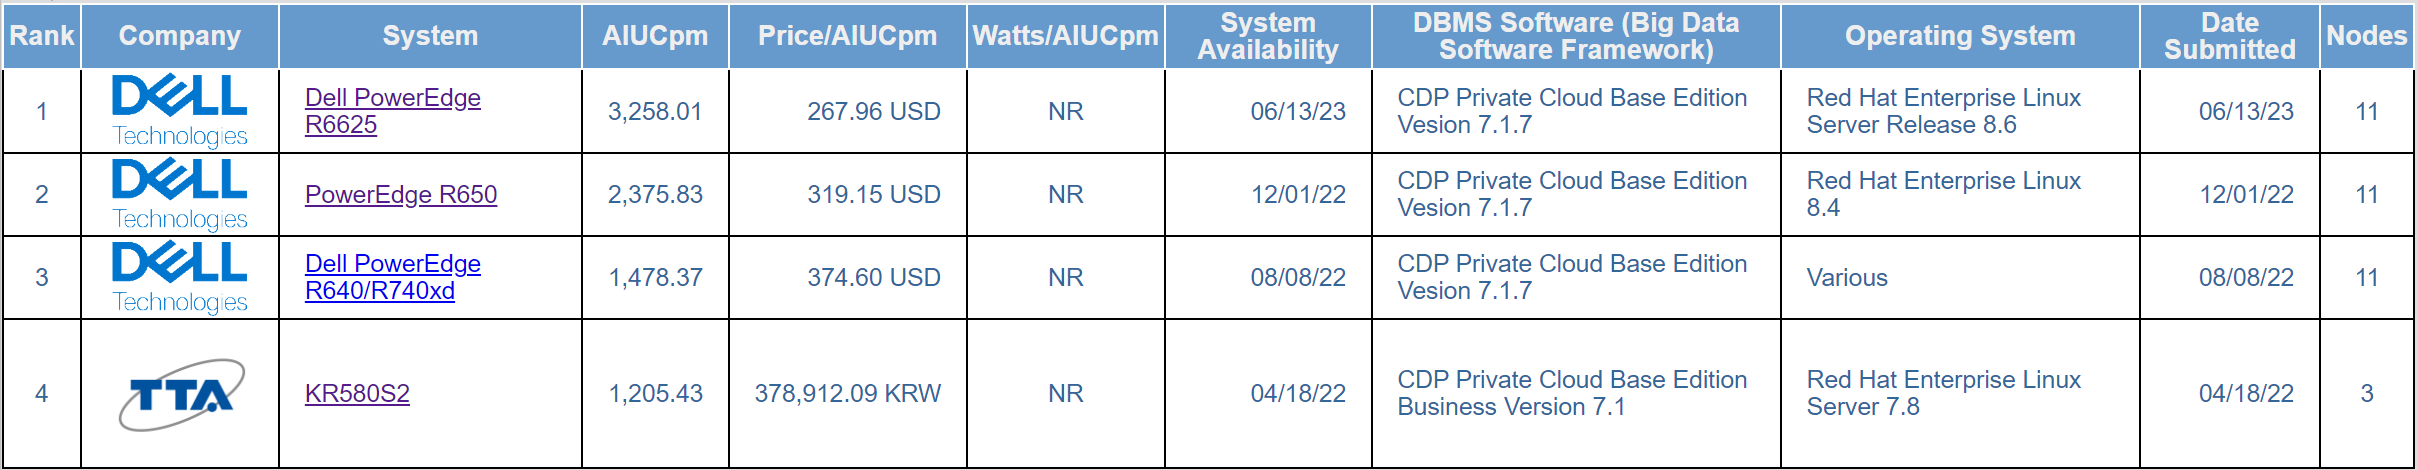
Table 8 Top price/performance table
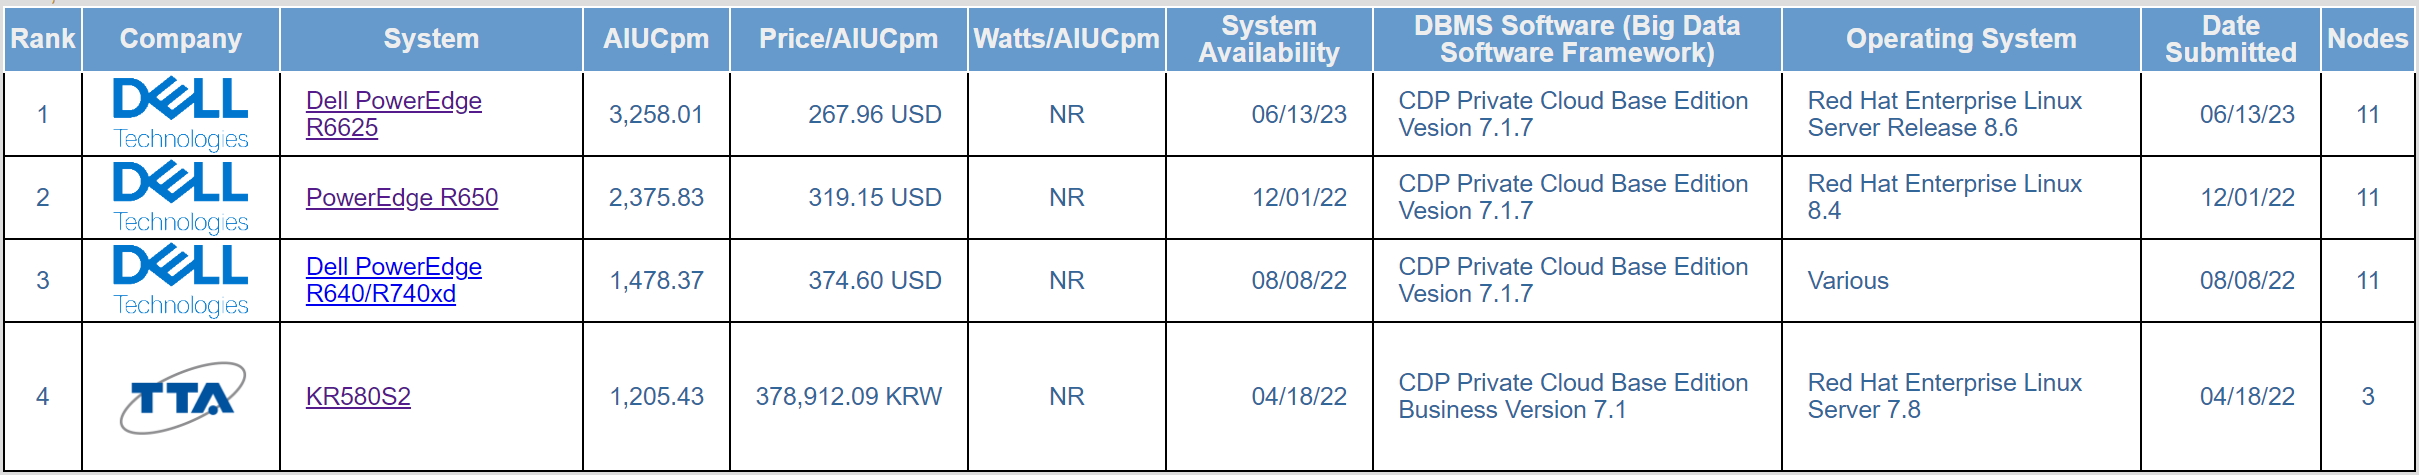
Table 7 and Table 8 are similar. Of the four published results at SF1000, Dell Technologies’ hardware platforms hold the number 1, number 2, and number 3 positions on both the performance and price/performance tables. The main difference between the three top results is the processor generations:
- The number 1 result used 4th generation AMD Genoa processors
- The number 2 result used 3rd generation Intel Ice Lake processors
- The number 3 result used 2nd generation Intel Cascade Lake processors
Key takeaways
- Dell dominates TPCx-AI top performance and price/performance tables at SF3, SF100, SF300, and SF1000.
- TPCx-AI performance improved greatly on newer generation Dell hardware platforms that have newer generation processors:
- There was a 60.71% performance improvement between hardware platforms powered by (14G) 2nd generation and (15G) 3rd generation processors.
- There was a 37.13% improvement between 3rd generation and (16G) 4th generation processors.
- TPCx-AI price/performance improved greatly between processor generations of the Dell 14G, 15G, and 16G hardware platforms:
- There was a 14.80% price/performance drop from hardware platforms powered by 2nd generation to 3rd generation processors.
- There was a 27.08% price/performance drop from 3rd generation to 4th generation processors.
- The form factor of the hardware platforms has reduced:
- The Dell 14G TPCx-AI SF1000 result used 2U servers
- The 15G and 16G results used 1U servers and scored better performance and price/performance
- Using NVMe data storage scored better price/performance metrics:
- The 14G result used hard drives
- The 15G and 16G results used more expensive NVMe data drives, and yet scored better price/performance metrics
Conclusion
This blog examined in detail the TPCx-AI performance result of the Dell 16G PE R6625 hardware platform. The result cemented Dell Technologies’ leadership positions on TPCx-AI performance and price/performance tables at SF1000, in addition to the leadership positions at SF3, SF100, and SF300. These results prove Dell Technologies’ leadership as a provider of high-performance AI, ML, and DL solutions based on verifiable performance data backed by a reputable, industry-standards performance consortium.
References
Nicholas Wakou, Nirmala Sundararajan; Interpreting the results of the TPCx-AI Benchmark; infohub.delltechnologies.com (February 2023).

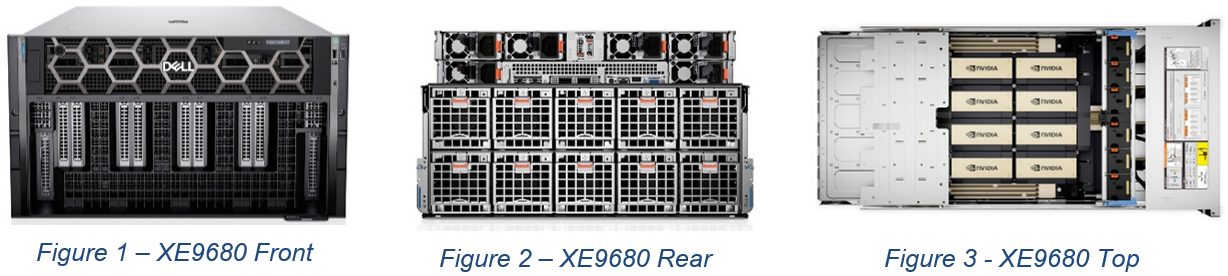
How Dell PowerEdge XE9680 Accelerates AI and High Performance Computing
Tue, 11 Apr 2023 21:37:45 -0000
|Read Time: 0 minutes
The Dell PowerEdge XE9680 is a high-performance server designed to deliver exceptional performance for machine learning workloads, AI inferencing, and high-performance computing. In this short blog, we summarize three articles that showcase the capabilities of the Dell PowerEdge XE9680 in different computing scenarios.
Unlocking Machine Learning with Dell PowerEdge XE9680
The first article, which I co-wrote with Liz Raymond, Naye Yoni, and Frank Han, describes how Dell PowerEdge XE9680 can unlock machine learning performance by delivering high-speed processing and efficient training of machine learning models. Based on our testing, we concluded that Dell PowerEdge XE9680 can help organizations unlock the full potential of their machine learning workloads:
Unlocking Machine Learning with Dell PowerEdge XE9680: Insights into MLPerf 2.1 Training Performance
Accelerating AI Inferencing with Dell PowerEdge XE9680
The second article, also co-written with Liz Raymond, Naye Yoni, and Frank Han, focuses on how the Dell PowerEdge XE9680 can accelerate AI inferencing using various models to make predictions or decisions. Our testing found that the Dell PowerEdge XE9680 can help organizations achieve faster and more accurate AI inferencing:
Accelerating AI Inferencing with Dell PowerEdge XE9680: A Performance Analysis
Accelerating High Performance Computing with Dell PowerEdge XE9680
The third article, co-written with Frank Han, showcases how Dell PowerEdge XE9680 can accelerate high-performance computing (HPC) by leveraging parallel processing techniques to solve complex problems. It focuses on the system's impressive performance in the HPL benchmark, which measures HPC performance. We concluded that the Dell PowerEdge XE9680 can help organizations achieve faster and more efficient HPC performance, enabling them to solve complex problems in less time:
Accelerating High-Performance Computing with Dell PowerEdge XE9680: A Look at HPL Performance
Author: Delmar Hernandez, Server Technologist