


Dell EMC Servers Shine in MLPerf Inference v0.7 Benchmark
Tue, 03 Nov 2020 12:46:25 -0000
|Read Time: 0 minutes
As software applications and systems using Artificial Intelligence (AI) gain mainstream adoption across all industries, inference workloads for ongoing operations are becoming a larger resource consumer in the datacenter. MLPerf is a benchmark suite that is used to evaluate the performance profiles of systems for both training and inference AI tasks. In this blog we take a closer look at the recent results submitted by Dell EMC and how our various servers performed in the datacenter category.
The reason we do this type of work is to help customers understand which server platform makes the most sense for their use case. Dell Technologies wants to make the choice easier and reduce work for our customers, so they don’t waste their precious resources. We want customers to use their time focusing on the use case helping accelerate time to value for the business.
Dell Technologies has a total of 210 submissions for MLPerf Inference v0.7 in the Datacenter category using various server platforms and accelerators. Why so many? It is because many customers have never run AI in their environment, the use cases are endless across industries and expertise limited. Customers have told us they need help identifying the correct server platform based on their workloads.
We’re proud of what we’ve done, but it’s still all about helping customers adopt AI. By sharing our expertise and providing guidance on infrastructure for AI, we help customers become successful and get their use case into production.
MLPerf Benchmarks
 MLPerf was founded in 2018 with a goal of accelerating improvements in ML system performance. Formed as a collaboration of companies and researchers from leading educational institutions, MLPerf leverages open source code, public state-of-the-art Machine Learning (ML) models and publicly available datasets contributed to the ML community. The MLPerf suites include MLPerf Training and MLPerf Inference.
MLPerf Training measures how fast a system can train machine learning models. Training benchmarks have been defined for image classification, lightweight and heavy-weight object detection, language translation, natural language processing, recommendation and reinforcement learning. Each benchmark includes specifications for input datasets, quality targets and reference implementation models. The first round of training submissions was published on the MLPerf website in December 2018 with results submitted by Google, Intel and NVIDIA.
The MLPerf Inference suite measures how quickly a trained neural network can evaluate new data and perform forecasting or classification for a wide range of applications. MLPerf Inference includes image classification, object detection and machine translation with specific models, datasets, quality, server latency and multi-stream latency constraints. MLPerf validated and published results for MLPerf Inference v0.7 on October 21, 2020. In this blog we take a closer look at the for MLPerf Inference v0.7 results submitted by Dell EMC and how the servers performed in the datacenter category.
A summary of the key highlights of the Dell EMC results are shown in Table 1. These are derived from the submitted results in MLPerf datacenter closed category. Ranking and claims are based on Dell analysis of published MLPerf data. Per accelerator is calculated by dividing the primary metric of total performance by the number of accelerators reported.
Rank | Category | Specifics | Use Cases |
#1 | Performance per Accelerator for NVIDIA A100-PCIe | PowerEdge R7525 | Medical Imaging, Image Classification |
#1 | Performance per Accelerator with NVIDIA T4 GPUs | PowerEdge XE2420, PowerEdge R7525, DSS8440 | Medical Imaging, NLP, Image Classification, Speech Recognition, Object Detection, Recommendation |
#1 | Highest inference results with Quadro RTX6000 and RTX8000 | PowerEdge R7525, DSS 8440 | Medical Imaging, NLP, Image Classification, Speech Recognition, Object Detection, Recommendation |
Dell EMC had a total of 210 submissions for MLPerf Inference v0.7 in the Datacenter category using various Dell EMC platforms and accelerators from leading vendors. We achieved impressive results when compared to other submissions in the same class of platforms.
MLPerf Inference Categories and Dell EMC Achievements
A benchmark suite is made up of tasks or models from vision, speech, language and commerce use cases. MLPerf Inference measures how fast a system can perform ML inference by using a load generator against the System Under Test (SUT) where the trained model is deployed.
There are three types of benchmark tests defined in MLPerf inference v0.7, one for datacenter systems, one for edge systems and one for mobile systems. MLPerf then has four different scenarios to enable representative testing of a wide variety of inference platforms and use cases:
- Single stream
- Multiple stream
- Server
- Offline
The single stream and multiple stream scenarios are only used for edge and mobile inference benchmarks. The data center benchmark type targets systems designed for data center deployments and requires evaluation of both the server and offline scenarios. The metrics used in the Datacenter category are inference operations/second. In the server scenario, the MLPerf load generator sends new queries to the SUT according to a Poisson distribution. This is representative of on-line AI applications such as translation, image tagging which have variable arrival patterns based on end-user traffic. Offline represents AI tasks done thru batch processing such as photo categorization where all the data is readily available ahead of time.
Dell EMC published multiple results in the datacenter systems category. Details on the models, dataset and the scenarios submitted for the different datacenter benchmark are shown in Table 2
Area | Task | Model | Dataset | Required Scenarios |
Vision | Image classification | ResNet50-v1.5 | Imagenet (224x224) | Server, Offline |
Object detection (large) | SSD-ResNet34 | COCO (1200x1200) | Server, Offline | |
Medical image segmentation | 3d Unet | BraTS 2019 (224x224x160) | Offline | |
Speech | Speech-to-text | RNNT | Librispeech dev-clean (samples < 15 seconds) | Server, Offline |
Language | Language processing | BERT | SQuAD v1.1 (max_seq_len=384) | Server, Offline |
Commerce | Recommendation | DLRM | 1TB Click Logs | Server, Offline |
Next we highlight some of the key performance achievements for the broad range of solutions available in the Dell EMC portfolio for inference use cases and deployments.
1. Dell EMC is #1 in total number of datacenter submissions in the closed division including bare metal submissions using different GPUs, Xeon CPUs, Xilinx FPGA and virtualized submission on VMware vSphere
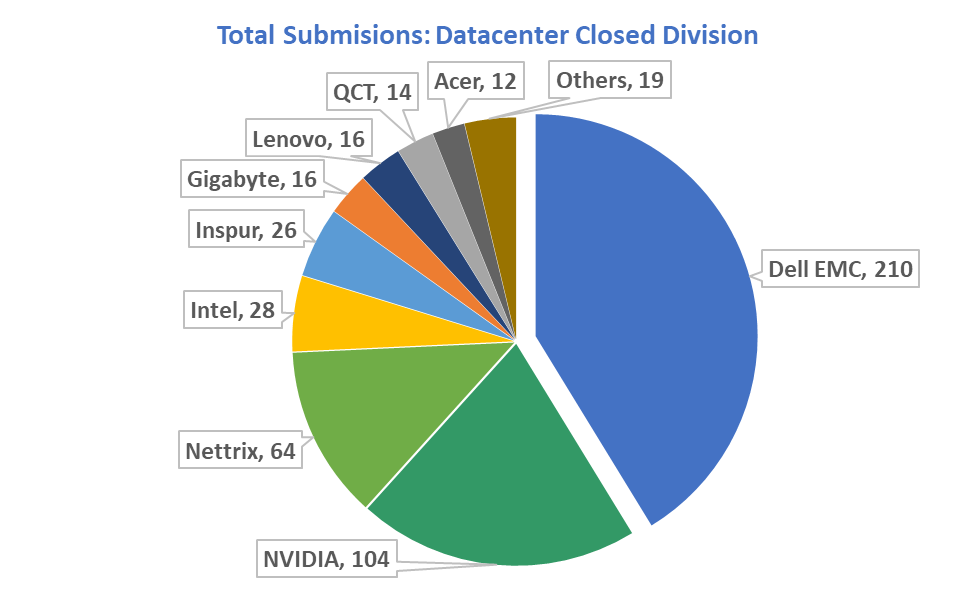
The closed division enables head to head comparisons and consists of server platforms used from the Edge to private or public clouds. The Dell Technologies engineering team submitted 210 out of the total 509 results.
We remain committed to helping customers deploy inference workloads as efficiently as possible, meeting their unique requirements of power, density, budget and performance. The wide range of servers submitted by Dell Technologies’ is a testament to this commitment -
- The only vendor with submissions for a variety of inference solutions – leveraging GPU, FPGA and CPUs for the datacenter/private cloud and Edge
- Unique in the industry by submitting results across a multitude of servers that range from mainstream servers (R740/R7525) to dense GPU-optimized servers supporting up to 16 NVIDIA GPUs (DSS8440).
- Demonstrated that customers that demand real-time inferencing at the telco or retail Edge can deploy up to 4 GPUs in a short depth NEBS-compliant PowerEdge XE2420 server.
- Demonstrated efficient Inference performance using the 2nd Gen Intel Xeon Scalable platform on the PowerEdge R640 and PowerEdge R740 platforms for customers wanting to run inference on Intel CPUs.
- Dell submissions using Xilinx U280 in PowerEdge R740 demonstrated that customers wanting low latency inference can leverage FPGA solutions.
2. Dell EMC is #1 in performance “per Accelerator” with PowerEdge R7525 and A100-PCIe for multiple benchmarks
The Dell EMC PowerEdge R7525 was purpose-built for superior accelerated performance. The MLPerf results validated leading performance across many scenarios including:
Performance Rank “Per Accelerator” | Inference Throughput | Dell EMC System |
#1 ResNet50 (server) | 30,005 | PowerEdge R7525 (3x NVIDIA A100-PCIE) |
#1 3D-Unet-99 (offline) | 39 | PowerEdge R7525 (3x NVIDIA A100-PCIE) |
#1 3D-Unet-99 (offline) | 39 | PowerEdge R7525 (3x NVIDIA A100-PCIE) |
#2 DLRM-99 (server) | 192,543 | PowerEdge R7525 (2x NVIDIA A100-PCIE) |
#2 DLRM-99 (server) | 192,543 | PowerEdge R7525 (2x NVIDIA A100-PCIE) |
3. Dell achieved the highest inference scores with NVIDIA Quadro RTX GPUs using the DSS 8440 and R7525
Dell Technologies engineering understands that since training isn’t the only AI workload, using the right technology for each job is far more cost effective. Dell is the only vendor to submit results using NVIDIA RTX6000 and RTX8000 GPUs that provide up to 48GB HBM memory for large inference models. The DSS 8440 with 10 Quadro RTX achieved
- #2 and #3 highest system performance on RNN-T for Offline scenario.
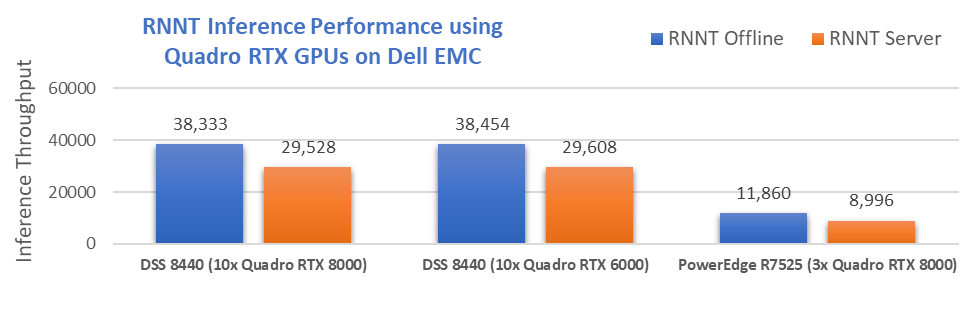
The #1 ranking was delivered using 8x NVIDIA A100 SXM4 that was introduced in May 2020 and is a powerful system for customer to train state of the art deep learning models. Dell Technologies took the #2 and #3 spots with the DSS8440 server equipped with 10x NVIDIA RTX8000 and DSS8440 with 10x NVIDIA RTX6000 providing a better power and cost efficiency for inference workloads compared to other submissions.
4. Dell EMC claims #1 spots for NVIDIA T4 platforms with DSS 8440, XE2420 and PowerEdge R7525
Dell Technologies provides system options for customers to deploy inference workloads that match their unique requirements. Today’s accelerators vary significantly in price, performance and power consumption. For example, the NVIDIA T4 is a low profile, lower power GPU option that is widely deployed for inference due to its superior power efficiency and economic value for that use case.
The MLPerf results corroborate the exemplary inference performance of NVIDIA T4 on Dell EMC Servers. The T4 leads for performance per GPU among the 20 servers used to submit scores using NVIDIA T4 GPUs
- #1 in performance per GPU on 3d-unet-99 and 3d-unet-99.9 Offline scenario
- #1 in performance per GPU on Bert-99 Server and Bert-99.9 Offline scenario
- #1, #2 and #3 in performance with T4 on DLRM-99 & DLRM-99.9 Server scenario
- #1 in performance per GPU on ResNet50 Offline scenario
- #1 in performance per GPU on RNN-T Server and Offline scenario
- #1 in performance per GPU on SSD-large Offline scenario
The best scores achieved for the NVIDIA T4 “Per GPU” rankings above and respective platforms are shown in the table:
Benchmark | Offline Scenario | Server Scenario | ||||
Rank | Throughput | Server | Rank | Throughput | Server | |
3d-unet-99 | #1 | 7.6 | XE2420 | n/a | ||
3d-unet-99.9 | #1 | 7.6 | XE2420 | n/a |
|
|
bert-99 | #3 | 449 | XE2420 | #1 | 402 | XE2420 |
bert-99.9 | #1 | 213 | DSS 8440 | #2 | 190 | XE2420 |
dlrm-99 | #2 | 35,054 | XE2420 | #1 | 32,507 | R7525 |
dlrm-99.9 | #2 | 35,054 | XE2420 | #1 | 32,507 | R7525 |
resnet | #1 | 6,285 | XE2420 | #4 | 5,663 | DSS 8440 |
rnnt | #1 | 1,560 | XE2420 | #1 | 1,146 | XE2420 |
ssd-large | #1 | 142 | XE2420 | #2 | 131 | DSS 8440 |
5. Dell is the only vendor to submit results on virtualized infrastructure with vCPUs and NVIDIA virtual GPUs (vGPU) on VMware vSphere
Customers interested in deploying inference workloads for AI on virtualized infrastructure can leverage Dell servers with VMware software to reap the benefits of virtualization.
To demonstrate efficient virtualized performance on Intel 2nd Generation Intel Xeon Scalable processors, Dell EMC and VMware submitted results using vSphere and OpenVino on the PowerEdge R640.
- Virtualization overhead for a single VM was observed to be minimal and testing showed that using multiple VMs could be deployed on a single server to achieve ~26% better throughput compared to a bare metal environment.
Dell EMC has published guidance on virtualizing GPUs using DirectPath I/O, NVIDIA Virtual Compute Server (vCS) and more. Dell EMC and VMware used NVIDIA vCS virtualization software in vSphere for MLPerf Inference benchmarks on virtualized NVIDIA T4 GPUs
- VMware vSphere using NVIDIA vCS delivers near bare metal performance for MLPerf Inference v0.7 benchmarks. The inference throughput (queries processed per second) increases linearly as the number of vGPUs attached to the VM increases.
Blogs covering these virtualized tests in greater detail are published at VMware’s performance Blog site.
This finishes our coverage of the top 5 highlights out of the 200+ submissions done by Dell EMC in the datacenter division. Next we discuss other aspects of the GPU optimized portfolio that are important for customers – quality and support.
Dell has the highest number of NVIDIA GPU submissions using NVIDIA NGC Ready systems
Dell GPU enabled platforms are part of NVIDIA NGC-Ready and NGC-Ready for Edge validation programs. At Dell, we understand that performance is critical, but customers are not willing to compromise quality and reliability to achieve maximum performance. Customers can confidently deploy inference and other software applications from the NVIDIA NGC catalog knowing that the Dell systems meet all the requirements set by NVIDIA to deploy customer workloads on-premises or at the Edge.
 NVIDIA NGC validated configs that were used for this round of MLPerf submissions are:
- Dell EMC PowerEdge XE2420 (4x T4)
- Dell EMC DSS 8440 (10x Quadro RTX 8000)
- Dell EMC DSS 8440 (12x T4)
- Dell EMC DSS 8440 (16x T4)
- Dell EMC DSS 8440 (8x Quadro RTX 8000)
- Dell EMC PowerEdge R740 (4x T4)
- Dell EMC PowerEdge R7515 (4x T4)
- Dell EMC PowerEdge R7525 (2x A100-PCIE)
- Dell EMC PowerEdge R7525 (3x Quadro RTX 8000)
Dell EMC portfolio can address customers inference needs from on-premises to the edge
In this blog, we highlighted the results submitted by Dell EMC to demonstrate how our various servers performed in the datacenter category. The Dell EMC server portfolio provides many options for customer wanting to deploy AI inference in their datacenters or on the edge. We also offer a wide range of accelerator options including both multiple GPU and FPGA models for running inference either on bare metal or virtualized infrastructure that can meet specific application and deployment requirements.
Finally, we list the performance for a subset of the server platforms that we see mostly commonly used by customers today for running inference workloads. These rankings highlight that the platform can support a wide range of inference use cases that are showcased in the MLPerf suite.
1. The Dell EMC PowerEdge XE2420 with 4x NVIDIA T4 GPUs: Ranked between #1 and #3 in 14 out of 16 benchmark categories when compared with other T4 Servers
Dell EMC PowerEdge XE2420 (4x T4) Per Accelerator Ranking* | |||
| Offline | Server |
|
3d-unet-99 | #1 | n/a
| |
3d-unet-99.9 | #1 | ||
bert-99 | #3 | #1 | |
bert-99.9 | #2 | #2 | |
dlrm-99 | #1 | #3 | |
dlrm-99.9 | #1 | #3 | |
resnet | #1 |
| |
rnnt | #1 | #1 | |
ssd-large | #1 |
| |
2. Dell EMC PowerEdge R7525 with 8x T4 GPUs: Ranked between #1 and #5 in 11 out of 16 benchmark categories in T4 server submission
Dell EMC PowerEdge R7525 (8x T4) Per Accelerator Ranking* | |||
| Offline | Server |
|
3d-unet-99 | #4 | n/a
| |
3d-unet-99.9 | #4 | ||
bert-99 | #4 |
| |
dlrm-99 | #2 | #1 | |
dlrm-99.9 | #2 | #1 | |
rnnt | #2 | #5 | |
ssd-large | #5 |
| |
3. The Dell EMC PowerEdge R7525 with up to 3xA100-PCIe: ranked between #3 and #10 in 15 out of 16 benchmark categories across all datacenter submissions
Dell EMC PowerEdge R7525 (2|3x A100-PCIe) Per Accelerator | |||
| Offline | Server |
|
3d-unet-99 | #4 | n/a
| |
3d-unet-99.9 | #4 | ||
bert-99 | #8 | #9 | |
bert-99.9 | #7 | #8 | |
dlrm-99 | #6 | #4 | |
dlrm-99.9 | #6 | #4 | |
resnet | #10 | #3 | |
rnnt | #6 | #7 | |
ssd-large | #10 |
| |
4. The Dell EMC DSS 8440 with 16x T4 ranked between #3 and #7 when compared against all submissions using T4
Dell EMC DSS 8440 (16x T4) | |||
| Offline | Server |
|
3d-unet-99 | #4 | n/a
| |
3d-unet-99.9 | #4 | ||
bert-99 | #6 | #4 | |
bert-99.9 | #7 | #5 | |
dlrm-99 | #3 | #3 | |
dlrm-99.9 | #3 | #3 | |
resnet | #6 | #4 | |
rnnt | #5 | #5 | |
ssd-large | #7 | #5 | |

5. The Dell EMC DSS 8440 with 10x RTX6000 ranked between #2 and #6 in 14 out of 16 benchmarks when compared against all submissions
Dell EMC DSS 8440 (10x Quadro RTX6000) | |||
| Offline | Server |
|
3d-unet-99 | #4 | n/a
| |
3d-unet-99.9 | #4 | ||
bert-99 | #4 | #5 | |
bert-99.9 | #4 | #5 | |
dlrm-99 |
|
| |
dlrm-99.9 |
|
| |
resnet | #5 | #6 | |
rnnt | #2 | #5 | |
ssd-large | #5 | #6 | |
6. Dell EMC DSS 8440 with 10x RTX8000 ranked between #2 and #6 when compared against all submissions
Dell EMC DSS 8440 (10x Quadro RTX8000) | |||
| Offline | Server |
|
3d-unet-99 | #5 | n/a
| |
3d-unet-99.9 | #5 | ||
bert-99 | #5 | #4 | |
bert-99.9 | #5 | #4 | |
dlrm-99 | #3 | #3 | |
dlrm-99.9 | #3 | #3 | |
resnet | #6 | #5 | |
rnnt | #3 | #6 | |
ssd-large | #6 | #5 | |
Get more information on MLPerf results at www.mlperf.org and earn more about PowerEdge servers that are optimized for AI / ML / DL at www.DellTechnologies.com/Servers
Acknowledgements: These impressive results were made possible by the work of the following Dell EMC and partner team members - Shubham Billus, Trevor Cockrell, Bagus Hanindhito (Univ. of Texas, Austin), Uday Kurkure (VMWare), Guy Laporte, Anton Lokhmotov (Dividiti), Bhavesh Patel, Vilmara Sanchez, Rakshith Vasudev, Lan Vu (VMware) and Nicholas Wakou. We would also like to thank our partners – NVIDIA, Intel and Xilinx for their help and support in MLPerf v0.7 Inference submissions.
Related Blog Posts

Multinode Performance of Dell PowerEdge Servers with MLPerfTM Training v1.1
Mon, 07 Mar 2022 19:51:12 -0000
|Read Time: 0 minutes
The Dell MLPerf v1.1 submission included multinode results. This blog showcases performance across multiple nodes on Dell PowerEdge R750xa and XE8545 servers and demonstrates that the multinode scaling performance was excellent.
The compute requirement for deep learning training is growing at a rapid pace. It is imperative to train models across multiple nodes to attain a faster time-to-solution. Therefore, it is critical to showcase the scaling performance across multiple nodes. To demonstrate to customers the performance that they can expect across multiple nodes, our v1.1 submission includes multinode results. The following figures show multinode results for PowerEdge R750xa and XE8545 systems.
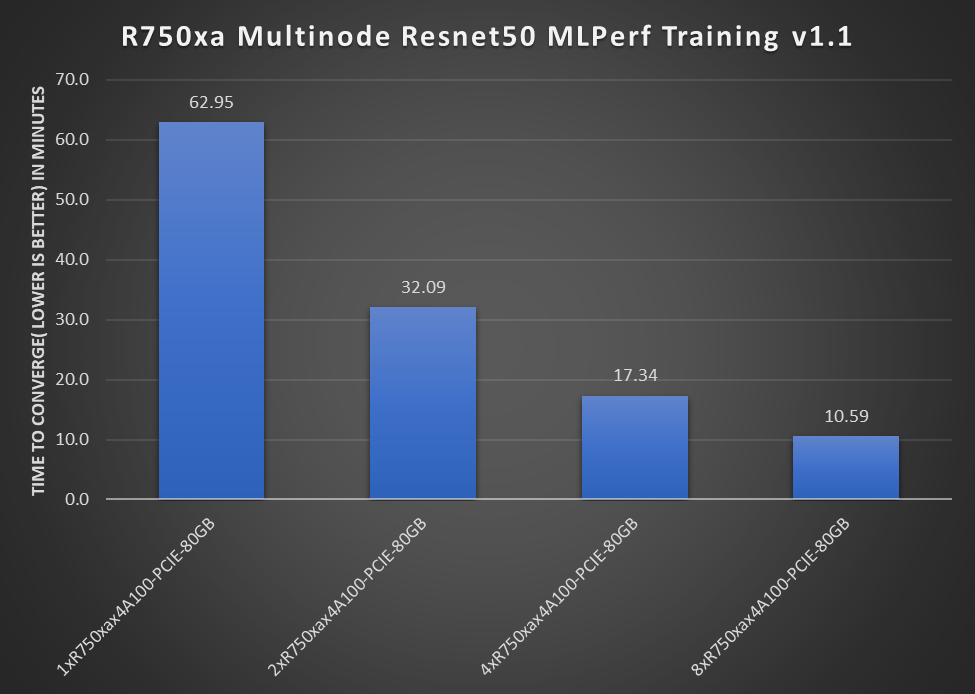
Figure 1: One-, two-, four-, and eight-node results with PowerEdge R750xa Resnet50 MLPerf v1.1 scaling performance
Figure 1 shows the performance of the PowerEdge R750xa server with Resnet50 training. These numbers scale from one node to eight nodes, from four NVIDIA A100-PCIE-80GB GPUs to 32 NVIDIA A100-PCIE-80GB GPUs. We can see that the scaling is almost linear across nodes. MLPerf training requires passing Reference Convergence Points (RCP) for compliance. These RCPs were inhibitors to show linear scaling for the 8x scaling case. The near linear scaling makes a PowerEdge R750xa node an excellent choice for multinode training setup.
The workload was distributed by using singularity on PowerEdge R750xa servers. Singularity is a secure containerization solution that is primarily used in traditional HPC GPU clusters. Our submission includes setup scripts with singularity that help traditional HPC customers run workloads without the need to fully restructure their existing cluster setup. The submission also includes Slurm Docker-based scripts.
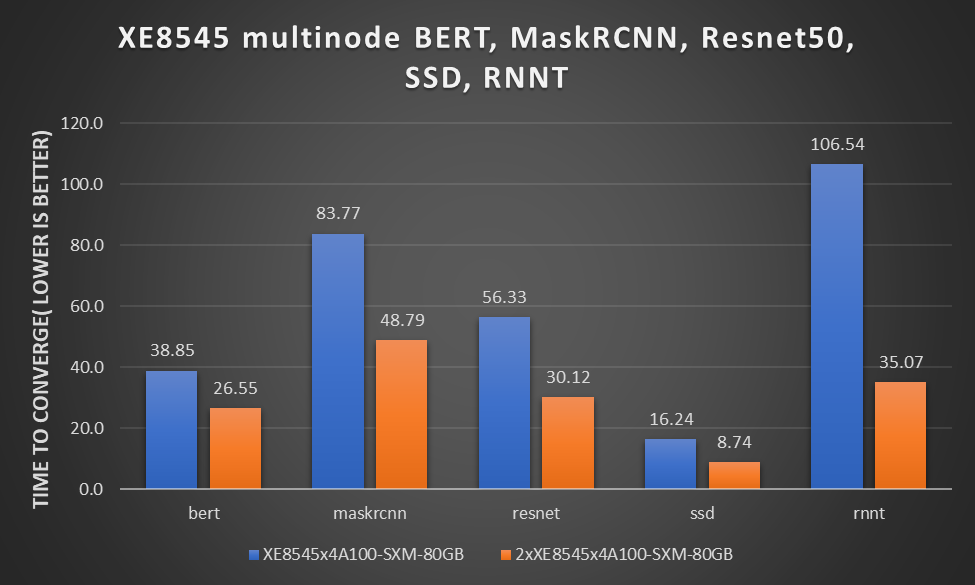
Figure 2: Multinode submission results for PowerEdge XE8545 server with BERT, MaskRCNN, Resnet50, SSD, and RNNT
Figure 2 shows the submitted performance of the PowerEdge XE8545 server with BERT, MaskRCNN, Resnet50, SSD, and RNNT training. These numbers scale from one node to two nodes, from four NVIDIA A100-SXM-80GB GPUs to eight NVIDIA A100-SXM-80GB GPUs. All GPUs operate at 500W TDP for maximum performance. They were distributed using Slurm and Docker on PowerEdge XE8545 servers. The performance is nearly linear.
Note: The RNN-T single node results submitted for the PowerEdge XE8545x4A100-SXM-80GB system used a different set of hyperparameters than for two nodes. After the submission, we ran the RNN-T benchmark again on the PowerEdge XE8545x4A100-SXM-80GB system with the same hyperparameters and found that the new time to converge is approximately 77.37 minutes. Because we only had the resources to update the results for the 2xXE8545x4A100-SXM-80GB system before the submission deadline, the MLCommons results show 105.6 minutes for a single node XE8545x4100-SXM-80GB system.
The following figure shows the adjusted representation of performance for the PowerEdge XE8545x4A100-SXM-80GB system. RNN-T provides an unverified score of 77.31 minutes[1]:
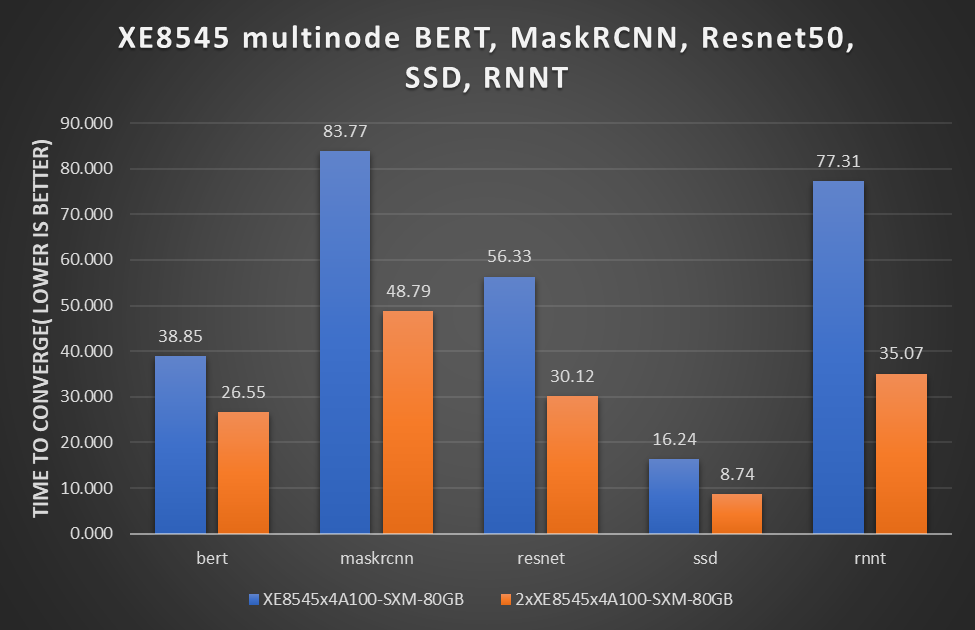
Figure 3: Revised multinode results with PowerEdge XE8545 BERT, MaskRCNN, Resnet50, SSD, and RNNT
Figure 3 shows the linear scaling abilities of the PowerEdge XE8545 server across different workloads such as BERT, MaskRCNN, ResNet, SSD, and RNNT. This linear scaling ability makes the PowerEdge XE8545 server an excellent choice to run large-scale multinode workloads.
Note: This rnnt.zip file includes log files for 10 runs that show that the averaged performance is 77.31 minutes.
Conclusion
- It is critical to measure deep learning performance across multiple nodes to assess the scalability component of training as deep learning workloads are growing rapidly.
- Our MLPerf training v1.1 submission includes multinode results that are linear and perform extremely well.
- Scaling numbers for the PowerEdge XE8545 and PowerEdge R750xa server make them excellent platform choices for enabling large scale deep learning training workloads across different areas and tasks.
[1] MLPerf v1.1 Training RNN-T; Result not verified by the MLCommonsTM Association. The MLPerf name and logo are trademarks of MLCommons Association in the United States and other countries. All rights reserved. Unauthorized use strictly prohibited. See http://www.mlcommons.org for more information.

MLPerf™ Inference v4.0 Performance on Dell PowerEdge R760xa and R7615 Servers with NVIDIA L40S GPUs
Fri, 05 Apr 2024 17:41:56 -0000
|Read Time: 0 minutes
Abstract
Dell Technologies recently submitted results to the MLPerf™ Inference v4.0 benchmark suite. This blog highlights Dell Technologies’ closed division submission made for the Dell PowerEdge R760xa, Dell PowerEdge R7615, and Dell PowerEdge R750xa servers with NVIDIA L40S and NVIDIA A100 GPUs.
Introduction
This blog provides relevant conclusions about the performance improvements that are achieved on the PowerEdge R760xa and R7615 servers with the NVIDIA L40S GPU compared to the PowerEdge R750xa server with the NVIDIA A100 GPU. In the following comparisons, we held the GPU constant across the PowerEdge R760xa and PowerEdge R7615 servers to show the excellent performance of the NVIDIA L40S GPU. Additionally, we also compared the PowerEdge R750xa server with the NVIDIA A100 GPU to its successor the PowerEdge R760xa server with the NVIDIA L40S GPU.
System Under Test configuration
The following table shows the System Under Test (SUT) configuration for the PowerEdge servers.
Table 1: SUT configuration of the Dell PowerEdge R750xa, R760xa, and R7615 servers for MLPerf Inference v4.0
Server | PowerEdge R750xa | PowerEdge R760xa | PowerEdge R7615 |
MLPerf Version | V4.0
| ||
GPU | NVIDIA A100 PCIe 80 GB | NVIDIA L40S
| |
Number of GPUs | 4 | 2 | |
MLPerf System ID | R750xa_A100_PCIe_80GBx4_TRT | R760xa_L40Sx4_TRT | R7615_L40Sx2_TRT
|
CPU | 2 x Intel Xeon Gold 6338 CPU @ 2.00GHz | 2 x Intel Xeon Platinum 8470Q | 1 x AMD EPYC 9354 32-Core Processor |
Memory | 512 GB | ||
Software Stack | TensorRT 9.3.0 CUDA 12.2 cuDNN 8.9.2 Driver 535.54.03 / 535.104.12 DALI 1.28.0 | ||
The following table lists the technical specifications of the NVIDIA L40S and NVIDIA A100 GPUs.
Table 2: Technical specifications of the NVIDIA A100 and NVIDIA L40S GPUs
Model | NVIDIA A100 | NVIDIA L40S | ||
Form factor | SXM4 | PCIe Gen4 | PCIe Gen4 | |
GPU architecture | Ampere | Ada Lovelace | ||
CUDA cores | 6912 | 18176 | ||
Memory size | 80 GB | 48 GB | ||
Memory type | HBM2e | HBM2e | ||
Base clock | 1275 MHz | 1065 MHz | 1110 MHz | |
Boost clock | 1410 MHz | 2520 MHz | ||
Memory clock | 1593 MHz | 1512 MHz | 2250 MHz | |
MIG support | Yes | No | ||
Peak memory bandwidth | 2039 GB/s | 1935 GB/s | 864 GB/s | |
Total board power | 500 W | 300 W | 350 W | |
Dell PowerEdge R760xa server
The PowerEdge R760xa server shines as an Artificial Intelligence (AI) workload server with its cutting-edge inferencing capabilities. This server represents the pinnacle of performance in the AI inferencing space with its processing prowess enabled by Intel Xeon Platinum processors and NVIDIA L40S GPUs. Coupled with NVIDIA TensorRT and CUDA 12.2, the PowerEdge R760xa server is positioned perfectly for any AI workload including, but not limited to, Large Language Models, computer vision, Natural Language Processing, robotics, and edge computing. Whether you are processing image recognition tasks, natural language understanding, or deep learning models, the PowerEdge R760xa server provides the computational muscle for reliable, precise, and fast results.
Figure 1: Front view of the Dell PowerEdge R760xa server
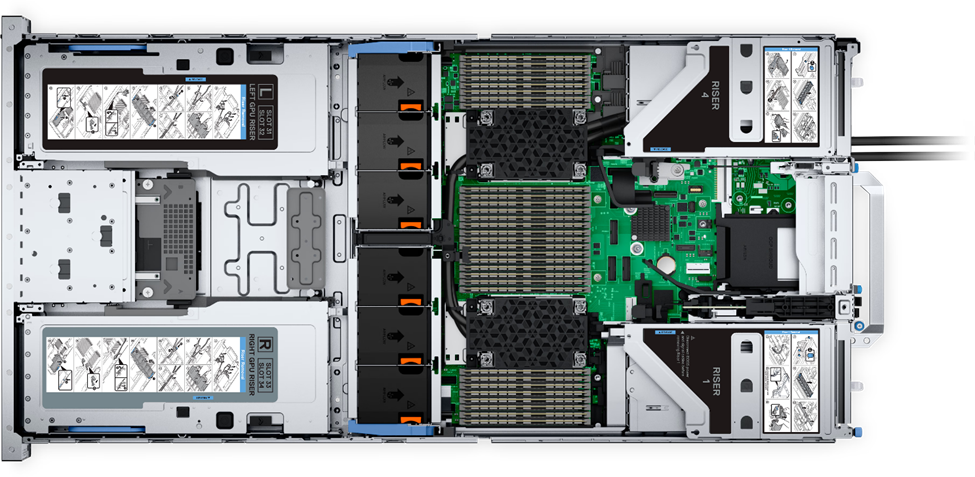
Figure 2: Top view of the Dell PowerEdge R760xa server
Dell PowerEdge R7615 server
The PowerEdge R7615 server stands out as an excellent choice for AI, machine learning (ML), and deep learning (DL) workloads due to its robust performance capabilities and optimized architecture. With its powerful processing capabilities including up to three NVIDIA L40S GPUs supported by TensorRT, this server can handle complex neural network inference and training tasks with ease. Powered by a single AMD EPYC processor, this server performs well for any demanding AI workloads.
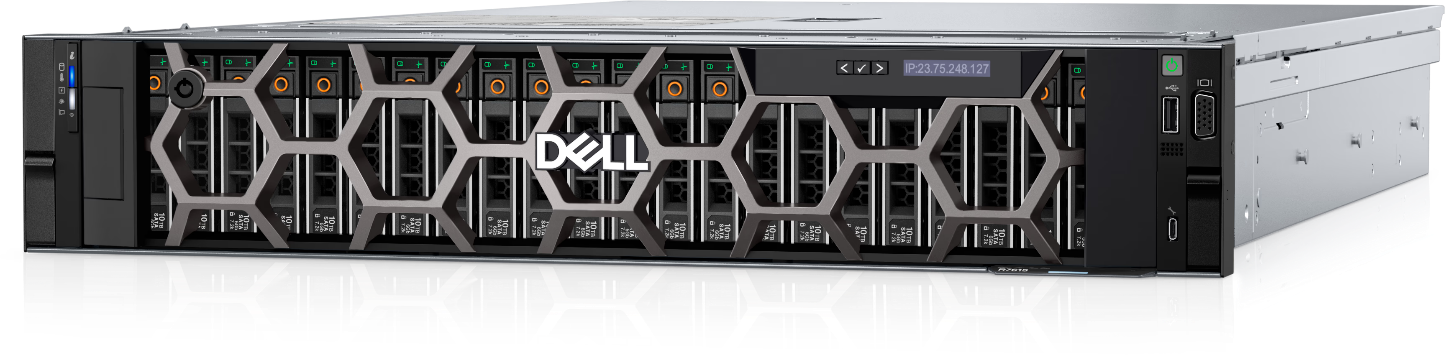
Figure 3: Front view of the Dell PowerEdge R7615 server
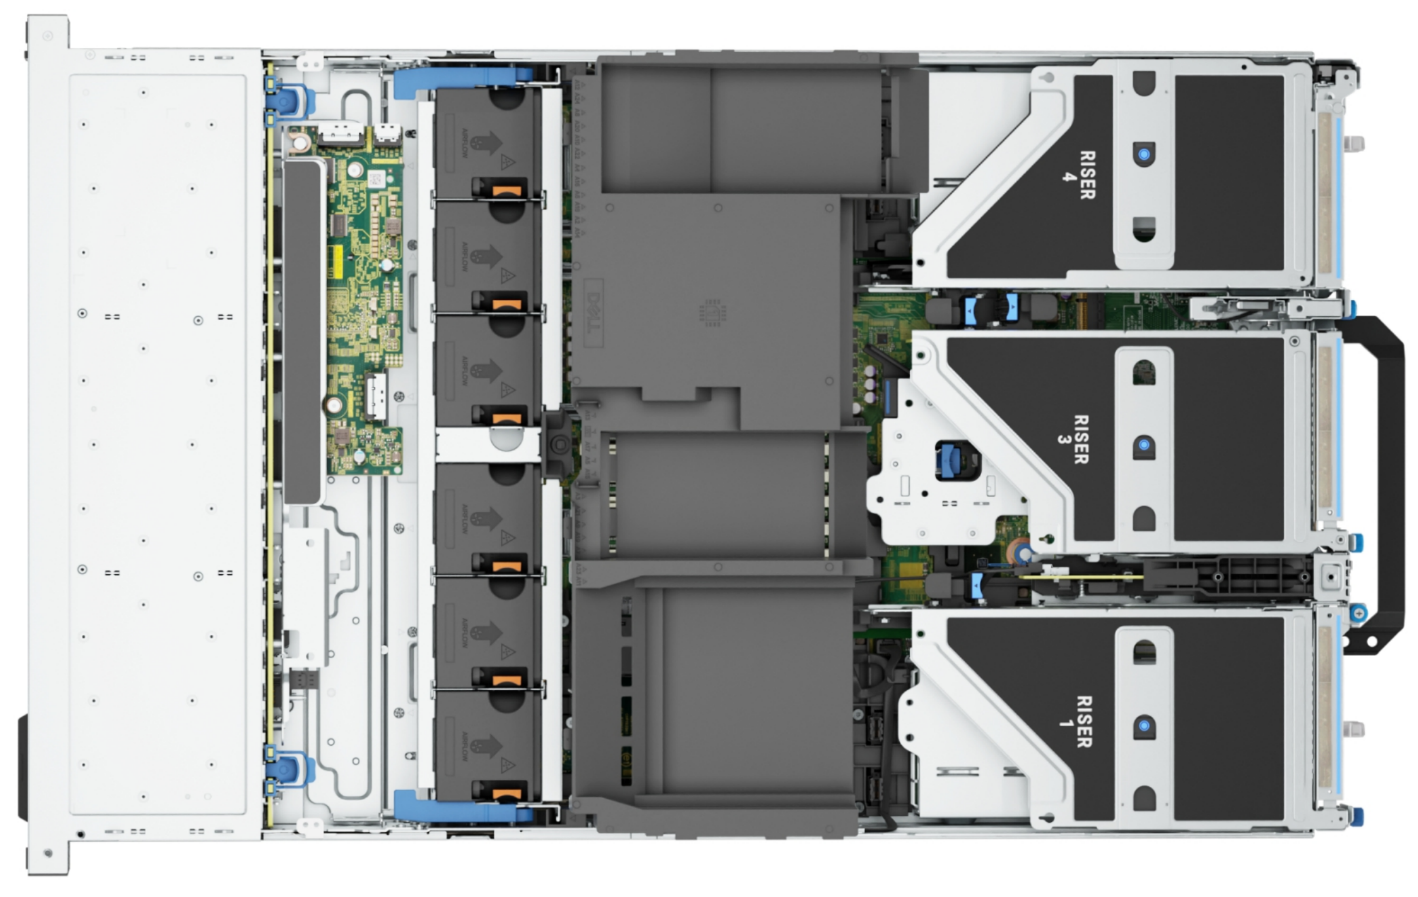
Figure 4: Top view of the Dell PowerEdge R7615 server
Dell PowerEdge R750xa server
The PowerEdge R750xa server is a perfect blend of technological prowess and innovation. This server is equipped with Intel Xeon Gold processors and the latest NVIDIA GPUs. The PowerEdge R760xa server is designed for the most demanding AI, ML, and DL workloads as it is compatible with the latest NVIDIA TensorRT engine and CUDA version. With up to nine PCIe Gen4 slots and availability in a 1U or 2U configuration, the PowerEdge R750xa server is an excellent option for any demanding workload.
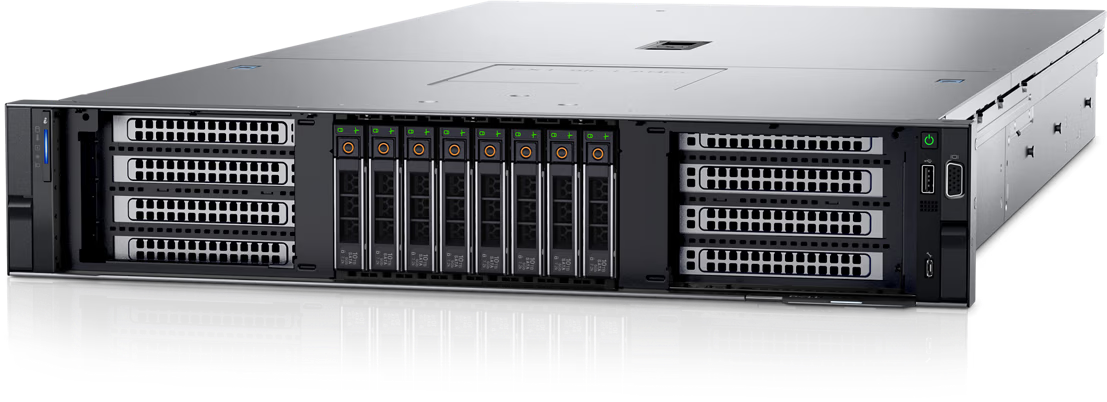
Figure 5: Front view of the Dell PowerEdge R750xa server
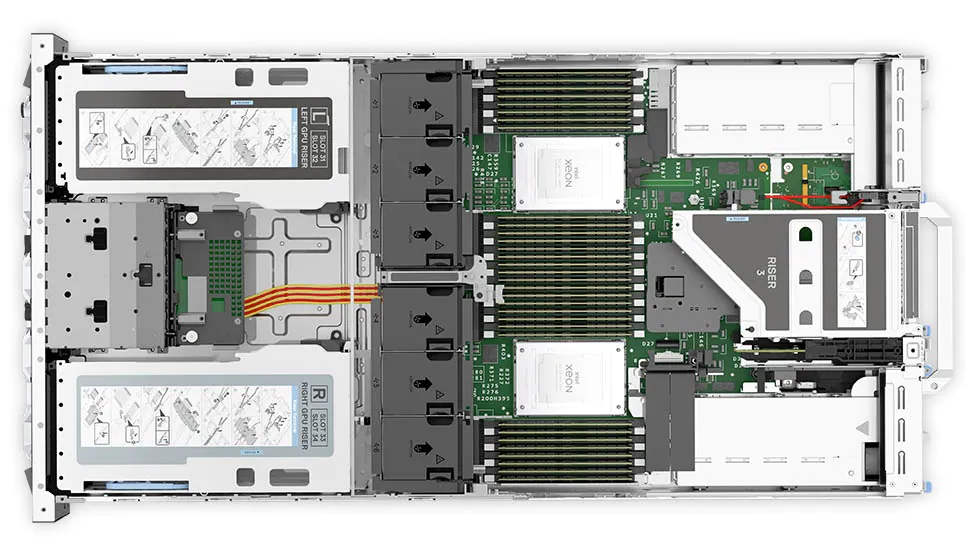
Figure 6: Top view of the Dell PowerEdge R750xa server
Performance results
Classical Deep Learning models performance
The following figure presents the results as a ratio of normalized numbers over the Dell PowerEdge R750xa server with four NVIDIA A100 GPUs. This result provides an easy-to-read comparison of three systems and several benchmarks.
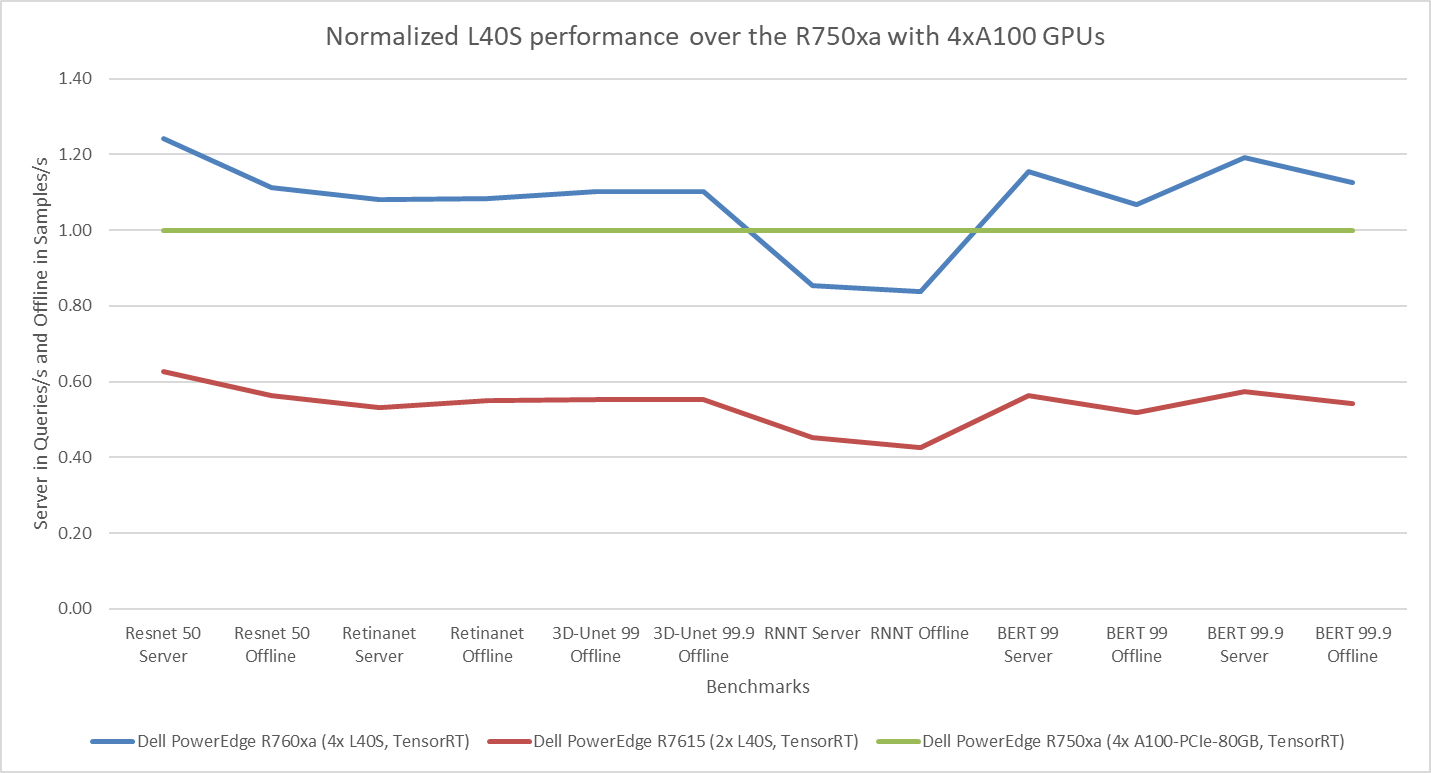
Figure 7: Normalized NVIDIA L40S GPU performance over the PowerEdge R750xa server with four A100 GPUs
The green trendline represents the performance of the Dell PowerEdge R750xa server with four NVIDIA A100 GPUs. With a score of 1.00 for each benchmark value, the results have been divided by themselves to serve as the baseline in green for this comparison. The blue trendline represents the performance of the PowerEdge R760xa server with four NVIDIA L40S GPUs that has been normalized by dividing each benchmark result by the corresponding score achieved by the PowerEdge R750xa server. In most cases, the performance achieved on the PowerEdge R760xa server outshines the results of the PowerEdge R750xa server with NVIDIA A100 GPUs, proving the expected improvements from the NVIDIA L40S GPU. The red trendline has also been normalized over the PowerEdge R750xa server and represents the performance of the PowerEdge R7615 server with two NVIDIA L40S GPUs. It is interesting that the red line almost mimics the blue line. This result suggests that the PowerEdge R7615 server, despite having half the compute resources, still performs comparably well in most cases, showing its efficiency.
Generative AI performance
The latest submission saw the introduction of the new Stable Diffusion XL benchmark. In the context of generative AI, stable diffusion is a text to image model that generates coherent image samples. This result is achieved gradually by refining and spreading out information throughout the generation process. Consider the example of dropping food coloring into a large bucket of water. Initially, only a small, concentrated portion of the water turns color, but gradually the coloring is evenly distributed in the bucket.
The following table shows the excellent performance of the PowerEdge R760xa server with the powerful NVIDIA L40S GPU for the GPT-J and Stable Diffusion XL benchmarks. The PowerEdge R760xa takes the top spot in GPT-J and Stable Diffusion XL when compared to other NVIDIA L40S results.
Table 3: Benchmark results for the PowerEdge R760xa server with the NVIDIA L40S GPU
Benchmark | Dell PowerEdge R760xa L40S result (Server in Queries/s and Offline in Samples/s) | Dell’s % gain to the next best non-Dell results (%) |
Stable Diffusion XL Server | 0.65 | 5.24 |
Stable Diffusion XL Offline | 0.67 | 2.28 |
GPT-J 99 Server | 12.75 | 4.33 |
GPT-J 99 Offline | 12.61 | 1.88 |
GPT-J 99.9 Server | 12.75 | 4.33 |
GPT-J 99.9 Offline | 12.61 | 1.88 |
Conclusion
The MLPerf Inference submissions elicit insightful like-to-like comparisons. This blog highlights the impressive performance of the NVIDIA L40S GPU in the Dell PowerEdge R760xa and PowerEdge R7615 servers. Both servers performed well when compared to the performance of the Dell PowerEdge R750xa server with the NVIDIA A100 GPU. The outstanding performance improvements in the NVIDIA L40S GPU coupled with the Dell PowerEdge server position Dell customers to succeed in AI workloads. With the advent of the GPT-J and Stable diffusion XL Models, the Dell PowerEdge server is well positioned to handle Generative AI workloads.